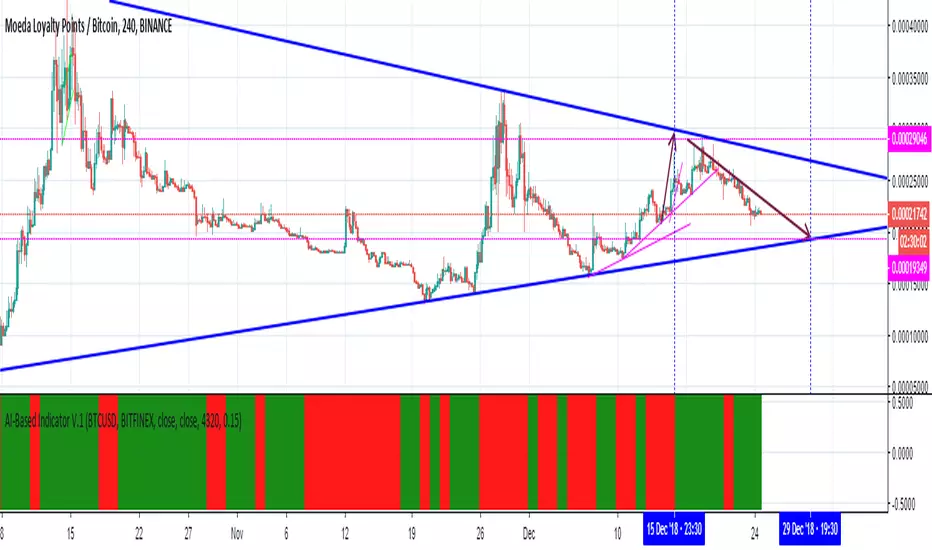
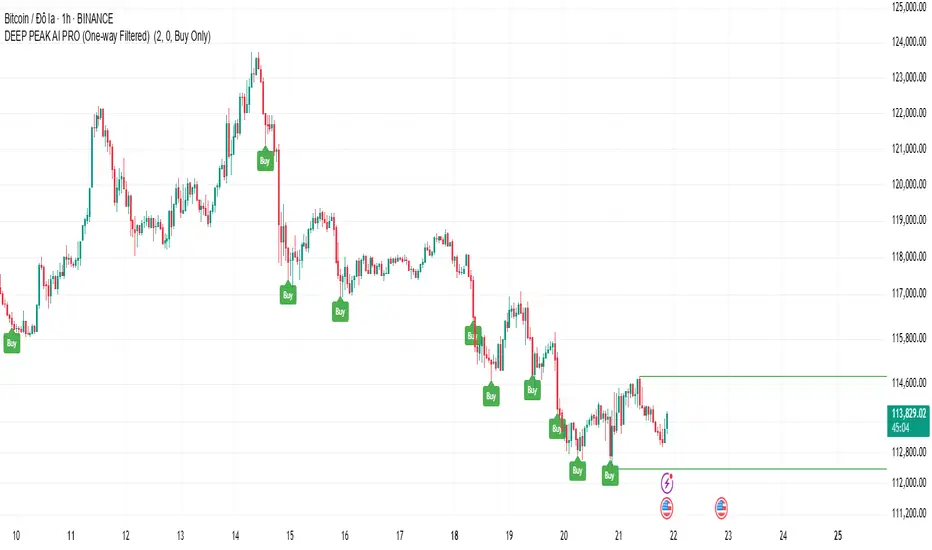
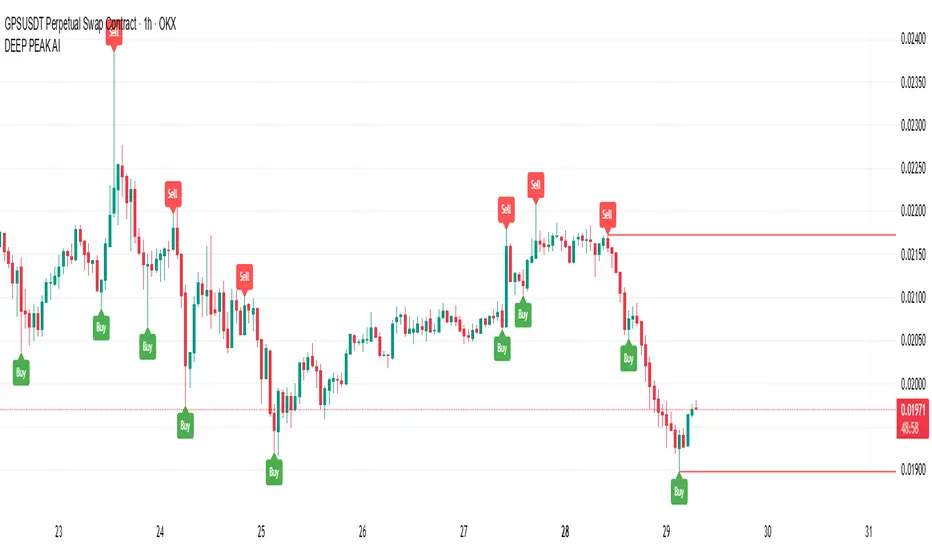
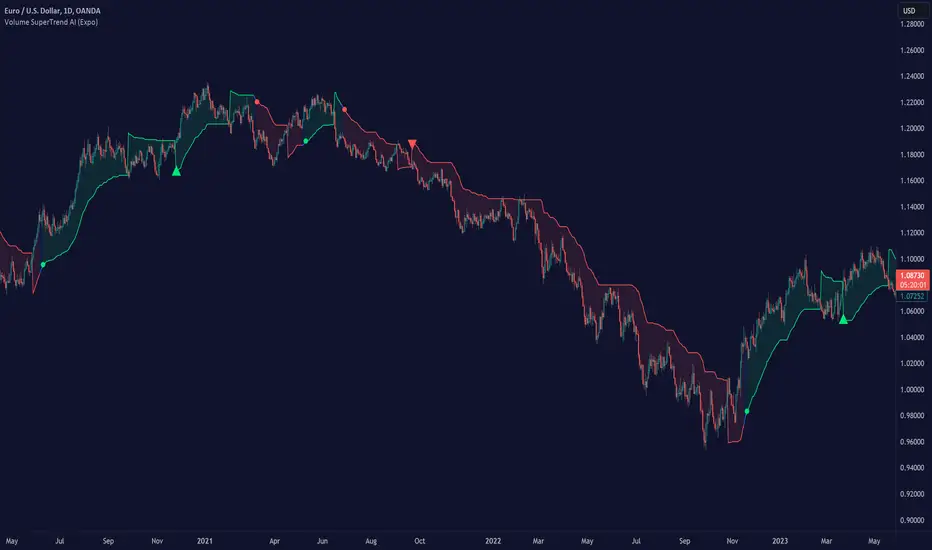
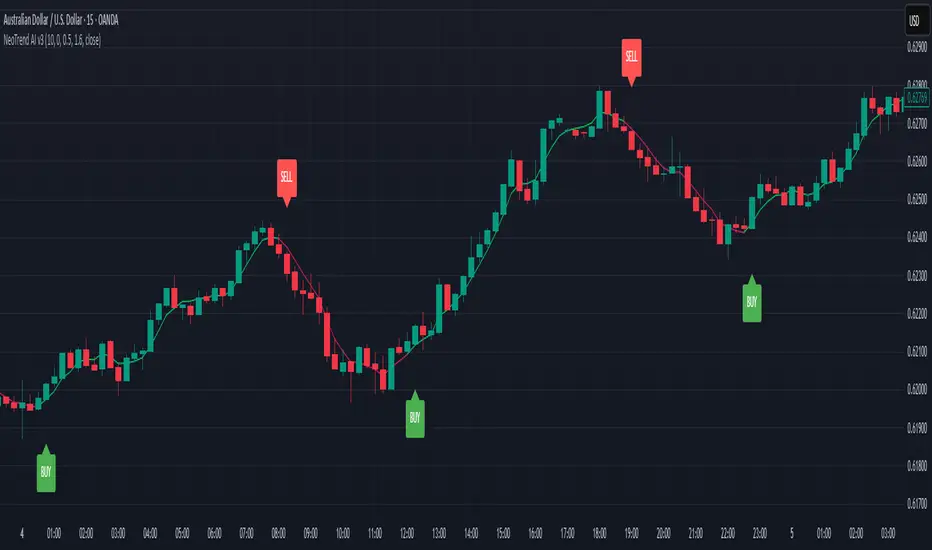
Flux AI PullBack System (Hybrid Pro)Flux AI PullBack System (Hybrid Pro)
//Session-Aware | Adaptive Confluence | Grace Confirm Logic//
Overview:
The Flux AI PullBack System (Hybrid Pro v5) is an adaptive, session-aware pullback indicator designed to identify high-probability continuation setups within trending markets. It automatically adjusts between “Classic” and “Enhanced” logic modes based on volatility, volume, and ATR slope, allowing it to perform seamlessly across different market sessions (Asian, London, and New York).
Core Features:
Hybrid Auto Mode — Dynamically switches between Classic (fast-moving) and Enhanced (strict) modes.
Session-Aware Context — Optimized for intraday trading in ES, NQ, and SPY.
Grace Confirmation Logic — Validates pullbacks with a follow-through condition to reduce noise.
Adaptive EMA Zone (38/62) — Highlights pullback areas with dynamic aqua fill and transparency linked to trend strength.
Noise Suppression Filter — Prevents false pullbacks during EMA crossovers or unstable transitions.
Weighted Confluence Model — Combines trend, ATR, volume, and swing structure for confirmation strength.
Pine v6 Compliant Alerts — Constant-string safe, ready for webhooks and automation.
Visual Elements:
Aqua EMA Zone: Displays the “breathing” pullback band (tightens during volatility spikes).
PB↑ / PB↓ Markers: Confirmed pullbacks with subtle transparency and fixed label size.
Bar Highlights: Yellow for pullbacks; ice-blue for confirmed continuation.
Use Cases
Perfect for:
Intraday trend traders
0DTE SPX / ES scalpers
Futures traders (NQ, MNQ, MES)
Algorithmic strategy builders using webhooks
Recommended Timeframes:
1–15 minute charts (scalping / intraday)
Higher timeframes for swing confirmations.
Attribution:
This open-source script was inspired by Chris Moody’s “CM Slingshot System” and JustUncleL’s Pullback Tools, but it was built from scratch using AI-assisted code refinement (ChatGPT).
All logic and enhancements are original, not derived from proprietary software.
License: MIT (Open Source)
© 2025 Ken Anderson — You may modify, use, or redistribute with credit.
Keywords:
Pullback, Reversal, AI Trading, EMA Zone, Session Aware, Futures Trading, SPX, ES, NQ, ATR Filter, Volume Confirmation, Flux System, Pine Script v6, Non-Repainting, Adaptive Trading Indicator.
Cerca negli script per "ai"
Luxmi AI Filtered Option Scalping Signals (INDEX)Introduction:
Luxmi AI Filtered Option Scalping Signals (INDEX) is an enhanced iteration of the Luxmi AI Directional Option Buying (Long Only) indicator. It's designed for use on index charts alongside the Luxmi AI Smart Sentimeter (INDEX) indicator to enhance performance. This indicator aims to provide refined signals for option scalping strategies, optimizing trading decisions within index markets.
Understanding directional bias is crucial when trading index and index options because it helps traders align their strategies with the expected movement of the underlying index.
The Luxmi AI Filtered Option Scalping Signals (INDEX) indicator aims to simplify and expedite decision-making through comprehensive technical analysis of various data points on a chart. By leveraging advanced analysis of data points, this indicator scrutinizes multiple factors simultaneously to offer traders clear and rapid insights into market dynamics.
The indicator is specifically designed for option scalping, a trading strategy that aims to profit from short-term price fluctuations. It prioritizes signals that are conducive to quick execution and capitalizes on rapid market movements typical of scalping strategies.
Major Features:
Trend Cloud:
Working Principle:
The script utilizes the Relative Strength Index (RSI) to assess market momentum, identifying bullish and bearish phases based on RSI readings. It calculates two boolean variables, bullmove and bearmove, which signal shifts in momentum direction by considering changes in the Exponential Moving Average (EMA) of the closing price. When RSI indicates bullish momentum and the closing price's EMA exhibits positive changes, bullmove is triggered, signifying the start of a bullish phase. Conversely, when RSI suggests bearish momentum and the closing price's EMA shows negative changes, bearmove is activated, marking the beginning of a bearish phase. This systematic approach helps in understanding the current trend of the price. The script visually emphasizes these phases on the chart using plot shape markers, providing traders with clear indications of trend shifts.
Benefits of Using Trend Cloud:
Comprehensive Momentum Assessment: The script offers a holistic view of market momentum by incorporating RSI readings and changes in the closing price's EMA, enabling traders to identify both bullish and bearish phases effectively.
Structured Trend Recognition: With the calculation of boolean variables, the script provides a structured approach to recognizing shifts in momentum direction, enhancing traders' ability to interpret market dynamics.
Visual Clarity: Plotshape markers visually highlight the start and end of bullish and bearish phases on the chart, facilitating easy identification of trend shifts and helping traders to stay informed.
Prompt Response: Traders can promptly react to changing market conditions as the script triggers alerts when bullish or bearish phases begin, allowing them to seize potential trading opportunities swiftly.
Informed Decision-Making: By integrating various indicators and visual cues, the script enables traders to make well-informed decisions and adapt their strategies according to prevailing market sentiment, ultimately enhancing their trading performance.
How to use this feature:
The most effective way to maximize the benefits of this feature is to use it in conjunction with other key indicators and visual cues. By combining the color-coded clouds, which indicate bullish and bearish sentiment, with other features such as IS candles, microtrend candles, volume candles, and sentimeter candles, traders can gain a comprehensive understanding of market dynamics. For instance, aligning the color of the clouds with the trend direction indicated by IS candles, microtrend candles, and sentimeter candles can provide confirmation of trend strength or potential reversals.
Furthermore, traders can leverage the trend cloud as a trailing stop-loss tool for long entries, enhancing risk management strategies. By adjusting the stop-loss level based on the color of the cloud, traders can trail their positions to capture potential profits while minimizing losses. For long entries, maintaining the position as long as the cloud remains green can help traders stay aligned with the prevailing bullish sentiment. Conversely, a shift in color from green to red serves as a signal to exit the position, indicating a potential reversal in market sentiment and minimizing potential losses. This integration of the trend cloud as a trailing stop-loss mechanism adds an additional layer of risk management to trading strategies, increasing the likelihood of successful trades while reducing exposure to adverse market movements.
Moreover, the red cloud serves as an indicator of decay in option premiums and potential theta effect, particularly relevant for options traders. When the cloud turns red, it suggests a decline in option prices and an increase in theta decay, highlighting the importance of managing options positions accordingly. Traders may consider adjusting their options strategies, such as rolling positions or closing out contracts, to mitigate the impact of theta decay and preserve capital. By incorporating this insight into options pricing dynamics, traders can make more informed decisions about their options trades.
Scalping Cloud:
The scalping cloud serves as a specialized component within the trend cloud feature, specifically designed to pinpoint potential long and short entry points within the overarching trend cloud. Here's how it works:
Trend Identification: The trend cloud feature typically highlights the prevailing trend direction based on various technical indicators, price action, or other criteria. It visually represents the momentum and direction of the market over a given period.
Refined Entry Signals: Within this broader trend context, the scalping cloud narrows its focus to identify shorter-term trading opportunities. It does this by analyzing more granular price movements and shorter timeframes, seeking out potential entry points that align with the larger trend.
Long and Short Entries: The scalping cloud distinguishes between potential long (buy) and short (sell) entry opportunities within the trend cloud. For instance, within an uptrend indicated by the trend cloud, the scalping cloud might identify brief retracements or pullbacks as potential long entry points. Conversely, in a downtrend, it may signal short entry opportunities during temporary upward corrections.
Risk Management: By identifying potential entry points within the context of the trend, the scalping cloud also aids in risk management. Traders can use these signals to place stop-loss orders and manage their positions effectively, reducing the risk of adverse price movements.
The scalping cloud operates by analyzing the crossover and crossunder events between two key indicators: the Double Exponential Moving Average (DEMA) and a Weighted Average. Here's how it works:
Double Exponential Moving Average (DEMA): DEMA is a type of moving average that seeks to reduce lag by applying a double smoothing technique to price data. It responds more quickly to price changes compared to traditional moving averages, making it suitable for identifying short-term trends and potential trading opportunities.
Weighted Average: The weighted average calculates the average price of an asset over a specified period. However, it incorporates a weighting scheme that assigns more significance to recent price data, resulting in a more responsive indicator that closely tracks current market trends.
CE and NO CE Signals:
CE signals typically represent a Long Scalping Opportunity, suggesting that conditions are favorable for entering a long position. These signals indicate a strong upward momentum in the market, which traders can exploit for short-term gains through scalping strategies.
On the other hand, when there are no CE signals present, it doesn't necessarily mean that the trend has reversed or turned bearish. Instead, it indicates that the trend is still bullish, but the market is experiencing an active pullback. During a pullback, prices may temporarily retreat from recent highs as traders take profits or reevaluate their positions. While the overall trend remains upward, the pullback introduces a degree of uncertainty, making it less favorable for entering new long positions.
In such a scenario, traders may opt to exercise caution and refrain from entering new long positions until the pullback phase has concluded. Instead, they might consider waiting for confirmation signals, such as the resumption of CE signals or other bullish indications, before reengaging in long positions.
PE and NO PE Signals:
PE signals typically indicate a Short Entry opportunity, signaling that market conditions are conducive to entering a short position.
Conversely, when there are no PE signals present, it signifies that while the trend remains bearish, the market is currently in an active phase of consolidation or pullback. During such periods, prices may temporarily rise from recent lows, reflecting a pause in the downward momentum. While the overall trend remains downward, the absence of PE signals suggests that it may not be an optimal time to enter new short positions.
In this context, traders may exercise caution and wait for clearer signals before initiating new short positions. They might monitor the market closely for signs of a resumption in bearish momentum, such as the emergence of PE signals or other bearish indications. Alternatively, traders may choose to wait on the sidelines until market conditions stabilize or provide clearer directional signals.
Working Principle Of CE and PE Signals:
The feature calculates candlestick values based on the open, high, low, and close prices of each bar. By comparing these derived candlestick values, it determines whether the current candlestick is bullish or bearish. Additionally, it signals when there is a change in the color (bullish or bearish) of the derived candlesticks compared to the previous bar, enabling traders to identify potential shifts in market sentiment.
Micro Trend Candles:
Working Principle:
This feature begins by initializing variables to determine trend channel width and track price movements. Average True Range (ATR) is then calculated to measure market volatility, influencing the channel's size. Highs and lows are identified within a specified range, and trends are assessed based on price breaches, with potential changes signaled accordingly. The price channel is continually updated to adapt to market shifts, and arrows are placed to indicate potential entry points. Colors are assigned to represent bullish and bearish trends, dynamically adjusting based on current market conditions. Finally, candles on the chart are colored to visually depict the identified micro trend, offering traders an intuitive way to interpret market sentiment and potential entry opportunities.
Benefits of using Micro Trend Candles:
Traders can use these identified micro trends to spot potential short-term trading opportunities. For example:
Trend Following: Traders may decide to enter trades aligned with the prevailing micro trend. If the candles are consistently colored in a certain direction, traders may consider entering positions in that direction.
Reversals: Conversely, if the script signals a potential reversal by changing the candle colors, traders may anticipate trend reversals and adjust their trading strategies accordingly. For instance, they might close existing positions or enter new positions in anticipation of a trend reversal.
It's important to note that these micro trends are short-term in nature and may not always align with broader market trends. Therefore, traders utilizing this script should consider their trading timeframes and adjust their strategies accordingly.
How to use this feature:
This feature assigns colors to candles to represent bullish and bearish trends, with adjustments made based on current market conditions. Green candles accompanied by a green trend cloud signal a potential long entry, while red candles suggest caution, indicating a bearish trend. This visual representation allows traders to interpret market sentiment intuitively, identifying optimal entry points and exercising caution during potential downtrends.
Scalping Candles (Inspired by Elliott Wave and Open Interest Concepts):
Working Principle:
This feature draws inspiration from the Elliot Wave method, utilizing technical analysis techniques to discern potential market trends and sentiment shifts. It begins by calculating the variance between two Exponential Moving Averages (EMAs) of closing prices, mimicking Elliot Wave's focus on wave and trend analysis. The shorter-term EMA captures immediate price momentum, while the longer-term EMA reflects broader market trends. A smoother Exponential Moving Average (EMA) line, derived from the difference between these EMAs, aids in identifying short-term trend shifts or momentum reversals.
Benefits of using Scalping Candles Inspired by Elliott Wave:
The Elliott Wave principle is a form of technical analysis that attempts to predict future price movements by identifying patterns in market charts. It suggests that markets move in repetitive waves or cycles, and traders can potentially profit by recognizing these patterns.
While this script does not explicitly analyze Elliot Wave patterns, it is inspired by the principle's emphasis on trend analysis and market sentiment. By calculating and visualizing the difference between EMAs and assigning colors to candles based on this analysis, the script aims to provide traders with insights into potential market sentiment shifts, which can align with the broader philosophy of Elliott Wave analysis.
How to use this feature:
Candlestick colors are assigned based on the relationship between the EMA line and the variance. When the variance is below or equal to the EMA line, candles are colored red, suggesting a bearish sentiment. Conversely, when the variance is above the EMA line, candles are tinted green, indicating a bullish outlook. Though not explicitly analyzing Elliot Wave patterns, the script aligns with its principles of trend analysis and market sentiment interpretation. By offering visual cues on sentiment shifts, it provides traders with insights into potential trading opportunities, echoing Elliot Wave's emphasis on pattern recognition and trend analysis.
Chart Timeframe Support and Resistance:
Working Principle:
This feature serves to identify and visualize support and resistance levels on the chart, primarily based on the chosen Chart Timeframe (CTF). It allows users to specify parameters such as the number of bars considered on the left and right sides of each pivot point, as well as line width and label color. Moreover, users have the option to enable or disable the display of these levels. By utilizing functions to calculate pivot highs and lows within the specified timeframe, the script determines the highest high and lowest low surrounding each pivot point.
Additionally, it defines functions to create lines and labels for each detected support and resistance level. Notably, this feature incorporates a trading method that emphasizes the concept of resistance turning into support after breakouts, thereby providing valuable insights for traders employing such strategies. These lines are drawn on the chart, with colors indicating whether the level is above or below the current close price, aiding traders in visualizing key levels and making informed trading decisions.
Benefits of Chart Timeframe Support and Resistance:
Identification of Price Levels: Support and resistance levels help traders identify significant price levels where buying (support) and selling (resistance) pressure may intensify. These levels are often formed based on historical price movements and are regarded as areas of interest for traders.
Decision Making: Support and resistance levels assist traders in making informed trading decisions. By observing price reactions near these levels, traders can gauge market sentiment and adjust their strategies accordingly. For example, traders may choose to enter or exit positions, set stop-loss orders, or take profit targets based on price behavior around these levels.
Risk Management: Support and resistance levels aid in risk management by providing reference points for setting stop-loss orders. Traders often place stop-loss orders below support levels for long positions and above resistance levels for short positions to limit potential losses if the market moves against them.
How to use this feature:
Planning Long Positions: When considering long positions, it's advantageous to strategize when the price is in proximity to a support level identified by the script. This suggests a potential area of buying interest where traders may expect a bounce or reversal in price. Additionally, confirm the bullish bias by ensuring that the trend cloud is green, indicating favorable market conditions for long trades.
Waiting for Breakout: If long signals are generated near resistance levels detected by the script, exercise patience and wait for a breakout above the resistance. A breakout above resistance signifies potential strength in the upward momentum and may present a more opportune moment to enter long positions. This approach aligns with trading methodologies that emphasize confirmation of bullish momentum before initiating trades.
StopLoss and Target Lines:
In addition to generating entry signals, this indicator also incorporates predefined stop-loss ray lines and configurable risk-reward (R:R) target lines to enhance risk management and profit-taking strategies. Here's how these features work:
Predefined Stop-loss Ray Lines: The indicator automatically plots stop-loss ray lines on the chart, serving as visual guidelines for setting stop-loss levels. These stop-loss lines are predetermined based on specific criteria, such as volatility levels, support and resistance zones, or predefined risk parameters. Traders can use these lines as reference points to place their stop-loss orders, aiming to limit potential losses if the market moves against their position.
Configurable Risk-Reward (R:R) Target Lines: In addition to stop-loss lines, the indicator allows traders to set configurable risk-reward (R:R) target lines on the chart. These target lines represent predefined price levels where traders intend to take profits based on their desired risk-reward ratio. By adjusting the placement of these lines, traders can customize their risk-reward ratios according to their trading preferences and risk tolerance.
Risk Management: The predefined stop-loss ray lines help traders manage risk by providing clear exit points if the trade goes against their expectations. By adhering to these predetermined stop-loss levels, traders can minimize potential losses and protect their trading capital, thereby enhancing overall risk management.
Profit-taking Strategy: On the other hand, the configurable R:R target lines assist traders in establishing profit-taking strategies. By setting target levels based on their desired risk-reward ratio, traders can aim to capture profits at predefined price levels that offer favorable risk-reward profiles. This allows traders to systematically take profits while ensuring that potential gains outweigh potential losses over the long term.
The stop-loss and target lines incorporated in this indicator are dynamic in nature, providing traders with the flexibility to utilize them as trailing stop-loss and extended take-profit targets. Here's how these dynamic features work:
Trailing Stop-loss: Traders can employ the stop-loss lines as trailing stop-loss levels, allowing them to adjust their stop-loss orders as the market moves in their favor. As the price continues to move in the desired direction, indicator can dynamically adjust the stop-loss line to lock in profits while still allowing room for potential further gains. This trailing stop-loss mechanism helps traders secure profits while allowing their winning trades to continue running as long as the market remains favorable.
Extended Take Profit Targets: Similarly, traders can utilize the target lines as extended take-profit targets, enabling them to capture additional profits beyond their initial profit targets. By adjusting the placement of these target lines based on evolving market conditions or technical signals, traders can extend their profit-taking strategy to capitalize on potential price extensions or trend continuations. This flexibility allows traders to maximize their profit potential by capturing larger price movements while managing their risk effectively.
Rangebound Bars:
When the Rangebound Bars feature is enabled, the indicator represents candles in a distinct purple color to visually denote periods of sideways or range-bound price action. This visual cue helps traders easily identify when the market is consolidating and lacking clear directional momentum. Here's how it works:
Purple Candle Color: When the Rangebound Bars feature is active, the indicator displays candlesticks in a purple color to highlight periods of sideways price movement. This color differentiation stands out against the usual colors used for bullish (e.g., green or white) and bearish (e.g., red or black) candles, making it easier for traders to recognize range-bound conditions at a glance.
Signaling Sideways Price Action: The purple coloration of candles indicates that price movements are confined within a relatively narrow range and lack a clear upward or downward trend. This may occur when the market is consolidating, experiencing indecision, or undergoing a period of accumulation or distribution.
Working Principle:
The Rangebound Bars feature of this indicator is designed to assist traders in identifying and navigating consolidating market conditions, where price movements are confined within a relatively narrow range. This feature utilizes Pivot levels and the Average True Range (ATR) concept to determine when the market is range-bound and provides signals to stay out of such price action. Here's how it works:
Pivot Levels: Pivot levels are key price levels derived from the previous period's high, low, and closing prices. They serve as potential support and resistance levels and are widely used by traders to identify significant price levels where price action may stall or reverse. The Rangebound Bars feature incorporates Pivot levels into its analysis to identify ranges where price tends to consolidate.
Average True Range (ATR): The Average True Range is a measure of market volatility that calculates the average range between the high and low prices over a specified period. It provides traders with insights into the level of price volatility and helps set appropriate stop-loss and take-profit levels. In the context of the Rangebound Bars feature, ATR is used to gauge the extent of price fluctuations within the identified range.
Luxmi AI Smart Sentimeter (Index) "Performance or the direction of indices depend on the performance or direction of its constituents"
The above statement succinctly highlights the fundamental relationship between the movements of stock indices and the individual stocks that comprise them. Essentially, the statement underscores the fact that the overall performance and direction of an index are directly influenced by the collective performance and direction of its constituent stocks.
In essence, when the majority of stocks within an index experience positive movements, such as price increases or upward trends, the index itself tends to rise. Conversely, if a significant number of constituent stocks exhibit negative movements, such as price decreases or downward trends, the index is likely to decline.
This interdependence between indices and their constituents reflects the broader market sentiment and economic conditions. Individual stock movements contribute to the overall market sentiment, which is reflected in the movements of the index. Therefore, investors and traders often analyze the performance of underlying constituents to gain insights into market trends, sentiment shifts, and potential trading opportunities.
In summary, the statement emphasizes the integral role that individual stocks play in shaping the performance and direction of stock indices, highlighting the importance of monitoring constituent stocks when analyzing and trading in the financial markets.
Analyzing the performance of underlying constituents is crucial when trading index futures and options due to several reasons:
Index Composition Impact: Index futures and options derive their value from the performance of the underlying index, which, in turn, is determined by the constituent stocks. Understanding how individual stocks within the index are performing provides insights into the broader market sentiment and direction.
Diversification Assessment: Indices typically consist of a diverse range of stocks across various sectors. Analyzing the performance of these constituent stocks allows traders to assess the overall health of the market and identify sector-specific trends or weaknesses. This information is vital for constructing a well-diversified portfolio and managing risk effectively.
Sector Rotation Strategies: Different sectors perform differently under various market conditions. Analyzing the performance of underlying constituents enables traders to identify sectors that are outperforming or underperforming relative to the broader market. This insight can be utilized to implement sector rotation strategies, where traders adjust their portfolio allocations based on the expected performance of different sectors.
Options Pricing and Hedging: In options trading, the performance of underlying constituents directly affects the pricing of options contracts. Volatility, correlation among stocks, and individual stock movements all influence options prices. By analyzing the performance of underlying constituents, traders can better understand the factors driving options pricing and implement more effective hedging strategies.
Technical Analysis Confirmation: Technical analysis techniques often rely on price movements and patterns observed in individual stocks. Analyzing the performance of underlying constituents can confirm or invalidate technical signals generated by the index itself, providing additional conviction for trading decisions.
In summary, analyzing the performance of underlying constituents when trading index futures and options is essential for understanding market dynamics, identifying trading opportunities, managing risk, and making informed trading decisions. By staying informed about individual stock movements within an index, traders can gain a deeper understanding of market trends and position themselves for success in the ever-changing financial markets.
Workng Principle of Luxmi AI Smart Sentimeter:
The Luxmi AI Smart Sentimeter indicator is a powerful tool designed for traders to gain insights into market sentiment and trend strength. This indicator amalgamates data from multiple stocks to provide a comprehensive overview of market conditions. Let's delve into its components, functionalities, and potential applications.
Firstly, the indicator allows users to input symbols for up to ten different stocks. These symbols serve as the basis for retrieving closing prices, which are essential for conducting technical analysis. The flexibility to choose symbols empowers traders to tailor their analysis according to their preferences and market focus.
The indicator's core functionality revolves around the calculation of a combined Moving Averages of various lenghts, which aggregates the closing prices of the selected stocks. This combined combined analysis serves as a pivotal metric for assessing overall market trends and sentiment. By incorporating data from multiple stocks, the indicator offers a holistic view of market dynamics, reducing the impact of individual stock fluctuations.
To further refine the analysis, the combined Moving Average Data undergoes a smoothing process using another additional Moving Average (SMA). This smoothing mechanism helps filter out noise and provides a clearer depiction of underlying trends, thereby enhancing the indicator's effectiveness.
Moreover, the indicator computes an oscillator by measuring the difference between the combined MA and the smoothed MA. This oscillator serves as a valuable tool for gauging trend strength and identifying potential reversal points in the market, offering further insights into market momentum and directionality.
The indicator's graphical representation includes plots of the oscillator and its MA, facilitating visual interpretation of trend dynamics and momentum shifts. Furthermore, the script generates visual signals, such as UP and DOWN triangles, to highlight crossover and crossunder events on the oscillator, aiding traders in making timely and informed trading decisions.
In practice, the Luxmi AI Smart Sentimeter indicator offers a myriad of applications for traders across various trading styles and timeframes. Traders can utilize it to assess market sentiment, identify trend reversals, and confirm trade signals generated by other technical indicators. Additionally, the indicator can serve as a valuable tool for conducting market analysis, formulating trading strategies, and managing risk effectively.
In conclusion, the Luxmi AI Smart Sentimeter indicator represents a sophisticated yet accessible tool for traders seeking to navigate the complexities of the financial markets. With its robust features, customizable parameters, and insightful analysis, this indicator stands as a testament to the potential of data-driven approaches in trading and investment.
Settings:
The Index Constituent Analysis setting empowers users to input the constituents of a specific index, facilitating the analysis of market sentiments based on the performance of these individual components. An index serves as a statistical measure of changes in a portfolio of securities representing a particular market or sector, with constituents representing the individual assets or securities comprising the index.
By providing the constituent list, users gain insights into market sentiments by observing how each constituent performs within the broader index. This analysis aids traders and investors in understanding the underlying dynamics driving the index's movements, identifying trends or anomalies, and making informed decisions regarding their investment strategies.
This setting empowers users to customize their analysis based on specific indexes relevant to their trading or investment objectives, whether tracking a benchmark index, sector-specific index, or custom index. Analyzing constituent performance offers a valuable tool for market assessment and decision-making.
Example: BankNifty Index and Its Constituents
Illustratively, the BankNifty index represents the performance of the banking sector in India and includes major banks and financial institutions listed on the National Stock Exchange of India (NSE). Prominent constituents of the BankNifty index include:
State Bank of India (SBIN)
HDFC Bank
ICICI Bank
Kotak Mahindra Bank
Axis Bank
IndusInd Bank
Punjab National Bank (PNB)
Yes Bank
Federal Bank
IDFC First Bank
By utilizing the Index Constituent Analysis setting and inputting these constituent stocks of the BankNifty index, traders and investors can assess the individual performance of these banking stocks within the broader banking sector index. This analysis enables them to gauge market sentiments, identify trends, and make well-informed decisions regarding their trading or investment strategies in the banking sector.
Example: NAS100 Index and Its Constituents
Similarly, the NAS100 index, known as the NASDAQ-100, tracks the performance of the largest non-financial companies listed on the NASDAQ stock exchange. Prominent constituents of the NAS100 index include technology and consumer discretionary stocks such as:
Apple Inc. (AAPL)
Microsoft Corporation (MSFT)
Amazon.com Inc. (AMZN)
Alphabet Inc. (GOOGL)
Facebook Inc. (FB)
Tesla Inc. (TSLA)
NVIDIA Corporation (NVDA)
PayPal Holdings Inc. (PYPL)
Netflix Inc. (NFLX)
Adobe Inc. (ADBE)
By inputting these constituent stocks of the NAS100 index into the Index Constituent Analysis setting, traders and investors can analyze the individual performance of these technology and consumer discretionary stocks within the broader NASDAQ-100 index. This analysis facilitates the evaluation of market sentiments, identification of trends, and informed decision-making regarding trading or investment strategies in the technology and consumer sectors.
Example: FTSE 100 Index and Its Constituents
The FTSE 100 index represents the performance of the 100 largest companies listed on the London Stock Exchange (LSE) by market capitalization. Some notable constituents of the FTSE 100 index include:
HSBC Holdings plc
BP plc
GlaxoSmithKline plc
Unilever plc
Royal Dutch Shell plc
AstraZeneca plc
Diageo plc
Rio Tinto plc
British American Tobacco plc
Reckitt Benckiser Group plc
Timeframe Selection:
If a traders wshes to analyze the constituent in a higher timeframe they can simply switch to HTF from the dropdown without changing the chart timeframe.
Weight:
Weight needs to be a positive number when applied on the index future or call option charts.
Weight must be configured to a negative number when this indicator is applied on a put option chart (Put options move in the opposite direction compared to it's stock or index).
Happy Trading,
Affirmify AI — Entry PrecisionAffirmify AI — Entry Precision is a multi-factor directional model with entry-quality filter and ATR-based SL/TP, synced with the Affirmify core engine.
What is Affirmify AI — Entry Precision?
Affirmify AI — Entry Precision is the TradingView front-end of the Affirmify core model.
It combines:
multi-timeframe trend filters
momentum & volatility conditions
an entry-quality check (candle body vs ATR)
ATR-based SL/TP engine
The script is designed to mirror the logic of the Affirmify Python backend used on AffirmifyHub.com.
Core idea
1.Score (core direction):
Built from ADX, EMA trend, RSI zone, MACD histogram, DI+/DI- and ATR volatility penalty.
Score ≥ +2 → BUY bias
Score ≤ −2 → SELL bias
Between −1 and +1 → no clear direction.
2.Higher-timeframe (MTF) confirmation:
Same style of scoring on a higher TF (default 4H).
If MTF direction conflicts with the main timeframe, the script will show “MTF conflict / NO TRADE” and block signals.
3.Entry quality filter:
Checks if the candle body is large enough vs ATR (Min body size (x ATR)).
Output:
CONFIRMED – direction + volatility + body are aligned
WAIT FOR BETTER ENTRY – direction ok, but body is too small
NO QUALITY ENTRY – conditions are not met.
4.ATR-based SL/TP engine:
Internal engine (uses ATR × multiplier or minimal tick distance).
Values are shown on the panel only (no lines drawn on chart), so the chart stays clean.
Panel overview
The panel in the top-right shows:
Action – BUY / SELL / NO TRADE
Status – CONFIRMED / WAIT FOR BETTER ENTRY / NO SIGNAL / MTF conflict
Entry – last confirmed entry price
SL / TP – suggested ATR-based stop-loss and take-profit
Higher TF – higher timeframe filter state (ON/OFF and TF used)
Score – core multi-factor score on the current timeframe
Vol – “Normal volatility” or “Low volatility (ATR penalized)”
Inputs – quick guide
Trend & Filters
EMA Fast / Mid / Slow – EMAs used for trend & bias detection
ADX Length – period for ADX (trend strength)
RSI Length – period for RSI zone filter
ATR Length – ATR used for volatility & body/SL/TP logic
Low ATR threshold (% of price) – defines when the market is considered “low volatility”.
Higher timeframe confirmation
Use higher timeframe filter – enable / disable MTF confirmation
Higher TF – e.g. 240 (4H), 60 (1H), etc.
Entry Precision
Min body size (x ATR) – minimum body vs ATR required for a CONFIRMED entry.
SL / TP
Min SL = ATR x – minimal ATR distance for SL
Min TP = ATR x – minimal ATR distance for TP
Min SL in ticks / Min TP in ticks – hard floor, based on instrument tick size.
Visuals
Show info panel – show / hide the top-right dashboard
Show status badges – textual badges above the last candle
Draw ENTRY/SL/TP (panel only, legacy) – kept for compatibility; does not draw lines in this version.
Alerts
The script provides three alert conditions:
Affirmify: BUY confirmed
Triggered when BUY direction is aligned and entry quality is CONFIRMED (no MTF conflict).
Affirmify: SELL confirmed
Triggered when SELL direction is aligned and entry quality is CONFIRMED (no MTF conflict).
Affirmify: wait for better entry
Direction is valid, but candle body is not yet strong enough – potential setup forming.
You can connect these alerts to your own automation, bots or dashboards.
How to use it (typical workflow)
Select your symbol and timeframe (most users focus on 1H / 4H).
Wait for the panel to show a clear Action (BUY or SELL) with a solid Score (≥ +2 or ≤ −2).
Look for Status = CONFIRMED for actual entries.
Use the panel SL / TP values as a starting point for your own risk management.
Avoid trades when:
Status shows “NO SIGNAL” or “NO CLEAR DIRECTION”
MTF conflict is active
Volatility is extremely low for your style.
Access & subscription
This is an invite-only script connected to the AffirmifyHub ecosystem.
Access is managed via private subscription on AffirmifyHub.com.
After activation you will receive TradingView access to this indicator from the author account.
For questions about access, licensing or private use, please contact the author via TradingView DM or through AffirmifyHub.
Important notice
This tool does not guarantee profits and should never be used as a standalone decision engine.
Always combine it with:
your own price action reading
multi-timeframe context
strict position sizing and risk management.
Markets are risky – never trade money you cannot afford to lose.Multi-factor directional model with entry-quality filter and ATR-based SL/TP levels, synced with the Affirmify core Python engine.
AOT Red Storm V25 Adaptive EditionOverview
AOT Red Storm V25 is an invite-only, institutional-style trend suite designed for intraday and swing traders.
It does not try to predict exact tops or bottoms. Instead, it focuses on:
Multi-timeframe trend alignment
Smart 8-minute internal timeframe for cleaner structure
Adaptive support/resistance zones
Volatility and volume-based risk filtering
A compact HUD to summarize market state in one glance
Core Components
This script is not a simple mashup of public indicators.
It integrates several classic building blocks into a single, coherent decision framework:
Adaptive Supertrend Core:
Supertrend is calculated on an internal 8-minute timeframe (for intraday charts up to 60m), which we found offers a better balance between noise and structure for crypto futures.
WaveTrend Tactical Radar:
WaveTrend is only used for exit timing and risk-off zones (overheat / exhaustion), not as a standalone entry trigger. It works together with the trend core and cooldown logic.
Dual-Layer Support & Resistance:
Local SR zones are drawn on the current chart for execution precision, while 30m-level zones track higher-timeframe liquidity and turning areas.
Trendlines & Structural BOS:
Automatic trendlines and BOS (Break of Structure) are derived from pivot points, to visualize trend continuation vs. potential reversals.
Volatility & Volume Risk Filter:
Abnormal range bars and daily volume completion are monitored to help traders avoid chasing dangerous moves.
AI-style HUD Panel:
The on-chart HUD summarizes trend, momentum, volatility, and volume completion into a compact dashboard so traders don’t need to open multiple indicators.
How it works in practice
The 8-minute engine drives the main trend color and entry markers.
Local & 30m SR zones provide execution context and profit-taking areas.
WaveTrend helps identify when to reduce risk or take partial profits during extended moves.
The HUD acts as a “mission control” view to keep the trader aligned with the dominant state of the market.
Intended Use
For traders who already understand risk management and position sizing.
As a decision support tool, not as an auto-trading holy grail.
Best used on BTC/ETH futures from 1m–30m charts.
What it is NOT
It is not a guaranteed-profit system.
It is not an AI that predicts the future.
It does not replace your own risk control or psychology.
Risk Notice
Trading and investing involve risk. Historical behavior of any logic or visual structure does not guarantee future results. This script is for informational and educational purposes only and does not constitute financial advice.
概览
AOT Red Storm V25 是一套面向实盘交易员的“机构级趋势可视化套件”,采用封闭源码 + 邀请制。
它不是在“预测行情”,而是帮助你:
对齐多周期趋势结构
用 8 分钟内部周期做更干净的趋势骨架
叠加本地 + 30m 双重支撑阻力
利用波动率和成交量过滤危险行情
用一个 HUD 面板把核心信息集中展示
核心模块
8m SuperTrend 趋势骨架:内部固定使用 8 分钟周期来做趋势与结构识别,减少噪音。
WaveTrend 战术雷达:只用于辅助止盈/减仓,而不是单独进场信号。
本地 + 30m 支撑阻力区:当前周期做精确执行,30m 负责定位大级别流动性区域。
自动趋势线 + BOS:用结构高低点标记 HH/LL / BOS,辅助趋势延续与反转识别。
波动 & 量能风控:用异常大K / 当日量能进度,提示极端风险。
AI 风格 HUD 面板:把趋势、动能、波动率、量能等压缩在一个信息面板中。
适用人群
有一定交易经验,重视风控与执行纪律的交易员;
用作决策辅助,而不是“闭眼跟随”的圣杯系统;
建议用于 BTC/ETH 永续 1–30m 等周期。
不是什么
不保证稳定盈利;
不预测未来;
不替代你的仓位管理与心理建设。
Bayesian Order Flow Predictor📌 Bayesian Order Flow Predictor — Advanced Probability Engine for Nasdaq and Futures
This indicator is a next-generation probabilistic forecasting system designed for Nasdaq traders who rely on Order Flow, Auction Market Theory, Value Area dynamics, market structure, DOM imbalance, and Bayesian probability models.
It combines 7 professional-grade factors (DOM, CVD, RSI, EMA trend, ATR volatility, Market Structure, Value Area positioning) into a unified Bayesian probability panel that outputs a clean bullish/bearish probability curve with high-confidence reversal and trend-continuation signals.
Engineered for scalpers, day traders, futures traders, and ICT-style order flow technicians, it delivers real-time directional probability, session-aware signals, and optional news-filter exclusion.
⭐ Features
Bayesian Probability Model (0–100%)
DOM imbalance scoring across dynamic depth levels
Cumulative Volume Delta (CVD) scoring
Market structure detection (HH/LL micro-trend shifts)
RSI momentum and overbought/oversold scoring
EMA directional bias + ATR-normalized deviation
Value Area positioning (VAH / VAL / POC) with optional previous-session mode
Session filtering (only signals during active hours)
Automated news filter (exclude signals around scheduled macro events)
Bull/Bear probability zones with background coloring
Anti-repetition system (no double signals in same direction)
Designed for future scalping, futures order flow, and high-precision timing
🧠 Bayesian Probability Engine — How It Works
The model evaluates 7 independent market factors simultaneously:
DOM imbalance
CVD pressure
Market structure
RSI deviation
EMA trend
Value Area position
ATR volatility shift
Each factor is transformed into a normalized score, multiplied by its weighting parameter, and aggregated into a global score.
This score is then passed through a Bayesian logistic function to convert uncertainty into a smooth probability curve, giving traders a clean, mathematically stable, and noise-resistant forecast.
📈 Buy & Sell Signal Logic
Signals trigger when:
Bullish Probability crosses above the user threshold
Bearish Probability crosses below the opposite threshold
Session is active
No protected news event is occurring
This avoids noise, prevents over-signaling, and focuses only on high-confidence inflection points.
🎯Fully compatible with the indicator: ➡️ AI Probabilistic Orderflow scalper
Both indicators synchronize perfectly when used together:
Bayesian panel → trend probability
Scalper v1 → timing + TP/SL engine
Together they create a complete probability-driven revenue management system for scalping Future.
📘 How to Use
Add the indicator to your chart
Set your trading session (e.g., 09:30–16:00 EST)
Adjust weights depending on your style (Order Flow / Momentum / Value Area)
Watch the probability curve:
Above threshold → bullish bias
Below threshold → bearish bias
Take signals when the curve crosses thresholds, not when flat
Combine with "AI Probabilistic Orderflow scalper" indicator for execution timing
Avoid high-impact news using the News Filter
💎 Advantages
Professional-grade Bayesian model
Works in all volatility regimes
Noise-resistant and smoother than traditional oscillators
Integrates Order Flow + Auction Theory + Momentum + Volatility
Perfect for NQ scalpers seeking an AI-style probability dashboard
Reduces emotional decision-making
Compatible with any execution strategy
Optimized for high winrate scalping and sniper entries
Buy and Sell With AI - 3.0
Buy and Sell AI – 3.0
**Overview**
**Buy and Sell AI – 3.0** is an educational technical indicator designed to help traders structure entries, stop-loss and target planning, risk management, and multi-timeframe trend reading in one place. It does **not** place trades or guarantee profit; it simply visualizes rules you configure yourself.
The script supports different trading styles (Scalping/Intraday, Swing, Positional) and adapts its internal filters accordingly. Signals are shown as shapes on the chart (B/S for main signals, B1/S1 for standalone), with optional retest and reversal markers for conservative or loss-recovery–style approaches.
**Key Features**
* **Signal Generation**: Filtered buy/sell signals using a combination of trend, momentum and volume conditions (including moving averages, RSI-style noise reduction, ADX trend strength and volume surge/breakout checks).
* **Risk & Execution Tools**: Automatically draws entry, SL and up to three RR-based TP levels (1:1, 1:2, 1:3 style), with optional position-size guidance based on account size and risk % per trade. Supports stocks, forex, crypto, indices and commodities through an asset-type and point-value framework, plus an optional ITM strike helper for options.
* **Enhancements**: Gap-avoidance filter, optional retest-based conservative entries, and optional reversal signals on failed trades with a daily cap.
* **Visuals & Trend Meter**: Customizable lines and labels (colors, widths, positions, font sizes), plus a simple higher-timeframe trend meter (e.g., Daily/Weekly/Monthly) and a “smart rebalancer” reference line for positional or investment-style monitoring.
* **Alerts**: Flexible alert system for all major signal types (B, S, B1, S1 and reversal events), with a master on/off switch and per-type toggles.
**Input Settings (Summary)**
* **Disclaimer**: Mandatory checkbox to enable (educational use only; no liability).
* **Trading Style & Filters**: Choose Scalping/Intraday, Swing or Positional; toggle AI trend filter, RSI-based noise filter, volume/momentum filter and ADX trend filter.
* **Volume & Advanced Controls**: Configure volume breakout/surge periods and multipliers, reversal signals (1:1 / 1:2, max reversals per day), retest labels and gap threshold %.
* **Asset & Risk Management**: Auto or manual asset type (Stock/Forex/Crypto/Index/Commodity), account size, risk % per trade, SL mode (entry or previous candle), optional manual point values for indices and strike interval for options.
* **Display & Trend Meter**: Settings for entry/SL/TP lines and labels, position size/points/% display, trend meter table position and selected higher timeframes.
**Usage & Legal Note**
Apply it to any symbol and timeframe, then customize the inputs to fit your own trading or study style. This indicator is strictly for **educational and informational purposes only**. It is **not** financial advice, a signal service, or a portfolio management tool. Trading and investing involve substantial risk, and you may lose part or all of your capital. Past performance is not a guarantee of future results. The creator is **not** a SEBI-registered investment advisor. By using this script, you confirm that you understand these risks and accept full responsibility for your own decisions and outcomes.
AlgoAIDESIGNED FOR HEIKEN ASHI BARS
Gain Access here: algoai.store
AlgoAI
The Dark Edge of Trading
An AI-powered TradingView strategy that thrives across all markets. Short altcoin pumps. Ride NAS100 waves. Dominate gold, FX, stocks, and futures — all with one AI brain.
#1
Semi-Automatic Trading (Recommended)
Set up alerts on AlgoAI signals. As they come in, grade the setups and choose to enter manually. This gives you full control while leveraging AI precision.
#2
Fully Automated Trading
Pass signals via webhooks to TradersPost for futures or PineConnector for FX. Note: When running fully automated, it's suggested to use long-only or short-only mode to avoid side swiping and potential unintended drawdown.
BITSTAMP:BTCUSD
Maple Algorithm_GOLDMaple Algorithm – AI-Powered Gold Indicator
Maple Algorithm is an AI-inspired indicator designed specifically around the price behavior of Gold (XAUUSD).
It automatically calculates and plots take-profit (TP) and stop-loss (SL) levels based on dynamic market conditions, allowing traders to capture precise entries and exits.
✨ Key Features
AI-driven adaptive model trained on Gold’s market structure
Auto-generated TP/SL zones for precision trading
Compatible with your own strategies — scale from 1:2 RRR up to even higher setups
Optimized for scalping and short-term momentum bursts
⚠️ Disclaimer:
This indicator is for educational and research purposes only. It does not guarantee future results. Always test thoroughly before applying to live trading.
SuperTrend AI Oscillator StrategySuperTrend AI Oscillator Strategy
Overview
This strategy is a trend-following approach that combines the SuperTrend indicator with oscillator-based filtering.
By identifying market trends while utilizing oscillator-based momentum analysis, it aims to improve entry precision.
Additionally, it incorporates a trailing stop to strengthen risk management while maximizing profits.
This strategy can be applied to various markets, including Forex, Crypto, and Stocks, as well as different timeframes. However, its effectiveness varies depending on market conditions, so thorough testing is required.
Features
1️⃣ Trend Identification Using SuperTrend
The SuperTrend indicator (a volatility-adjusted trend indicator based on ATR) is used to determine trend direction.
A long entry is considered when SuperTrend turns bullish.
A short entry is considered when SuperTrend turns bearish.
The goal is to capture clear trend reversals and avoid unnecessary trades in ranging markets.
2️⃣ Entry Filtering with an Oscillator
The Super Oscillator is used to filter entry signals.
If the oscillator exceeds 50, it strengthens long entries (indicating strong bullish momentum).
If the oscillator drops below 50, it strengthens short entries (indicating strong bearish momentum).
This filter helps reduce trades in uncertain market conditions and improves entry accuracy.
3️⃣ Risk Management with a Trailing Stop
Instead of a fixed stop loss, a SuperTrend-based trailing stop is implemented.
The stop level adjusts automatically based on market volatility.
This allows profits to run while managing downside risk effectively.
4️⃣ Adjustable Risk-Reward Ratio
The default risk-reward ratio is set at 1:2.
Example: A 1% stop loss corresponds to a 2% take profit target.
The ratio can be customized according to the trader’s risk tolerance.
5️⃣ Clear Trade Signals & Visual Support
Green "BUY" labels indicate long entry signals.
Red "SELL" labels indicate short entry signals.
The Super Oscillator is plotted in a separate subwindow to visually assess trend strength.
A real-time trailing stop is displayed to support exit strategies.
These visual aids make it easier to identify entry and exit points.
Trading Parameters & Considerations
Initial Account Balance: Default is $7,000 (adjustable).
Base Currency: USD
Order Size: 10,000 USD
Pyramiding: 1
Trading Fees: $0.94 per trade
Long Position Margin: 50%
Short Position Margin: 50%
Total Trades (M5 Timeframe): 1,032
Visual Aids for Clarity
This strategy includes clear visual trade signals to enhance decision-making:
Green "BUY" labels for long entries
Red "SELL" labels for short entries
Super Oscillator plotted in a subwindow with a 50 midline
Dynamic trailing stop displayed for real-time trend tracking
These visual aids allow traders to quickly identify trade setups and manage positions with greater confidence.
Summary
The SuperTrend AI Oscillator Strategy is developed based on indicators from Black Cat and LuxAlgo.
By integrating high-precision trend analysis with AI-based oscillator filtering, it provides a strong risk-managed trading approach.
Important Notes
This strategy does not guarantee profits—performance varies based on market conditions.
Past performance does not guarantee future results. Markets are constantly changing.
Always test extensively with backtesting and demo trading before using it in live markets.
Risk management, position sizing, and market conditions should always be considered when trading.
Conclusion
This strategy combines trend analysis with momentum filtering, enhancing risk management in trading.
By following market trends carefully, making precise entries, and using trailing stops, it seeks to reduce risk while maximizing potential profits.
Before using this strategy, be sure to test it thoroughly via backtesting and demo trading, and adjust the settings to match your trading style.
MAHA Luxmi AI Candles [Overlay]The MAHA Luxmi AI Candles trading indicator is a sophisticated tool designed to assist traders in identifying potential trading opportunities by utilizing a combination of Moving Average (MA) and Heikin-Ashi (HA) techniques, further enhanced with a custom formula. Here’s a detailed breakdown of its functionalities:
1. Integration of MA and HA Techniques
MAHA stands for Moving Average and Heikin-Ashi. This indicator modifies these traditional techniques with a unique custom formula, aiming to provide more accurate and reliable signals for traders. The combination enhances the smoothing effect of Moving Averages with the trend indication of Heikin-Ashi candles.
2. Four-Colored Candles for Trend Indication
The indicator uses a color-coded system to denote different market conditions and potential trading opportunities:
- Green Candles: These candles indicate a potential long opportunity. The appearance of a green candle suggests that the market is showing bullish tendencies, prompting traders to consider entering a long position.
- Blue Candles: These candles signify an active pullback within a bullish trend. The blue candle warns traders of a possible temporary reversal within the overall bullish trend, suggesting caution and the need for confirmation before continuing with a long position or preparing for a potential reversal.
- Red Candles: These candles represent a potential short opportunity. A red candle indicates bearish market conditions, signaling traders to consider entering a short position.
- Yellow Candles: These candles denote an active pullback within a bearish trend. The presence of a yellow candle indicates a temporary reversal within the bearish trend, urging traders to be cautious with short positions and look for signs of continuation or reversal.
3. MAHA Bars for Distance and Area of Interest
In addition to the colored candles, the MAHA Luxmi AI Candles indicator also plots MAHA bars. These bars share the same color coding and usage as the candles, providing a consistent visual representation of market conditions:
- Green Bars: Indicate a potential long opportunity, aligning with green candles.
- Blue Bars: Show an active pullback in a bullish trend, aligning with blue candles.
- Red Bars: Represent a potential short opportunity, aligning with red candles.
- Yellow Bars: Indicate an active pullback in a bearish trend, aligning with yellow candles.
The MAHA bars help traders gauge the distance between the current price and the area of interest, enhancing their understanding of how close or far the price is from key levels identified by the MAHA formula. This aids in making better decisions regarding entry and exit points.
4. Trailing Stop Loss Feature
The base of the MAHA Bars can also be used as a trailing stop loss. This feature provides a dynamic stop loss level that adjusts with the market, helping traders lock in profits and limit losses by following the trend. When the price moves favorably, the trailing stop loss adjusts accordingly, ensuring that traders can capitalize on market movements while minimizing risk.
Usage and Benefits
- Trend Identification: The color-coded system simplifies the identification of market trends and potential reversals, making it easier for traders to understand market dynamics at a glance.
- Pullback and Reversal Alerts: The blue and yellow candles/bars alert traders to potential pullbacks and reversals, providing crucial information for managing trades and avoiding false signals.
- Distance Measurement: The MAHA bars help traders measure the distance between the current price and the areas of interest, enhancing their ability to assess the risk and potential reward of trades.
- Trailing Stop Loss: The base of the MAHA Bars can be used as a trailing stop loss, providing a dynamic risk management tool that adapts to market conditions.
Overall, the MAHA Luxmi AI Candles trading indicator is a powerful tool for traders looking to leverage the combined strengths of Moving Averages and Heikin-Ashi techniques. The intuitive color-coded system, additional MAHA bars, and the trailing stop loss feature make it an essential component of a trader’s toolkit for identifying trends, managing risk, and identifying trading opportunities.
Intelligent Exponential Moving Average (AI)Introduction
This indicator uses machine learning (Artificial Intelligence) to solve a real human problem.
The Exponential Moving Average (EMA) is one of the most used indicators on the planet, yet no one really knows what pair of exponential moving average lengths works best in combination with each other.
A reason for this is because no two EMA lengths are always going to be the best on every instrument, time-frame, and at any given point in time.
The "Intelligent Exponential Moving Average" solves the moving average problem by adapting the period length to match the most profitable combination of exponential moving averages in real time.
How does the Intelligent Exponential Moving Average work?
The artificial intelligence that operates these moving average lengths was created by an algorithm that tests every single combination across the entire chart history of an instrument for maximum profitability in real-time.
No matter what happens, the combination of these exponential moving averages will be the most profitable.
Can we learn from the Intelligent Moving Average?
There are many lessons to be learned from the Intelligent EMA. Most will come with time as it is still a new concept. Adopting the usefulness of this AI will change how we perceive moving averages to work.
Limitations
Ultimately, there are no limiting factors within the range of combinations that has been programmed. The exponential moving averages will operate normally, but may change lengths in unexpected ways - maybe it knows something we don't?
Thresholds
The range of exponential moving average lengths is between 5 to 40.
Additional coverage resulted in TradingView server errors.
Future Updates!
Soon, I will be publishing tools to test the AI and visualise what moving average combination the AI is currently using.
Intelligent Moving Average (AI)
Introduction
This indicator uses machine learning (Artificial Intelligence) to solve a real human problem.
The Moving Average is the most used indicator on the planet, yet no one really knows what pair of moving average lengths works best in combination with each other.
A reason for this is because no two moving averages are always going to be the best on every instrument, time-frame, and at any given point in time.
The " Intelligent Moving Average " solves the moving average problem by adapting the period length to match the most profitable combination of moving averages in real time.
How does the Intelligent Moving Average work?
The artificial intelligence that operates these moving average lengths was created by an algorithm that tests every single combination across the entire chart history of an instrument for maximum profitability in real-time.
No matter what happens, the combination of these moving averages will be the most profitable.
Can we learn from the Intelligent Moving Average?
There are many lessons to be learned from the Intelligent Moving Average. Most will come with time as it is still a new concept.
Adopting the usefulness of this AI will change how we perceive moving averages to work.
Limitations
Ultimately, there are no limiting factors within the range of combinations that has been programmed. The moving averages will operate normally, but may change lengths in unexpected ways - maybe it knows something we don't?
Thresholds
The range of moving average lengths is between 5 to 40.
Additional coverage resulted in TradingView server errors.
Future Updates!
Soon, I will be publishing tools to test the AI and visualise what moving average combination the AI is currently using.
XT AI Trading System for XBTUSD (BitMEX)- Features:
+ XT-AI-TRADE System with special built-in XT-AI Trend line, trend cloud indicator for XBTUSD (BitMEX) with the best performance.
+ Full backtesting from April 2018 with results as below:
Time frame / Net profit / Percent profitable / Profit factor
H1: 450% / 80% / 74.187
H2: 445% / 100% / Max
H3: 778% / 80% / 17.264
H4: 624% / 85.71% / 119.905
D1: 169% / 100% / Max
+ Separately optimized AI trading algorithm for different time frames: H1/H2/H3/H4/D1 (including Margin and Exchange Trading).
+ Trustworthy backtesting accuracy result with 100% non-repainting, no difference between backtesting and live trading.
+ Real-time push notification system: Email / Telegram... to your PC and Smartphone => Enjoy trading life.
+ 24/7 business operation.
*** Sign up for a trial here : goo.gl
Eagle V 2.0 - AIEagle V 2.0 – AI Edition is a next-generation signal engine designed for traders who want clean entries, consistent performance, and reduced stop-loss hits.
The indicator analyzes trend strength, liquidity behavior, volatility conditions, market structure, and price momentum to generate high-quality buy and sell signals only when the market is aligned.
Instead of flooding the chart with noise, Eagle V 2.0 focuses on precision.
Every signal comes with a calculated stop-loss, three Fibonacci-based take-profit levels, and a confidence score that helps you quickly judge the strength of the setup.
What the Indicator Delivers
Clear Long/Short signals filtered to avoid weak setups
Smart Stop-Loss placement to reduce fake-outs
TP1 / TP2 / TP3 levels automatically calculated based on market movement
AI Confidence Score (0–100) to measure the quality of each opportunity
Real-time Support & Resistance zones that update with market structure
Trend direction and momentum bias across multiple timeframes
Trade history panel showing win rate, total P&L, biggest wins/losses, and your last trades
Dashboard with market conditions, liquidity state, and timeframe bias
Who This Indicator Is For
Scalpers, day traders, and swing traders who want fewer but higher-quality signals, strong risk management, and a tool that adapts to any market—Forex, Crypto, Indices, or Stocks.
Summary
Eagle V 2.0 focuses on the only thing that matters:
Cleaner signals, controlled risk, and stronger results.
One Minute AI scalper keep extended trading hours on# One Minute AI Scalper - Trading Indicator
## Overview
The One Minute AI Scalper is a precision-engineered trading indicator designed specifically for short-term scalping strategies on 1-minute timeframes. This indicator combines multiple technical analysis methods to identify high-probability entry points for both long and short positions, making it ideal for active traders seeking quick, momentum-based opportunities.
## Key Features
### Visual Signals
- **Long Entry Arrows**: Clear green triangle markers appear below price bars when bullish conditions align
- **Short Entry Arrows**: Clear red triangle markers appear above price bars when bearish conditions align
- Clean, uncluttered chart interface focusing on actionable signals
### Advanced Signal Generation
The indicator utilizes a sophisticated multi-factor approach to generate trading signals:
1. **Trend Analysis**: Employs moving average crossover methodology to identify the prevailing market direction
2. **Momentum Confirmation**: Analyzes candlestick patterns and price behavior to confirm momentum strength
3. **Volume Validation**: Incorporates volume analysis to distinguish between high-conviction and standard signals
4. **Reversal Detection**: Identifies potential trend reversals by examining recent price action patterns
5. **Precision Entry Filtering**: Uses specific candlestick characteristics to minimize false signals
### Alert System
Comprehensive alert functionality for all signal types:
- Long Entry alerts
- Short Entry alerts
## How It Works
### Long Position Signals
The indicator generates long entry signals when multiple bullish conditions simultaneously align, including:
- Confirmation of upward momentum through price action
- Specific candlestick structure indicating strong buying pressure
- Price position relative to key moving averages
- Recent price behavior suggesting reversal potential
- Volume characteristics supporting the move
### Short Position Signals
Short entry signals are generated when multiple bearish conditions converge, including:
- Confirmation of downward momentum through price action
- Specific candlestick structure indicating strong selling pressure
- Price position relative to key moving averages
- Recent price behavior suggesting reversal potential
- Volume characteristics supporting the move
### Position Management
The indicator includes intelligent position state tracking to:
- Prevent duplicate signals while in an active position
- Generate exit signals based on opposing price action
- Maintain clear status of whether you're in a long or short position
## Best Practices
### Recommended Usage
- **Timeframe**: Optimized for 1-minute charts
- **Extended Hours**: Keep extended trading hours enabled for full market coverage
- **Markets**: Works on stocks, forex, crypto, and futures
- **Strategy**: Best suited for scalping and day trading strategies
### Risk Management
- Always use proper stop-loss orders
- Consider position sizing based on account risk tolerance
- Pay attention to volume-indicated signals for higher conviction trades
- Avoid trading during low-liquidity periods
- Combine with your own risk management rules
### Trading Tips
- Higher volume signals generally indicate stronger conviction
- Wait for clear arrow signals rather than trying to anticipate them
- Monitor overall market conditions and major support/resistance levels
- Be aware of news events that may cause unusual volatility
- Practice in a paper trading account before using real capital
## Important Notes
### What This Indicator Does
✅ Provides clear visual entry signals for long and short positions
✅ Incorporates multiple technical factors for signal generation
✅ Includes volume analysis for conviction assessment
✅ Offers comprehensive alert options for all signal types
✅ Maintains position state awareness
### What This Indicator Doesn't Do
❌ Does not guarantee profitable trades
❌ Does not provide specific price targets or stop-loss levels
❌ Does not replace the need for proper risk management
❌ Does not account for fundamental analysis or news events
❌ Does not adapt settings automatically to market conditions
## Disclaimer
This indicator is provided for educational and informational purposes only. It is not financial advice, and past performance does not guarantee future results. Trading involves substantial risk of loss, and you should only trade with capital you can afford to lose. Always conduct your own research and consider consulting with a qualified financial advisor before making trading decisions.
## Configuration
This indicator uses fixed, optimized parameters that have been carefully calibrated for 1-minute scalping. No user configuration is required - simply add it to your chart and monitor for signals.
## Support
For questions, suggestions, or feedback about this indicator, please use the comments section or contact the author directly through TradingView.
---
**Version**: 6.0
**Category**: Momentum/Scalping
**Overlay**: Yes
**Timeframe**: 1 minute (optimized)
🎓 Smart Beginner Pro - AI Trading Assistant🎓 Smart Beginner Pro - AI Trading Assistant
Short Description:
Your perfect FIRST trading indicator! Clear BUY/SELL signals with automatic risk management. Learn professional trading while getting 5-star rated entries. Built-in education + Stop Loss/Take Profit included. No experience needed!
🎯 FULL DESCRIPTION
Smart Beginner Pro is the ONLY indicator designed specifically to help complete beginners start trading professionally from day one!
Unlike complicated indicators that overwhelm you with information, Smart Beginner Pro makes trading simple while teaching you professional techniques.
🌟 What Makes This Special?
⭐ 5-Star Quality Rating System
Every signal is rated 1-5 stars based on:
✅ Trend alignment
✅ Major trend confirmation
✅ Volume analysis
✅ RSI health check
✅ Trend strength
You always know EXACTLY how good a setup is before entering!
Example:
⭐⭐⭐⭐⭐ = Perfect setup (all factors aligned)
⭐⭐⭐⭐ = Excellent setup (4/5 factors)
⭐⭐⭐ = Good setup (3/5 factors)
Choose your preferred quality level - Conservative traders only take 5-star signals!
🎓 Built-in Education
Learn WHILE You Trade!
This isn't just an indicator - it's your AI trading teacher!
Beginner Mode Features:
✅ Educational tooltips on every signal
✅ Explains WHY each signal appears
✅ Shows what each factor means
✅ Teaches you professional analysis
✅ Risk management guidance included
After a few weeks, you'll understand:
How trends work
Why volume matters
When to enter trades
How to manage risk
Professional trading concepts
Turn OFF Beginner Mode when ready for cleaner charts!
🛡️ Automatic Risk Management
Never Wonder Where to Place Stops Again!
Every signal comes with:
Entry Zone (Green box)
Exact entry price shown
Small buffer zone for entry
Stop Loss (Red box)
Calculated using ATR (volatility)
Placed at safe distance
Protects your capital
Take Profit 1 (Yellow box)
First profit target (50% of full target)
Partial profit recommended
Take Profit 2 (Green box)
Full profit target (1:3 risk/reward default)
Let winners run!
Risk/Reward Ratio: Always displayed!
Default: 1:3 (Risk $10 to make $30)
Customizable: 1.5 to 5.0
Professional money management built-in
🎯 Crystal Clear Signals
No Confusion. No Guessing.
BUY Signals:
🟢 HUGE green arrow below bar
Text says "BUY"
Star rating above
Can't miss it!
SELL Signals:
🔴 HUGE red arrow above bar
Text says "SELL"
Star rating below
Impossible to miss!
WAIT (No Signal):
⚪ Dashboard shows "WAIT"
Don't trade when no signal
Patience is key!
📊 Live Dashboard
All Information at a Glance:
Everything you need to make a decision - RIGHT THERE!
⚙️ Three Sensitivity Modes
Choose your trading style:
🎯 Conservative (Recommended for Beginners)
✅ Only 5-star signals
✅ 2-3 signals per day
✅ Highest win rate
✅ Best for learning
✅ Perfect for part-time traders
⚖️ Balanced (Default)
✅ 4-5 star signals
✅ 5-8 signals per day
✅ Good win rate
✅ More opportunities
✅ Best for most traders
⚡ Aggressive (For Active Traders)
✅ 3-5 star signals
✅ 10-15 signals per day
✅ More trades
✅ Requires experience
✅ For full-time traders
Start Conservative → Move to Balanced → Then Aggressive as you improve!
🌍 Works on EVERYTHING
✅ All Markets:
Forex (EUR/USD, GBP/USD, etc.)
Crypto (Bitcoin, Ethereum, etc.)
Stocks (Apple, Tesla, etc.)
Indices (S&P 500, NASDAQ, etc.)
Commodities (Gold, Silver, Oil, etc.)
✅ All Timeframes:
M5-M15: Scalping (quick trades)
M15-H1: Day trading (same day)
H4-D1: Swing trading (multi-day)
One indicator for your entire trading career!
🕐 Session Highlighting
Trade at the Right Time!
Background colors show best trading sessions:
🟢 Green = London Session (8 AM - 4 PM GMT)
High liquidity
Best for EUR/GBP pairs
🔵 Blue = New York Session (1 PM - 9 PM GMT)
Maximum liquidity
Best for all USD pairs
No color = Asian Session
Lower liquidity
Beginners: Avoid or trade carefully
Toggle ON/OFF in settings if you don't need it.
📚 How to Use (Step by Step)
For Complete Beginners:
Step 1: Add to Chart
1. Open your favorite pair (Start with EUR/USD)
2. Set timeframe to M15
3. Add "Smart Beginner Pro" indicator
4. Done! Default settings work great!
Step 2: Wait for Signal
1. Watch the dashboard
2. When it says "BUY" or "SELL" → A signal appeared!
3. Check the star rating (aim for 4-5 stars)
4. Look at "Safe to Trade" (should be ✅ YES)
Step 3: Enter Trade
1. Enter at current market price
2. Set Stop Loss at RED box level
3. Set Take Profit at GREEN box level (TP2)
4. Optional: Take partial profit at YELLOW box (TP1)
Step 4: Manage Trade
1. Let the trade run to TP or SL
2. Don't move stops (trust the system)
3. When TP1 hit: Close 50%, let rest run
4. When TP2 hit or SL hit: Close completely
Step 5: Learn & Improve
1. Review what happened
2. Was it a 5-star? How did it perform?
3. Read the tooltips (Beginner Mode)
4. Understand WHY signals work
5. Get better with each trade!
💡 Trading Rules for Success
🟢 DO:
✅ Only trade 4-5 star signals at first
✅ Use proper position sizing (1-2% risk)
✅ Always set Stop Loss (use indicator levels)
✅ Be patient (wait for quality setups)
✅ Trade during good sessions (London/NY)
✅ Learn from each trade
✅ Keep a trading journal
🔴 DON'T:
❌ Trade 1-2 star signals (not shown anyway)
❌ Risk more than 2% per trade
❌ Move stop losses (honor them!)
❌ Trade without a signal
❌ Overtrade (quality > quantity)
❌ Trade when "Safe to Trade" says NO
❌ Trade on emotion
⚙️ Settings Explained
📊 Mode Settings
Beginner Mode (Default: ON)
What it does:
- Shows educational tooltips
- Displays "Why?" explanations
- Extra help text
- Star ratings always visible
Turn OFF when:
- You understand the signals
- Want cleaner charts
- Prefer minimal interface
Signal Sensitivity
Conservative: Only perfect setups (5 stars)
Balanced: Good setups (4-5 stars)
Aggressive: Okay setups (3-5 stars)
Tip: Start Conservative, upgrade as you improve!
📈 Trend Settings
Fast EMA (Default: 9)
Shorter period = More responsive
Longer period = Smoother trend
Recommended: Keep at 9
Slow EMA (Default: 21)
Used with Fast EMA for crossovers
Recommended: Keep at 21
Standard setting works best
Major Trend EMA (Default: 200)
The "big picture" trend
Above = Uptrend | Below = Downtrend
Never trade against this!
Recommended: Keep at 200
Show EMAs (Default: ON)
Toggle if you want cleaner chart
EMAs still calculated even if hidden
Dashboard still shows trend direction
🛡️ Risk Management
Risk/Reward Ratio (Default: 3.0)
How much profit vs risk
3.0 = Risk $10 to make $30
Conservative: 2.0
Balanced: 3.0
Aggressive: 4.0-5.0
Higher = Bigger targets (but fewer hits)
Stop Loss ATR Multiplier (Default: 1.5)
How far stop loss is placed
Based on volatility (ATR)
Tight: 1.0 (more stops hit)
Balanced: 1.5
Loose: 2.0-3.0 (fewer stops, bigger risk)
Show Entry/SL/TP Boxes (Default: ON)
Toggle the colored risk boxes
Keep ON for visual guidance
Turn OFF for minimal charts
🎨 Visual Settings
Highlight Trading Sessions (Default: ON)
Shows London/NY sessions with color
Helps you trade at best times
Turn OFF if you trade 24/7
Show Trend Strength Bar (Default: ON)
Shows trend strength percentage
Useful for filtering weak trends
Turn OFF if not needed
🎓 Educational Value
What You'll Learn:
Week 1-2: Basics
✅ How to read trend direction
✅ When to enter trades
✅ Where to place stop losses
✅ What risk/reward means
✅ Why some signals are better than others
Week 3-4: Intermediate
✅ How EMA crossovers work
✅ Why volume matters
✅ What RSI tells you
✅ Session timing importance
✅ Risk management principles
Month 2-3: Advanced
✅ Market structure understanding
✅ Trend vs range recognition
✅ Quality signal identification
✅ Position sizing strategies
✅ Trading psychology basics
After 3 Months:
🎯 You're no longer a beginner!
🎯 You understand price action
🎯 You can analyze markets yourself
🎯 You make informed decisions
🎯 Ready for advanced indicators
💎 Why Choose Smart Beginner Pro?
vs. Other Beginner Indicators:
Most Beginner Indicators:
❌ Just show arrows (no explanation)
❌ No quality rating
❌ No stop loss help
❌ No education
❌ Too many bad signals
❌ Confusing settings
Smart Beginner Pro:
✅ Explains WHY each signal
✅ 5-star quality system
✅ Automatic SL/TP levels
✅ Built-in education
✅ Quality over quantity
✅ Simple, clear settings
✅ Professional results from day 1
vs. Advanced Indicators:
Advanced Indicators:
❌ Too complicated for beginners
❌ Require trading knowledge
❌ No educational features
❌ Overwhelming settings
❌ Steep learning curve
Smart Beginner Pro:
✅ Simple but powerful
✅ No prior knowledge needed
✅ Teaches while you trade
✅ Easy to understand
✅ Grows with you
🚀 Quick Start Guide
First 24 Hours:
Hour 1: Setup
1. Add indicator to EUR/USD M15
2. Enable all alerts (BUY + SELL)
3. Read dashboard labels
4. Wait for first signal
Hour 2-24: Learn
1. Watch how signals appear
2. Check star ratings
3. Observe trend direction
4. Notice session highlights
5. Don't trade yet - just observe!
Day 2-7: Demo Trading
1. Open demo account
2. Trade ONLY 5-star signals
3. Use exact SL/TP from indicator
4. Risk $100 per trade (demo)
5. Keep journal of results
6. Review each trade (win or loss)
Week 2+: Real Trading
1. Start with SMALL real account ($100-500)
2. Risk only 1% per trade ($1-5)
3. Trade Conservative mode only
4. Build confidence slowly
5. Increase size as you improve
🔔 Alert System
Available Alerts:
1. BUY Signal
Triggers: When 4-5 star BUY appears
Message: "SMART BEGINNER PRO - BUY SIGNAL!"
Action: Check chart, enter if conditions met
2. SELL Signal
Triggers: When 4-5 star SELL appears
Message: "SMART BEGINNER PRO - SELL SIGNAL!"
Action: Check chart, enter if conditions met
3. 5-STAR BUY (Premium Quality)
Triggers: Only perfect 5-star BUY setups
Message: "PERFECT 5-STAR BUY SIGNAL!"
Action: Highest probability - don't miss!
4. 5-STAR SELL (Premium Quality)
Triggers: Only perfect 5-star SELL setups
Message: "PERFECT 5-STAR SELL SIGNAL!"
Action: Highest probability - don't miss!
Alert Setup:
1. Click "Create Alert" on indicator
2. Choose "BUY Signal" and "SELL Signal"
3. Set "Once Per Bar Close"
4. Enable notifications to phone/email
5. Never miss a quality setup!
📊 Best Practices
Daily Routine:
Before Market Open:
1. Check economic calendar
2. Identify trending pairs
3. Set up charts with indicator
4. Enable alerts
During Trading:
1. Wait for signal
2. Check star rating (4-5 only)
3. Verify "Safe to Trade" = YES
4. Enter with proper position size
5. Set SL/TP from boxes
6. Walk away (don't watch tick-by-tick)
After Trading:
1. Review trades in journal
2. What worked? What didn't?
3. Were they 4-5 star signals?
4. Did you follow rules?
5. Plan improvements
Position Sizing:
The 1% Rule:
Account: $1000
Risk per trade: 1% = $10
If SL is 20 pips away:
Position size = $10 / 20 pips = $0.50/pip
Simple! Never risk more than you can afford to lose.
🎯 Success Tips
From Professional Traders:
Tip #1: Quality Over Quantity
"Better to take 3 excellent trades per week
than 20 mediocre trades per day."
→ Focus on 5-star signals at first
Tip #2: Respect the Stop Loss
"The indicator calculated it for a reason.
Moving stops = breaking risk management."
→ Set it and honor it, always
Tip #3: Take Partial Profits
"Bank some profit at TP1, let the rest run to TP2.
This keeps you profitable even if TP2 doesn't hit."
→ Close 50% at TP1 (yellow box)
Tip #4: Trade Best Sessions
"London and New York overlap (1-4 PM GMT)
is the most liquid time of day."
→ Watch for green+blue background
Tip #5: Keep Learning
"Every trade is a lesson.
Winners teach confidence, losers teach discipline."
→ Journal everything, review weekly
⚠️ Important Disclaimers
Realistic Expectations:
This is NOT:
❌ A get-rich-quick scheme
❌ A 100% win rate system
❌ A replacement for education
❌ A guarantee of profits
❌ Financial advice
This IS:
✅ A learning tool
✅ A signal system with good probability
✅ A risk management helper
✅ A starting point for beginners
✅ An educational indicator
Trading Risks:
⚠️ All trading involves risk
⚠️ You can lose money
⚠️ Never trade with money you can't afford to lose
⚠️ Start small, grow slowly
⚠️ Past performance ≠ future results
⚠️ Demo trade first!
🎁 Bonus: Beginner's Checklist
Before Every Trade:
□ Signal appeared (BUY or SELL arrow)
□ Star rating is 4 or 5 stars
□ Dashboard shows "Safe to Trade: ✅ YES"
□ Trend and signal agree (both bullish or bearish)
□ Trading during London/NY session
□ Stop Loss level identified (red box)
□ Take Profit level identified (green box)
□ Position size calculated (1% risk max)
□ Emotionally ready (not revenge trading)
□ Have clear mind (not tired/stressed)
If ALL checked → TRADE
If ANY missing → SKIP
🎯 Final Words
Trading doesn't have to be complicated.
Smart Beginner Pro proves that you can:
Get professional results as a beginner
Learn proper trading techniques
Manage risk automatically
Understand WHY trades work
Build confidence step by step
This is your starting point.
Add it to your chart. Watch it work. Learn from it. Grow with it.
Welcome to professional trading! 🚀
📈 Ready to Start?
1. Click "Add to favorites"
2. Apply to your chart
3. Enable alerts
4. Wait for your first 5-star signal
5. Start your trading journey TODAY!
Questions? Comments? Success stories?
Share below! 👇
Happy Trading! 🎓📊✨
Disclaimer: This indicator is for educational purposes. Trading involves risk. Always use proper risk management and never trade with money you cannot afford to lose. Past performance does not guarantee future results.
MMT AI IndicatorOverview
The MMT AI INDICATOR is an advanced technical indicator used to predict trends in price movements by utilizing a combination of traditional AI techniques, and the Momentum Model.
Dual RSI TL (AI Trend Mapper) - SigmorAlgoDual RSI TL (AI Trend Mapper) — an intelligent momentum and trendline mapping system built to give traders clarity, structure, and precision.
It merges a dual-layer RSI framework (fast & slow) with automatic RSI trendlines to identify strength, exhaustion, and reversals in real time.
⚙️ Main Features:
• Dual RSI system (fast & slow) with fully adjustable lengths
• Automatic RSI trendline mapping (AI-driven slope detection)
• Real-time crossover and confirmation alerts
• Clean visual markers for entry & exit points
• Compatible with EMA, SMA, and Pivot-based systems
💡 Recommended Settings:
• Default: Fast = 25, Slow = 75 (1:3 ratio) — ideal balance for 15m–1D traders
• Faster reaction: 12/36 or 14/42
• Slower/long-term: 28/84 or 30/90
Whether you trade scalps, intraday setups, or daily swings, Dual RSI TL adapts dynamically to price behavior — giving you a visual edge without noise.
Created by SigmorAlgo — for traders who value clarity over clutter.
Maple Liquidity Hunter📌 Description for Maple Liquidity Hunter
Maple Liquidity Hunter – AI-Enhanced Volume Liquidity Detector
Maple Liquidity Hunter is an advanced volume-based indicator designed to uncover hidden liquidity zones in the market.
By dynamically analyzing price–volume interactions, it automatically highlights momentum shifts with adaptive color coding.
✨ Key Features
AI-inspired volume/price analysis model
Detects liquidity surges and potential absorption points
Auto-coloring of volume bars for quick visual recognition
Optional volume moving average filter for trend context
⚠️ Disclaimer: This tool is for educational and research purposes only. It does not guarantee future results. Always test thoroughly before live trading.
TrendPilot AI v2 — Adaptive Trend Day Trading StrategyOverview
TrendPilot AI v2 is a structured, rules-based day trading strategy that identifies and follows market momentum using a sophisticated blend of technical indicators. Optimized for 15-minute and higher timeframes on high market cap cryptocurrencies (AAVE, SOL, ETH, BCH, BTC) to minimize manipulation risks, it adapts to changing market conditions with dynamic risk management and controlled re-entry logic to maximize trend participation while minimizing noise.
Core Logic
Multiple EMA Trend Confirmation — Uses three Exponential Moving Averages (fast, medium, slow) to detect robust bullish, bearish, or neutral trends, ensuring trades align with the prevailing market direction.
ADX Momentum Filter — Employs an ADX-based filter to confirm strong trends, avoiding entries in choppy or low-momentum markets.
Smart Entry Filter — Optional ATR-based buffer (period 14, multiplier 1.5) around the fast EMA prevents entries at overextended prices, enhancing trade precision.
Flexible Exit System — Offers multiple exit options: fixed take-profit (default 1.7 offset), trend-reversal exits, or ATR-based trailing stops (period 14, multiplier 2.0), with secure modes requiring candle closes for confirmation to gain Max Profit.
Controlled Re-Entry Logic — Allows re-entries after take-profit or price-based stop-loss with configurable wait periods (default 6 bars), max attempts (default 2), and EMA touch requirements (fast, medium, or slow).
State-Aware Risk Management — Tracks trend states and recent exits to adapt entries, with daily trade limits (default 5 long/short) and loss cooldowns (default 2 stop-losses) for disciplined trading.
How to Use & Configuration
Markets & Timeframes
Works with high market cap cryptocurrencies (AAVE, SOL, ETH, BCH, BTC).
Optimized for intraday charts (15m–4h) but adaptable to higher timeframes (e.g., 1h, 4h).
Trade Direction Settings
Dual Trades — Trades both long and short, quickly re-aligning after trend reversals.
Long Only — Ignores bearish signals, ideal for bullish markets or strong uptrends.
Short Only — Ignores bullish signals, suited for bearish markets or downtrends.
Risk Management Settings
Stop Loss Types
Trend Reversal — Closes positions when an opposite trend signal is confirmed (default).
Fixed Offset — Static stop at 3.5 offset from entry price (adjustable).
ATR Based — Dynamic trailing stop using ATR (period 14, multiplier 2.0), adjusting to market volatility.
Secure SL Mode — Optional setting to trigger price-based stops only on candle closes, reducing false exits.
Maximum recommended risk per trade is 5–10% of account equity.
Trade size is configurable (default 20 units) to match individual risk appetite.
Take Profit Options
Fixed Offset — Predefined target at 1.7 offset from entry (adjustable, e.g., 2.5 for SOL).
Secure TP Mode — Exits only when a candle closes beyond the target, ensuring reliable profit capture.
Trend Reversal — Exits on opposite trend signals when fixed TP is disabled, ideal for riding longer trends.
Trade Management Controls
Smart Entry Filter — Optional ATR-based buffer (period 14, multiplier 1.5) prevents chasing overextended prices.
Max Re-Entries — Limits continuation trades per trend cycle (default 2).
Daily Trade Limits — Caps long/short trades per day (default 5 each) for disciplined trading.
Daily Loss Cooldown — Pauses trading after a set number of stop-losses (default 2) per day.
Max Bars in Trade — Closes positions after a set duration (default 1440 bars) to prevent stale trades.
Configuration Steps
Apply the strategy to your chosen symbol (e.g., AAVE/USDT, SOL/USDT) and timeframe (15m or higher).
Select Trade Direction mode (Dual, Long Only, or Short Only).
Set Stop Loss (Trend Reversal, Fixed Offset, or ATR Based) and Take Profit (fixed or trend-reversal).
Adjust Smart Entry Filter, Max Re-Entries, Daily Limits, and Loss Cooldown as needed.
Test across multiple market conditions using the performance panel (top-right, showing Total Trades, Wins, Losses, Win Rate).
Enables automated trading via webhook integration with platforms like Binance Futures.
Set up alerts for long/short entries (🟢 Long, 🔴 Short) and exits (🎯 Max TP, 🛑 Max SL, 🚨 Force Exit).
Backtesting Guidance
Use realistic commission (default 0.01%) and slippage (default 2 ticks) matching your broker and instrument.
Validate performance over long historical periods (e.g., 3–6 months) to ensure >100 trades across different market regimes.
Avoid curve-fitting by testing on multiple high market cap coins (AAVE, SOL, ETH, BCH, BTC) and avoiding over-optimization.
EMA and ATR parameters are set to balanced, industry-standard values for realistic backtesting.
Best Practices, Defaults & Disclaimer
Best Practices
Use consistent and conservative position sizing (default 20 units).
Match commission and slippage to your broker’s actual rates.
Enable secure TP/SL modes for entries and exits to reduce false signals.
Test across different symbols, timeframes, and market phases before live trading.
Keep parameters simple to avoid overfitting.
Default Settings (Recommended Starting Point)
Initial Capital: $10,000
Order Size: Fixed, 20 units
Commission: 0.01%
Slippage: 2 ticks
Take Profit Offset: 1.7 (adjustable, e.g., 2.5 for SOL)
Stop Loss Type: Trend Reversal (default), Fixed Offset (3.5), or ATR Based (period 14, multiplier 2.0)
Smart Entry Filter: ATR period 14, multiplier 1.5 (optional)
Max Re-Entries: 2 per trend cycle
Daily Trade Limits: 5 long, 5 short
Daily Loss Cooldown: 2 stop-losses
Max Bars in Trade: 1440 bars
Subscription Information
TrendPilot AI v2 is an invite-only strategy, accessible only to approved subscribers.
Benefits include full access to all features, priority support, and regular updates.
Access is limited to ensure a high-quality user experience.
Compliance Status
No functional warnings in the script.
The script uses closed candle logic, ensuring no repainting or lookahead issues.
Designed for realistic backtesting with a $10,000 account and sustainable risk (≤5–10% per trade).
Disclaimer
This strategy is intended for educational and analytical purposes only. Trading involves substantial risk, and past performance does not guarantee future results. You are solely responsible for your own trading decisions and risk management.
Developed by: TrendPilotAI Team
For questions, setup guidance, or enhancement suggestions, contact TrendPilotAI Team via TradingView.
BBMA OA - AI GPT-5This indicator is an AI-assisted implementation of the BBMA OA (Bollinger Bands + Moving Average) trading strategy, originally introduced by Malaysian trader Oma Ally. The code was generated and optimized using the GPT-5 AI model to ensure clean Pine Script v6 structure and compatibility.
The system combines Bollinger Bands (20, 2) with EMA50, EMA200, and MA5/10 High-Low to identify the four main BBMA OA patterns:
Extreme
Market Hilang Volume (MHV)
Candle Arah Kukuh (CSAK)
Re-entry (RRE, REE, REM)
Features:
Multi Time Frame confirmation for higher accuracy
Automatic signal detection with visual markers
Trend ribbon and candle coloring
Optimized Pine Script v6, free from errors/warnings
⚠ This is an adaptation of Oma Ally’s concept for educational purposes, not an official version. Past performance does not guarantee future results.
ZoneShift+StochZ+LRO + AI Breakout Bands [Combined]This composite Pine Script brings together four powerful trend and momentum tools into a single, easy-to-read overlay:
ZoneShift
Computes a dynamic “zone” around price via an EMA/HMA midpoint ± average high-low range.
Flags flips when price closes convincingly above or below that zone, coloring candles and drawing the zone lines in bullish or bearish hues.
Stochastic Z-Score
Converts your chosen price series into a statistical Z-score, then runs a Stochastic oscillator on it and HMA-smooths the result.
Marks momentum flips in extreme over-sold (below –2) or over-bought (above +2) territory.
Linear Regression Oscillator (LRO)
Builds a bar-indexed linear regression, normalizes it to standard deviations, and shows area-style up/down coloring.
Highlights local reversals when the oscillator crosses its own look-back values, and optionally plots LRO-colored candles on price.
AI Breakout Bands (Kalman + KNN)
Applies a Kalman filter to price, smooths it further with a KNN-weighted average, then measures mean-absolute-error bands around that smoothed line.
Colors the Kalman trend line and bands for bullish/bearish breaks, giving you a data-driven channel to trade.
Composite Signals & Alerts
Whenever the ZoneShift flip, Stoch Z-Score flip, and LRO reversal all agree and price breaks the AI bands in the same direction, the script plots a clear ▲ (bull) or ▼ (bear) on the chart and fires an alert. This triple-confirmation approach helps you zero in on high-probability reversal points, filtering out noise and combining trend, momentum, and statistical breakout criteria into one unified signal.


