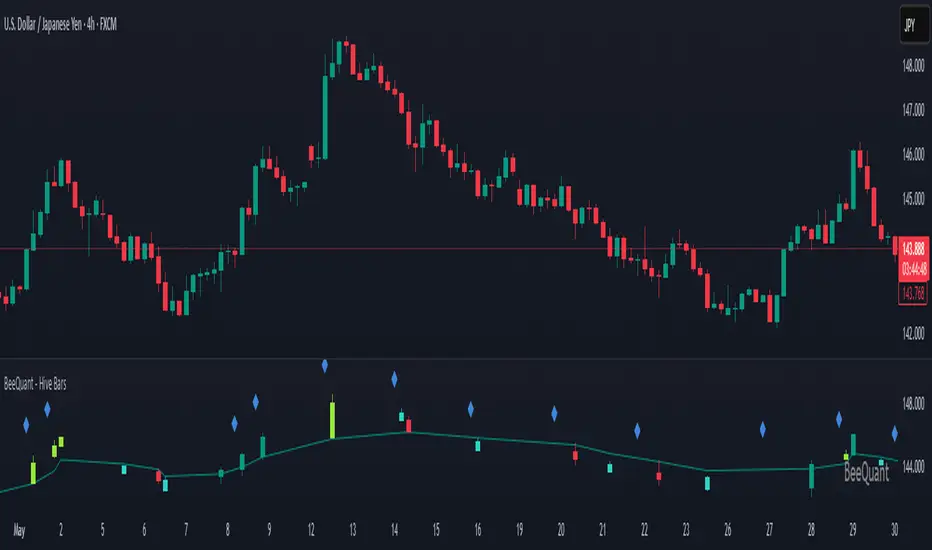
BeeQuant - Hive Bars🔶 OVERVIEW
The "Hive Bars" indicator is a truly revolutionary analytical instrument, meticulously engineered to transcend the limitations of conventional price charting and unveil the profound, underlying essence of market dynamics. Imagine possessing a sophisticated visual engine that intelligently reconstructs raw price data into unique, dynamically consolidated "Hive Bars." These specialized constructs intuitively reveal the dominant market momentum and highlight high-conviction signals often obscured by the ubiquitous noise of traditional candlesticks. This indicator acts as a precision filter, illuminating exactly when pivotal shifts are occurring by coloring these reconstructed units with an adaptive, unparalleled accuracy. It is expertly crafted for the discerning trader seeking an undeniable analytical advantage, offering a fresh, meticulously refined perspective that enables the discernment of concealed patterns, fostering more decisive and confident trading actions. Crucially, "Hive Bars" now feature proactive, real-time alert capabilities, ensuring no critical market inflection point ever goes unnoticed.
__________________________________________________________________________
🧠 CONCEPTS
At its intellectual core, the "Hive Bars" indicator operates upon an advanced, proprietary framework that fundamentally reinterprets market data. It presents this refined information through its unique "Hive Bars"—specialized visual constructs that dynamically encapsulate the consolidated spirit and true directional bias of price action, delivering unparalleled clarity.
⬜ Smart Bar Reconstruction: Hive Bars don’t follow time, they follow the market. They are derived through a sophisticated, multi-faceted internal process that precisely captures the dominant price influence and momentum over variable periods. This structure adapts dynamically to changing conditions, letting you see the real pressure behind price moves with consistency that time-based candles can’t match. This proprietary reconstruction creates a new, inherently consistent, and highly focused visual narrative of underlying market flow, effectively stripping away extraneous "noise" and revealing the market's authentic directional intent.
⬜ Multi-Layered Internal Analysis: A dynamic and live, adaptive line powers the core of Hive Bars. It recalibrates constantly, tracking market structure in real time. Every bar is formed in relation to this internal baseline, giving immediate context to price behavior. You choose the data that drives this line—open, close, high, low, or custom blends—to match your style.
⬜ Intelligent Bar Formation Sequences: Bars are created when the market speaks, not when the clock ticks. A built-in pattern engine reads the flow and waits for real structure to form. This allows the indicator to autonomously consolidate price action, presenting a cleaner, more coherent visualization of trend development as it truly unfolds, rather than fragmented snapshots based on time.
⬜ Visual Signal Precision: "Hive Bars" spring to life with an intuitively powerful coloring system. While primary colors (Green for upward bias, Red for downward bias) denote the prevailing market direction, the "Hive Bars" indicator introduces distinctively colored "Signal Hive Bars". These specialized bars emerge when the market price exhibits a particularly robust, high-conviction interaction with the adaptive internal baseline, standing out instantly and often mark key turning points or breakouts you want to act on.
⬜ Daily Reset Option: For intraday traders, there’s a reset feature that clears the internal build-up at the start of each new trading day. This ensures fresh, unbiased perspectives that are meticulously tailored to the distinct market dynamics and cyclic rhythms of the current trading day.
⬜ Adjustable Sensitivity: With Hive Smoothing, you’re in full control. This setting lets you fine-tune how sensitive the bars are to price movement. Want tighter, faster signals? Dial it down. Prefer broader, more filtered setups? Turn it up. You decide when a new Hive Bar forms—and when a Signal Bar confirms. It’s all based on how you trade and how your asset moves. No guesswork, no one-size-fits-all defaults. Hive Bars adapts to your strategy and trading style, not the other way around.
__________________________________________________________________________
✨ FEATURES
The "Hive Bars" indicator is equipped with a comprehensive suite of cutting-edge features, designed for unparalleled clarity, adaptive responsiveness, augmented analytical depth, seamless interoperability with your broader analytical toolkit, and proactive real-time notifications:
🔹Proprietary Hive Bar Reconstruction
Experience a uniquely advanced visual representation of price action that dynamically consolidates market data, leading to enhanced trend and momentum clarity that goes beyond standard charting and candlestick data.
🔹Customizable Internal Analysis Line
Gain precise control over the underlying adaptive baseline's calculation by selecting various internal price source options, ensuring its alignment with your specific analytical focus.
🔹 Smart Alerts for Key Events 🔔
Get notified in real time when:
◦ A new Hive Bar completes – signaling a fresh structural range reset
◦ A new Signal Hive Bar closes – identifying a potential overbought or oversold condition
Built-in alert conditions make it easy to stay ahead of shifts without watching every candle manually.
🔹Intelligent Bar Formation Sequencing
Diamond-shaped markers clearly indicate the start of the indicator's internal combination logic for enhanced visual understanding.
🔹High-Conviction "Signal Hive Bars" (Distinct Colors)
Receive specialized, uniquely colored visual alerts when Hive Bars exhibit strong, decisive movements relative to the adaptive baseline, indicating moments of heightened market conviction and potential opportunity.
🔹Session-Based Reconstruction
Opt for the "Daily New Start" to intelligently reset the indicator's perspective with each new trading day, providing fresh, session-aligned insights tailored for intraday precision.
🔹Unrivaled External Indicator Collaboration
A truly unique and powerful advantage of "Hive Bars" is its capability to seamlessly integrate and profoundly enhance the performance of other external indicators. By outputting clean, smoothed price data, it lets you feed a higher-quality source into tools like RSI, MACD, moving averages etc. Use close for indicators like RSI, and close for moving averages. The result is better clarity, fewer false signals, and a stronger edge across your setup. Hive Bars isn’t just an indicator, it’s an upgrade for everything you use.
🔹Non-Repainting Historical Integrity
Hive Bars never repaints. Each bar is locked in only after all internal conditions are fully met. This means you can trust every historical signal—it won’t shift or vanish after the fact. What you see in hindsight is exactly what was shown in real time.
🔹Universal Timeframe Compatibility
Whether you're scalping on the 1-minute chart or analyzing multi-month trends, Hive Bars delivers consistent, clean insights. Its architecture adapts to any timeframe without losing fidelity, making it a reliable tool for any strategy or style.
🔹Cross-Market Versatility
Hive Bars is engineered to perform with precision across all major markets—whether you're trading forex, commodities, stocks, or indices. Its adaptive logic automatically aligns with the unique volatility and structure of each asset class, delivering consistently reliable insights no matter where you trade.
__________________________________________________________________________
⚙️ USAGE
Integrating the "Hive Bars" indicator into your daily analytical regimen is an intuitive process that will profoundly enhance your ability to discern crucial market dynamics and spot high-conviction opportunities with unprecedented clarity:
💁 Effortless Application
Simply add the "Hive Bars" indicator to any chart within your TradingView platform. Note that it plots on a separate panel below your main price chart to provide its unique visual output without obscuring the primary price action.
📊 Strategic Calibration
Access the indicator's comprehensive settings panel to meticulously calibrate its powerful engines and unlock its full potential:
⚙ "Internal EMA Config"
Configure the internal adaptive baseline by choosing its source (e.g., CLOSE, HL/2) and its specific EMA length. This shapes the core reference point for the dynamic formation of the "Hive Bars."
🤖 "CONFIG Group"
Here, you decide if you want "Daily New Start" for session-based analytical resets (particularly beneficial for intraday strategies). The "Hive Smoothing" input allows you to control a further layer of consolidation for the "Hive Bars."
🟩🟥 "Color": Customize the appearance of both standard "Hive Bars" and "Signal Hive Bars" to suit your visual preferences, enhancing their immediate interpretability.
🧭 Empirical Exploration
Experimentation with these parameters is paramount. Dedicate time to exploring different combinations across various assets and timeframes to discover the optimal configuration that resonates with your unique trading methodology and the inherent volatility of the market being analyzed.
👀 Interpreting the Unveiled Market Reality: Once calibrated, the "Hive Bars" will present a strikingly clear and actionable picture of market dynamics:
+ Green/Red Hive Bars: These visually denote the consolidated directional bias of the market over the reconstructed period. A sustained sequence of Green "Hive Bars" suggests pervasive bullish pressure and an upward path of least resistance, while a series of Red "Hive Bars" indicates dominant bearish control and a clear downward momentum.
+ "Signal Hive Bars" (Distinct Colors): Pay close attention to these specially colored "Hive Bars." They signify critical moments where the reconstructed price action exhibits a particularly strong, high-conviction interaction with its adaptive internal baseline. These often precede or confirm significant market movements and serve as your clearest, most reliable visual triggers for potential shifts in market control.
⛓️ Intermittent Appearance: Observe that "Hive Bars" do not necessarily appear for every single native time unit of your chart. They are intelligently reconstructed and consolidated representations of price action, appearing only when specific internal conditions are met to present a coherent, high-impact view of distinct market phases.
🔗 Harnessing Advanced External Synergy: To unlock a new dimension of analytical power, profoundly enhance your existing indicator suite by integrating the output of "Hive Bars" as the data source for other external indicators. When adding or configuring indicators such as RSI, Stochastic Oscillators, various Moving Averages (EMA, SMA), or any other indicator that prompts for a 'source' input, you can now select the purified output of the "Hive Bars" as your desired data stream.
For oscillators (e.g., RSI, MACD), select the close or a similar relevant output from "Hive Bars" as your source. This allows the oscillator to react to the purified, consolidated momentum of the "Hive Bars" rather than the potentially noisy raw price data, leading to smoother and more meaningful oscillator signals.
For moving averages (e.g., EMA, SMA), utilize the close or other pertinent "Hive Bar" output as your source. This provides an exceptionally smooth, highly responsive, and less choppy average that precisely tracks the true underlying trend as identified by "Hive Bars." This unique capability allows for the construction of powerfully layered and synergistic trading strategies.
📢 Setting Up Proactive Alerts for Critical Events: Leverage the newly incorporated alert capabilities to maintain real-time awareness of pivotal market developments, even when not actively monitoring your charts.
You can now choose to be alerted specifically when a "New Hive Bar Closed" (signifying the definitive completion of a major market phase as identified by the indicator) or when a "New Signal Hive Bar Closed" (highlighting a high-conviction market event that warrants immediate attention due to its pronounced significance).
__________________________________________________________________________
⚠️ LIMITATIONS
While the "Hive Bars" indicator is an incredibly powerful and advanced tool for dissecting market dynamics, it is vital to understand its inherent design parameters and the prevailing platform-specific constraints for optimal and informed utilization:
👉 Visual Gaps in Plotting: Due to current platform limitations pertaining to custom candle plotting functionality, you may occasionally observe visual gaps or intermittent non-contiguous plotting between "Hive Bars" on the chart. They’re not missing data, but a result of strict plotting rules. A bar is only drawn when all internal conditions are met. This ensures accuracy, even if the chart shows some spacing.
👉 Complementary Tool: This indicator excels at providing high-conviction directional insights and identifying significant market phases. However, it is fundamentally designed as a sophisticated complementary tool to a broader trading strategy, not as a standalone, all-encompassing system. Its true power is unlocked when integrated with other analytical methods.
👉 Input Calibration Essential: The efficacy and depth of insights derived from the "Hive Bars" are highly dependent on the careful and thoughtful calibration of its input parameters, including the "Internal EMA Config," "Hive Smoothing" setting. Optimal results necessitate empirical user experimentation and fine-tuning to discover the configurations best suited for specific assets, analytical objectives, and market conditions.
👉 Exclusion of Auxiliary Data: The "Hive Bars" indicator's primary focus is exclusively on transforming and presenting price data. It does not natively incorporate other vital market information such as fundamental economic data, or news events. Integrating these additional analytical layers remains an essential aspect of constructing a truly comprehensive and robust trading strategy.
█ ▒▒▒▒▒▒▒▒▒▒▒▒▒▒▒▒▒▒▒▒▒▒▒ 『•••• ✎ ••••』 ▒▒▒▒▒▒▒▒▒▒▒▒▒▒▒▒▒▒▒▒▒▒▒▒ █
🎯 CONCLUSION
The "Hive Bars" indicator offers an unparalleled, intuitively accessible, and highly adaptable framework for instantly grasping true price momentum and direction through its intelligent, non-repainting reconstruction of market data. By transforming chaotic raw data into strikingly clear, high-conviction "Hive Bars" and dynamic signals, and now with proactive alerts to highlight critical moments, it empowers you to cut through distractions and identify market currents with unprecedented ease. Think of it as a custom lens for the market. It filters out the clutter and shows you the real structure—bars formed not by time, but by intent. It's about seeing the unseen, with enhanced clarity and a deeper understanding of market forces, now with the power to supercharge all your other tools and keep you informed. No fluff. No hype. Just an edge you can actually see—and use.
▣▣▣▣▣▣▣▣▣▣▣▣▣▣▣▣▣▣▣▣▣▣▣▣▣▣▣▣▣▣▣▣▣▣▣▣▣▣▣▣▣▣▣▣▣▣▣▣▣▣▣
🚨 RISK DISCLAIMER
Engagement in financial market speculation inherently carries a substantial degree of inherent risk, and the potential for capital diminution, potentially exceeding initial deposits, is a pervasive and non-trivial consideration. All content, algorithmic tools, scripts, articles, and educational materials disseminated by "Hive Bars" are exclusively purposed for informational and pedagogical objectives, strictly for reference. Historical performance data, whether explicitly demonstrated or implicitly suggested, offers no infallible assurance or guarantee of future outcomes. Users bear sole and ultimate accountability for their individual trading decisions and are emphatically urged to meticulously assess their financial disposition, risk tolerance parameters, and conduct independent due diligence prior to engaging in any speculative activity.
Cerca negli script per "algo"
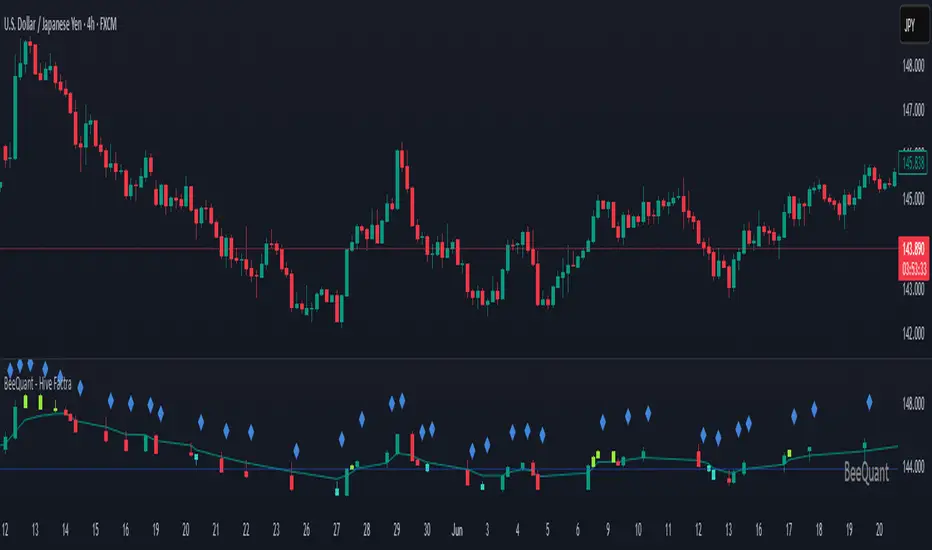
BeeQuant - Hive Factra🔶 OVERVIEW
The "Hive Factra" is a groundbreaking analytical instrument designed to unveil the true essence of market movement, transforming complex price action into powerfully consolidated insights. Imagine having a specialized lens that intelligently reconstructs market periods into unique "Hive Factra Bars," revealing underlying momentum and high-conviction signals often obscured in traditional charts. This indicator cuts through the noise, showing you precisely when significant shifts are occurring by coloring these reconstructed bars with an adaptive precision. It's built for traders who seek unfiltered perspective that helps see hidden patterns and make more decisive moves.
__________________________________________________________________________
🧠 CONCEPTS
Markets move in impulses and compressions. Most trend indicators rely on single-frame slope logic, which often flips during minor pullbacks. Hive Factra takes a different route. At its core, the "Hive Factra" operates on a sophisticated framework that reinterprets market data, presenting it through its proprietary "Hive Factra Bars", unique visualizations that capture the consolidated spirit of price action.
⬜ The "Hive Factra" Reconstruction: Unlike standard candles, "Hive Factra Bars" are intelligently re-engineered representations of market activity. They are derived through a proprietary process that captures the dominant price influence over specific periods, presenting a clearer, more focused view of underlying momentum. These unique bars visually consolidate information, making the core directional bias immediately apparent.
⬜ The Adaptive Baseline: An internal, dynamic analysis line constantly adjusts to market flow, serving as a crucial reference point for the "Hive Factra Bars." This adaptive baseline provides real-time context, helping the indicator precisely determine the significance of each reconstructed bar's movement.
⬜ High-Conviction Coloring & Signal Bars: The "Factra Bars" come to life with a discerning coloring system. While they reflect the primary market direction (Green for upward bias, Red for downward bias), the "Hive Factra" introduces specialized "Signal Hive Bars" with distinct colors. These unique bars appear when the consolidated price action exhibits a particularly strong, high-conviction interaction with the adaptive baseline, acting as powerful visual alerts for moments of heightened significance.
⬜ Session-Aligned Insights: For intraday traders, the "Daily New Start" option provides a unique advantage. When enabled, the indicator can reset its internal reconstruction process with each new trading session, offering fresh, unbiased perspectives tailored to the day's distinct market dynamics.
⬜ Dynamic Sensitivity: A configurable "Offset" allows you to fine-tune the indicator's responsiveness and the thresholds for initiating these "Hive Factra Bars" and "Signal Hive Bars." This ensures the indicator aligns perfectly with your individual trading style and the volatility of the asset you're analyzing.
__________________________________________________________________________
✨ FEATURES
The "Hive Factra" is equipped with a suite of cutting-edge features, all meticulously designed for unparalleled clarity, adaptive responsiveness, and augmented analytical depth:
🔹 Proprietary Hive Factra Bars
Experience a unique visual representation of price action that consolidates market data for enhanced trend and momentum clarity.
🔹 Customizable Internal Analysis Line
Control the underlying adaptive baseline's calculation for precise alignment with market flow, utilizing various price source options.
🔹 High-Conviction "Signal Hive Bars" (Distinct Colors)
Receive specialized visual alerts when Factra Bars exhibit strong, decisive movements relative to the adaptive baseline, indicating moments of heightened market conviction.
🔹 Overbought/Oversold Visuals
Signal Hive Bars highlight areas of potential exhaustion, providing intuitive insight into stretched conditions
🔹 Session-Based Reconstruction
Opt for the "Daily New Start" to reset the indicator's perspective with each new trading day, providing fresh, session-aligned insights.
🔹 Dynamic Offset Control
Adjust the "Offset" parameter to fine-tune the sensitivity of the Factra Bar reconstruction and signal generation thresholds, tailoring the indicator to specific market conditions.
🔹 Non-Repainting Logic for Historical Reliability
Each "Hive Factra Bar" is plotted only when its internal reconstruction conditions are fully met and confirmed. This ensures that the historical display of Factra Bars does not repaint, providing a high degree of reliability and trust in past signals and visualizations.
🔹 Cross-Market Versatility
This indicator is engineered to perform with precision across all major markets—whether you're trading forex, commodities, stocks, or indices. Its adaptive logic automatically aligns with the unique volatility and structure of each asset class, delivering consistently reliable insights no matter where you trade.
🔹 Custom Range Start Marker
A subtle diamond-shaped symbol is plotted to indicate the start of the Hive Factra logic cycle. This marks the bar from which the internal price range begins accumulating until a new Hive Factra Bar is confirmed and displayed. Helps visualize the dynamic evaluation period used in Factra’s structural detection.
🔹 Smart Alerts for Key Events
Get notified in real time when:
◦ A new Hive Factra Bar completes – signaling a fresh structural range reset
◦ A new Signal Hive Bar closes – identifying a potential overbought or oversold condition
Built-in alert conditions make it easy to stay ahead of shifts without watching every candle manually.
🔹 Universal Timeframe Compatibility: The "Hive Factra" is meticulously engineered to perform flawlessly across all timeframes, from rapid intraday charts to long-term weekly and monthly views. This universal compatibility ensures you receive consistent, high-quality insights regardless of your analytical horizon.
🔹 Unrivaled External Indicator Collaboration: A truly unique advantage of the "Hive Factra" is its capability to seamlessly integrate and enhance the performance of other external indicators. Its meticulously processed output, can serve as a highly purified and consolidated 'source' for indicators that accept such inputs (e.g., RSI, StochRSI, moving averages), which allows for more insightful data stream into your favorite indicators, potentially unlocking new levels of responsiveness and signal accuracy for your entire analytical setup.
__________________________________________________________________________
⚙️ USAGE
Integrating the "Hive Factra" into your daily analytical regimen is intuitive and will profoundly enhance your ability to discern crucial market dynamics and spot high-conviction opportunities:
💁 Effortless Application
Simply add the "Hive Factra" indicator to any chart within your TradingView platform. Note that it plots on a separate panel below your main price chart to provide its unique visual output without obscuring price.
📊 Tailored Calibration: Access the indicator's settings to unlock its full potential:
⚙ "Internal EMA Config"
Configure the internal adaptive baseline by choosing its source (e.g., Close, HL/2) and length. This shapes the core reference point for the Factra Bars.
⚙ "Hive Factra"
Decide if you want "Daily New Start" for session-based analysis and choose the "Source" type for how the Factra Bars are built.
🤖 "Offset"
Experiment with the "Offset" percentage to adjust the sensitivity of the Factra Bar's reconstruction. A smaller offset will make the Factra Bars appear more frequently, while a larger one will highlight only more significant movements.
🟩🟥 Green/Red Hive Factra Bars
These indicate the consolidated directional bias of the market over the reconstructed period. A sequence of Green bars suggests sustained bullish pressure, while Red bars point to dominant bearish control.
🚀 "Signal Hive Bars" (Unique Colors)
Pay close attention to these specially colored Hive Factra Bars. They signify moments where the reconstructed price action exhibits a high-conviction interaction with its adaptive baseline, often preceding or confirming significant market moves. These are your clearest signals for potential shifts.
✨ Appearance of Hive Factra Bars
Notice that these Bars do not necessarily appear for every single time unit. They intelligently reconstruct and consolidate price action, appearing only when conditions align to present a coherent, high-impact view of market phases.
🪢 Harnessing External Synergy
To unlock a new dimension of analysis, consider integrating "Hive Factra" as the data source for other indicators:
1. When adding indicators like RSI, StochRSI, or others that prompt for a 'source' input, you can select the "Hive Factra" as the input.
2. For oscillators (e.g., RSI, Stochastic), choose the close or similar output from "Hive Factra" as your source. This allows the oscillator to react to the purified, consolidated momentum of the Factra Bars rather than raw price.
For moving averages (e.g., EMA, SMA), use the close or other relevant Factra Bar output as your source. This provides an exceptionally smooth and responsive average that tracks the true underlying trend.
__________________________________________________________________________
⚠️ LIMITATIONS
While the "Hive Factra" is an incredibly powerful tool for dissecting market dynamics, it's vital to understand its design parameters for optimal use. It does not attempt to front-run reversals or predict market turns. Instead, it focuses on framing price behavior so traders can react with context.
👉 Visual Gaps in Plotting: Due to Tradingview platform limitations with custom candle plotting functionality, you may observe visual gaps between "Hive Factra Bars" on the chart. This occurs because the indicator only plots a Hive Factra Bar when its internal conditions for reconstruction are fully met, and there isn't an 'offset' parameter for custom candles to bridge these visual discontinuities. Importantly, this behavior ensures that each plotted Factra Bar is confirmed and does not repaint, providing reliable historical analysis.
👉 Reconstructed Data, Not Raw Price: It's crucial to remember that "Hive Factra Bars" are not traditional candles. They are a derived visualization that intelligently consolidates price data.
👉 Complementary Tool: This indicator excels at providing high-conviction directional insights and identifying significant market phases. However, it is designed as a sophisticated complement to a broader trading strategy, not a standalone system.
👉 Input Calibration Essential: The effectiveness of the "Hive Factra" is highly dependent on careful calibration of its input parameters, especially the "Offset" and internal EMA settings. Optimal results require user experimentation to find settings best suited for specific assets and timeframes.
👉 Exclusion of Auxiliary Data: The "Hive Factra" focuses solely on transforming price data. It does not incorporate other vital market information such as trading volume, market breadth, or fundamental news. Integrating these additional analytical layers remains essential for a comprehensive trading strategy.
█ ▒▒▒▒▒▒▒▒▒▒▒▒▒▒▒▒▒▒▒▒▒▒▒ 『•••• ✎ ••••』 ▒▒▒▒▒▒▒▒▒▒▒▒▒▒▒▒▒▒▒▒▒▒▒▒ █
🎯 CONCLUSION
The "Hive Factra" offers an unparalleled, intuitive, and highly adaptable framework for instantly grasping true price momentum and direction through its intelligent reconstruction of market data. By transforming chaotic raw data into strikingly clear, high-conviction "Factra Bars" and dynamic signals, it empowers you to cut through distractions and identify critical market currents with ease. Its revolutionary capability for seamless collaboration with external indicators (like RSI, EMA, etc., by using its purified output as their source) means you can elevate the performance of your entire analytical suite to new levels of precision and clarity. Seamlessly integrate this advanced visual tool within your analytical framework to gain a sharper, more confident perspective, and elevate your strategic decision-making in the markets. It's about seeing the unseen, with enhanced clarity and a deeper understanding of market forces, now with the power to supercharge all your other tools.
▣▣▣▣▣▣▣▣▣▣▣▣▣▣▣▣▣▣▣▣▣▣▣▣▣▣▣▣▣▣▣▣▣▣▣▣▣▣▣▣▣▣▣▣▣▣▣▣▣▣▣
🚨 RISK DISCLAIMER
Engagement in financial market speculation inherently carries a substantial degree of inherent risk, and the potential for capital diminution, potentially exceeding initial deposits, is a pervasive and non-trivial consideration. All content, algorithmic tools, scripts, articles, and educational materials disseminated by "Hive Factra" are exclusively purposed for informational and pedagogical objectives, strictly for reference. Historical performance data, whether explicitly demonstrated or implicitly suggested, offers no infallible assurance or guarantee of future outcomes. Users bear sole and ultimate accountability for their individual trading decisions and are emphatically urged to meticulously assess their financial disposition, risk tolerance parameters, and conduct independent due diligence prior to engaging in any speculative market activity.
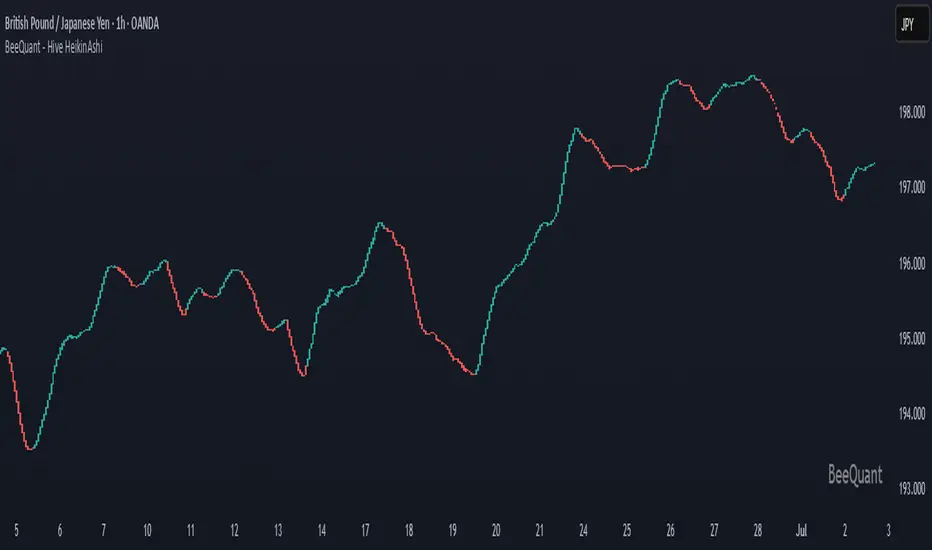
BeeQuant - Hive HeikinAshi💠 OVERVIEW
The "Hive HeikinAshi" is your ultimate tool for simplifying the chaotic world of price charts. Imagine a specialized lens that cuts through all the market "noise" – those tiny, confusing movements – and reveals the clear, underlying current of price action. This indicator transforms standard, sometimes choppy, candlestick charts into a powerful, trend-focused visualization. It’s designed to help every trader, whether you're a discretionary trader seeking cleaner structures or a quant enthusiast looking for visual cues to complement models, Hive HeikinAshi provides a simplified yet highly informative lens through which to read price action.
Its main advantage lies in its seamless compatibility with external indicators — offering a next-level smoothing foundation that enhances the clarity and reliability of any existing trend, momentum, or signal-based system layered on top of it.
__________________________________________________________________________
🧠 CONCEPTS
At its core, the "Hive HeikinAshi" isn't just another way to look at candles; it's a profound re-interpretation of price dynamics. It employs a sophisticated internal process to distill raw market movements into a more coherent, trend-identifying display, making the market's story incredibly easy to read.
The "Hive" Transformation: Unlike traditional candlesticks that show every small price fluctuation, the "Hive HeikinAshi" candles are intelligently constructed to smooth out the data. They are derived from a multi-point calculation process, creating a new, more consistent visual representation of price. This transformation helps to reduce the "visual clutter" and make trend following a much more intuitive experience. You'll see the forest, not just the trees.
⬜ Highlights dominant price direction by filtering reactive fluctuations
⬜ Visually separates impulsive vs corrective behavior with clear color transitions
⬜ Enables quicker discretionary recognition of trend shifts without complex overlays
⬜ Ideal for confirming momentum zones and stable trending phases
⬜ The Intelligent Filter. An optional yet powerful "Filter" mechanism has been integrated, providing an additional layer of analytical discernment.
⬜ Designed to integrate natively with trend-following, oscillator, or signal indicators — enabling amplified precision across diverse trading systems
A significant advantage of the "Hive HeikinAshi" is its inherent ability to minimize distracting "noise" from typical candle wicks. While standard candles can often show long, confusing wicks that obscure the true body direction, our specialized candles are engineered to emphasize the core directional move. This intelligent design allows you to focus on the momentum generated by the candle's body, rather than getting sidetracked by fleeting price extremes, thereby providing a cleaner, more reliable visual of trend strength.
__________________________________________________________________________
✨ FEATURES
Hive HeikinAshi includes several key features designed for both clarity and functionality:
🔹Multi-Bar Averaging
Generates a visually balanced candle structure using averaged pricing across configurable recent bars.
🔹 Wickless Visualization
Candles are rendered without upper/lower shadows, enhancing trend detection and reducing signal confusion.
🔹 Signal Filter
Adaptive color filter using a dynamic high/low lookback logic
🔹 Directional Color Coding
Clean green/red coloring helps instantly interpret bullish or bearish pressure.
🔹 Adjustable History Depth
Customize how many bars are considered in the smoothing process to match your style and timeframe.
🔹 Invisible Price Feed Outputs
Underlying smoothed OHLC values are available for custom strategies or overlays.
🔹Non-Repainting Logic for Historical Reliability
Each "Hive HeikinAshi" is plotted only when its internal reconstruction conditions are fully met and confirmed. This ensures that the historical display of HeikinAshi does not repaint, providing a high degree of reliability and trust in past signals and visualizations.
🔹Cross-Market Versatility
This indicator is engineered to perform with precision across all major markets—whether you're trading forex, commodities, stocks, or indices. Its adaptive logic automatically aligns with the unique volatility and structure of each asset class, delivering consistently reliable insights no matter where you trade.
__________________________________________________________________________
⚙️ USAGE
Using Hive HeikinAshi is simple and effective:
📥 Add to Chart
Once access is granted, apply the indicator to any timeframe or asset directly from your TradingView invite-only indicators list.
⚙️ Tweak “No. of Bars”
This setting controls how far back the smoothing engine looks.
• Lower values = more responsive, shorter-term smoothing
• Higher values = steadier candles, better for macro trends
🎚️ Next, consider the "Filter" option:
Turn this on to activate the advanced filtering mechanism. Then, adjust the "lookback bars" (from 1 to 10). A smaller number here will make the filter more responsive to immediate "Hive HeikinAshi" candle extremes, while a larger number will require a more sustained breakout from the recent filtered range. Experiment to discover the optimal "sweet spot" that best reveals the underlying market flow for your specific strategy. The tooltip guides you to this optimal setting.
Disable "Filter": If turned off, the candles will revert to a more direct HeikinAshi coloration based purely on their calculated open and close, without the additional layer of range filtering.
🔍 Interpreting Candles
• 🟢 Green Candle: Bullish continuation zone
• 🔴 Red Candle: Bearish pressure dominates
• Lack of wick = strong directional conviction
Combine with your favorite indicators — Hive HeikinAshi acts as a foundation to reduce noise and enhance clarity across tools like EMAs, MACD, VWAP, and more.
__________________________________________________________________________
⚠️ LIMITATIONS
While Hive HeikinAshi provides clear visual advantages, it is important to understand its scope:
👉 Not a Signal Generator: This indicator excels at identifying and confirming trends, making it less suitable for pinpointing exact, high-frequency entry and exit points that require unadulterated real-time price. It prioritizes overall directional clarity.
👉 Lag by Design: Due to multi-bar data smoothing, candles reflect stable price behavior but not ultra-short-term fluctuations.
👉 No Volume or Macro Inputs: Hive HeikinAshi focuses purely on price structure — it does not include volume, news, or external conditions.
👉 Filter Calibration: While the "Filter" enhances clarity, its effectiveness is dependent on appropriate "lookback bars" calibration. Users should understand that adding filtering inherently balances responsiveness with a more refined signal, and finding the optimal setting is part of the analytical process.
█ ▒▒▒▒▒▒▒▒▒▒▒▒▒▒▒▒▒▒▒▒▒▒▒ 『•••• ✎ ••••』 ▒▒▒▒▒▒▒▒▒▒▒▒▒▒▒▒▒▒▒▒▒▒▒▒ █
🎯 CONCLUSION
Hive HeikinAshi is a powerful visual companion for modern traders seeking smoother, clearer price trends. By combining directional clarity with reduced chart clutter, it allows you to interpret the market with less noise and more confidence. Seamlessly integrate this advanced visual tool within your analytical framework to gain a sharper, more confident perspective, and elevate your strategic decision-making in the markets. It's about seeing the unseen, with clarity.
▣▣▣▣▣▣▣▣▣▣▣▣▣▣▣▣▣▣▣▣▣▣▣▣▣▣▣▣▣▣▣▣▣▣▣▣▣▣▣▣▣▣▣▣▣▣▣▣▣▣▣
🚨 RISK DISCLAIMER
Engagement in financial market speculation inherently carries a substantial degree of inherent risk, and the potential for capital diminution, potentially exceeding initial deposits, is a pervasive and non-trivial consideration. All content, algorithmic tools, scripts, articles, and educational materials disseminated by "Hive HeikinAshi" are exclusively purposed for informational and pedagogical objectives, strictly for reference. Historical performance data, whether explicitly demonstrated or implicitly suggested, offers no infallible assurance or guarantee of future outcomes. Users bear sole and ultimate accountability for their individual trading decisions and are emphatically urged to meticulously assess their financial disposition, risk tolerance parameters, and conduct independent due diligence prior to engaging in any speculative market activity.
BeeQuant - Hive Visualizer💠 OVERVIEW
The " Hive Visualizer " is a game-changing, invite-only tool, expertly designed to give every trader, from beginner to experienced, instant and clear visual clues about what price is doing. Its main job is to easily show you the highest and lowest points price has reached recently. Think of it as a smart, automated helper that colors your candles to reveal powerful market moves. This helps you quickly see if prices are getting stronger or weaker right on your chart. It's a groundbreaking, high-quality tool that cuts through the noise, making it simple to spot key moments when the market is about to make a big move up or down, giving you an edge.
__________________________________________________________________________
🧠 CONCEPTS
The core philosophy behind Hive Visualizer is rooted in contextual volatility exposure and directional bias reinforcement. Through a sophisticated internal mechanism that evaluates local maxima/minima behavior within a compact temporal field, the indicator provides adaptive color‑based candle transitions that align with latent directional pressure.
1. Uses localized equilibrium breach detection to monitor directional intent and exhaustion points.
2. Embeds a dynamically updating framework that reacts to both trend continuation and structural reversals.
3. Avoids false positives by disregarding noisy fluctuations below system‑defined relevance thresholds.
4. Provides non‑repainting, fully forward‑confirmed visual outputs for reliable retrospective analysis.
Hive Visualizer is not designed to be predictive. Instead, it allows traders to observe the evolution of price structure in a cleaner and more digestible format, supporting high-confidence discretionary execution or automated model overlays.
__________________________________________________________________________
✨ FEATURES
The "Hive Visualizer" comes with a suite of smart features, all designed for amazing clarity, quick reactions, and deeper understanding, making your charting experience truly effortless:
🔹 Easy Range Customization
A super easy "Smoother" setting lets you perfectly adjust how the indicator reacts to recent price changes. This means you can fine-tune it to match exactly how you like to trade
🔹 Instant, Clear Signals
The simple Green and Red candles give you immediate, unmistakable visual cues about strong upward or downward moves, providing insights you can grasp in a heartbeat.
🔹 Smart Continuity in Quiet Times
The clever way it keeps the same color for candles that aren't breaking out offers valuable, subtle insights into those periods when the market is just moving sideways or finding its balance, helping you see the hidden dynamics.
🔹 Seamless Chart Integration
This indicator works like a transparent overlay, appearing directly on your price chart without getting in the way or changing your original candles. It fits perfectly, making your analysis smooth and uninterrupted.
🔹 Clean and Focused Visuals
The indicator’s simple design focuses only on coloring the main candle body and border to clearly highlight important breakouts. This keeps your chart clean and effective, showing you only what truly matters.
🔹 Cross-Market Versatility
This indicator is engineered to perform with precision across all major markets—whether you're trading forex, commodities, stocks, or indices. Its adaptive logic automatically aligns with the unique volatility and structure of each asset class, delivering consistently reliable insights no matter where you trade.
__________________________________________________________________________
⚙️ USAGE
Using and making the "Hive Visualizer" a part of your trading routine is incredibly simple and designed to significantly boost how you understand the market:
Getting Started: Once you have access, just add the "Hive Visualizer" indicator to any chart and timeframe you want on TradingView. It's that easy.
Tuning the "Smoother" Setting: Go into the indicator's settings and play with the "Smoother" number. This is a crucial step to make it react just right for you.
Smaller numbers (like 1-3 bars) will make the indicator very quick to react to the most recent, short-term ups and downs, perfect for fast trading.
Larger numbers (like 5-10+ bars) will give you a wider view, smoothing out small changes and highlighting bigger, more important breakouts, ideal for longer-term analysis. Spend a little time trying different settings to find what works best for your chosen asset and your trading style – it's like finding the perfect lens for your market view.
Understanding the Colors: Once you've set it up, here's how to quickly understand what the "Hive Visualizer" is telling you: New Green Candle: This means a strong sign that buyers are in control and prices are likely to keep moving up, giving you confidence in bullish moves.
New Red Candle: This indicates as a strong signal that sellers are dominating and prices are likely to keep moving down, preparing you for bearish shifts.
__________________________________________________________________________
⚠️ LIMITATIONS
👉 Visual Guide, Not a Bot: Use as part of a broader strategy—it won’t auto‑trade for you
👉 Retroactive Insight: It reflects past price action; it doesn’t predict the future.
👉 Setting‑Dependent: Effectiveness relies on your “Smoother” choice—too low = noise; too high = lag.
👉 Price‑Range Focused: Highlights trends and range only — doesn’t analyze volume, news, or other complex factors.
👉 This tool enhances trend validation but isn’t a standalone signal generator.
█ ▒▒▒▒▒▒▒▒▒▒▒▒▒▒▒▒▒▒▒▒▒▒▒ 『•••• ✎ ••••』 ▒▒▒▒▒▒▒▒▒▒▒▒▒▒▒▒▒▒▒▒▒▒▒▒ █
🎯 CONCLUSION
The "Hive Visualizer" offers an incredibly easy-to-use and adaptable way to see price strength and weakness with crystal clarity on your charts. By giving you instant, clear feedback on whether prices are powerfully breaking out or falling below a recent historical range, it truly empowers you to quickly understand market momentum and spot key turning points. Seamlessly add this smart visual tool into your current trading methods to gain a sharper, more insightful view, and elevate your trading decisions. It's about seeing the market with new eyes.
▣▣▣▣▣▣▣▣▣▣▣▣▣▣▣▣▣▣▣▣▣▣▣▣▣▣▣▣▣▣▣▣▣▣▣▣▣▣▣▣▣▣▣▣▣▣▣▣▣▣▣
🚨 RISK DISCLAIMER
Engagement in financial market speculation inherently carries a substantial degree of inherent risk, and the potential for capital diminution, potentially exceeding initial deposits, is a pervasive and non-trivial consideration. All content, algorithmic tools, scripts, articles, and educational materials disseminated by "Hive Visualizer" are exclusively purposed for informational and pedagogical objectives, strictly for reference. Historical performance data, whether explicitly demonstrated or implicitly suggested, offers no infallible assurance or guarantee of future outcomes. Users bear sole and ultimate accountability for their individual trading decisions and are emphatically urged to meticulously assess their financial disposition, risk tolerance parameters, and conduct independent due diligence prior to engaging in any speculative market activity.

Liquidity Sweep Filter Strategy [AlgoAlpha X PineIndicators]This strategy is based on the Liquidity Sweep Filter developed by AlgoAlpha. Full credit for the concept and original indicator goes to AlgoAlpha.
The Liquidity Sweep Filter Strategy is a non-repainting trading system designed to identify liquidity sweeps, trend shifts, and high-impact price levels. It incorporates volume-based liquidation analysis, trend confirmation, and dynamic support/resistance detection to optimize trade entries and exits.
This strategy helps traders:
Detect liquidity sweeps where major market participants trigger stop losses and liquidations.
Identify trend shifts using a volatility-based moving average system.
Analyze volume distribution with a built-in volume profile visualization.
Filter noise by differentiating between major and minor liquidity sweeps.
How the Liquidity Sweep Filter Strategy Works
1. Trend Detection Using Volatility-Based Filtering
The strategy applies a volatility-adjusted moving average system to determine trend direction:
A central trend line is calculated using an EMA smoothed over a user-defined length.
Upper and lower deviation bands are created based on the average price deviation over multiple periods.
If price closes above the upper band, the strategy signals an uptrend.
If price closes below the lower band, the strategy signals a downtrend.
This approach ensures that trend shifts are confirmed only when price significantly moves beyond normal market fluctuations.
2. Liquidity Sweep Detection
Liquidity sweeps occur when price temporarily breaks key levels, triggering stop-loss liquidations or margin call events. The strategy tracks swing highs and lows, marking potential liquidity grabs:
Bearish Liquidity Sweeps – Price breaks a recent high, then reverses downward.
Bullish Liquidity Sweeps – Price breaks a recent low, then reverses upward.
Volume Integration – The strategy analyzes trading volume at each sweep to differentiate between major and minor sweeps.
Key levels where liquidity sweeps occur are plotted as color-coded horizontal lines:
Red lines indicate bearish liquidity sweeps.
Green lines indicate bullish liquidity sweeps.
Labels are displayed at each sweep, showing the volume of liquidated positions at that level.
3. Volume Profile Analysis
The strategy includes an optional volume profile visualization, displaying how trading volume is distributed across different price levels.
Features of the volume profile:
Point of Control (POC) – The price level with the highest traded volume is marked as a key area of interest.
Bounding Box – The profile is enclosed within a transparent box, helping traders visualize the price range of high trading activity.
Customizable Resolution & Scale – Traders can adjust the granularity of the profile to match their preferred time frame.
The volume profile helps identify zones of strong support and resistance, making it easier to anticipate price reactions at key levels.
Trade Entry & Exit Conditions
The strategy allows traders to configure trade direction:
Long Only – Only takes long trades.
Short Only – Only takes short trades.
Long & Short – Trades in both directions.
Entry Conditions
Long Entry:
A bullish trend shift is confirmed.
A bullish liquidity sweep occurs (price sweeps below a key level and reverses).
The trade direction setting allows long trades.
Short Entry:
A bearish trend shift is confirmed.
A bearish liquidity sweep occurs (price sweeps above a key level and reverses).
The trade direction setting allows short trades.
Exit Conditions
Closing a Long Position:
A bearish trend shift occurs.
The position is liquidated at a predefined liquidity sweep level.
Closing a Short Position:
A bullish trend shift occurs.
The position is liquidated at a predefined liquidity sweep level.
Customization Options
The strategy offers multiple adjustable settings:
Trade Mode: Choose between Long Only, Short Only, or Long & Short.
Trend Calculation Length & Multiplier: Adjust how trend signals are calculated.
Liquidity Sweep Sensitivity: Customize how aggressively the strategy identifies sweeps.
Volume Profile Display: Enable or disable the volume profile visualization.
Bounding Box & Scaling: Control the size and position of the volume profile.
Color Customization: Adjust colors for bullish and bearish signals.
Considerations & Limitations
Liquidity sweeps do not always result in reversals. Some price sweeps may continue in the same direction.
Works best in volatile markets. In low-volatility environments, liquidity sweeps may be less reliable.
Trend confirmation adds a slight delay. The strategy ensures valid signals, but this may result in slightly later entries.
Large volume imbalances may distort the volume profile. Adjusting the scale settings can help improve visualization.
Conclusion
The Liquidity Sweep Filter Strategy is a volume-integrated trading system that combines liquidity sweeps, trend analysis, and volume profile data to optimize trade execution.
By identifying key price levels where liquidations occur, this strategy provides valuable insight into market behavior, helping traders make better-informed trading decisions.
Key use cases for this strategy:
Liquidity-Based Trading – Capturing moves triggered by stop hunts and liquidations.
Volume Analysis – Using volume profile data to confirm high-activity price zones.
Trend Following – Entering trades based on confirmed trend shifts.
Support & Resistance Trading – Using liquidity sweep levels as dynamic price zones.
This strategy is fully customizable, allowing traders to adapt it to different market conditions, timeframes, and risk preferences.
Full credit for the original concept and indicator goes to AlgoAlpha.

3Commas Multicoin Scalper LITE [SwissAlgo]
Introduction
Are you tired of tracking cryptocurrency charts and placing orders manually on your Exchange?
The 3Commas Multicoin Scalper LITE is an automated trading system designed to identify and execute potential trading setups on multiple cryptocurrencies ( simultaneously ) on your preferred Exchange (Binance, Bybit, OKX, Gate.io, Bitget) via 3Commas integration.
It analyzes price action, volume, momentum, volatility, and trend patterns across two categories of USDT Perpetual coins: the 'Top Major Coins' category (11 established cryptocurrencies) and your Custom Category (up to 10 coins of your choice).
The indicator sends real-time trading signals directly to your 3Commas bots for automated execution, identifying both trend-following and contrarian trading opportunities in all market conditions.
Trade automatically all coins of one or more selected categories:
----------------------------------------------
What it Does
The 3Commas Multicoin Scalper LITE is a technical analysis tool that monitors multiple cryptocurrency pairs simultaneously and connects with 3Commas for signal delivery and execution.
Here's how the strategy works:
🔶 Technical Analysis : Analyzes price action, volume, momentum, volatility, and trend patterns across USDT Perpetual Futures contracts simultaneously.
🔶 Pattern Detection : Identifies specific candle patterns and technical confluences that suggest potential trading setups across USDT.P contracts of the selected category.
🔶 Signal Generation : When technical criteria are met at bar close, the indicator creates deal-start signals for the relevant pairs.
🔶 3Commas Integration : Packages these signals and delivers them to 3Commas through TradingView alerts, allowing 3Commas bots to receive specific pair information ('Deal-Start' signals).
🔶 Category Management : Each TradingView alert monitors an entire category, allowing selective activation of different crypto categories.
🔶 Visual Feedback : Provides color-coded candles and backgrounds to visualize technical conditions, with optional pivot points and trend visualization.
Candle types
Signals
----------------------------------------------
Quick Start Guide
1. Setup 3Commas Bots : Configure two DCA bots in 3Commas (All USDT pairs) - one for LONG positions and one for SHORT positions.
2. Define Trading Parameters : Set your budget for each trade and adjust your preferred sensitivity within the indicator settings.
3. Create Category Alerts : Set up one TradingView alert for each crypto category you want to trade.
That's it! Once configured, the system automatically sends signals to your 3Commas bots when predefined trading setups are detected across coins in your selected/activated categories. The indicator scans all coins at bar close (for example, every hour on the 1H timeframe) and triggers trade execution only for those showing technical confluences.
Important : Consider your total capital when enabling categories. More details about the setup process are provided below (see paragraph "Detailed Setup & Configuration").
----------------------------------------------
Built-in Backtesting
The 3Commas Multicoin Scalper LITE includes backtesting visualization for each coin. When viewing any USDT Perpetual pair on your chart, you can visualize how the strategy would have performed historically on that specific asset.
Color-coded candles and signal markers show past trading setups, helping you evaluate which coins responded best to the strategy. This built-in backtesting capability can support your selection of assets/categories to trade before deploying real capital.
As backtesting results are hypothetical and do not guarantee future performance, your research and analysis are essential for selecting the crypto categories/coins to trade.
The default strategy settings are: Start Capital 1,000$, leverage 10X, Commissions 0.1% (average Taker Fee on Exchanges for average users), Order Amount 200$ for Longs/Shorts, Slippage 4
Example of backtesting view
----------------------------------------------
Key Features
🔶 Multi-Exchange Support : Compatible with BINANCE, BYBIT, BITGET, GATEIO, and OKX USDT Perpetual markets (USDT.P)
🔶 Category Options : Analyze cryptocurrencies in the Top Major Coins category or create your custom watchlist
🔶 Custom Category Option : Create your watchlist with up to 10 custom USDT Perpetual pairs
🔶 3Commas Integration : Seamlessly connects with 3Commas bots to automate trade entries and exits
🔶 Dual Strategy Approach : Identifies both "trend following" and "contrarian" potential setups
🔶 Confluence-Based Signals : Uses a combination of multiple technical factors - price spikes, price momentum, volume spikes, volume momentum, trend analysis, and volatility spikes - to generate potential trading setups
🔶 Risk Management : Adjustable sensitivity/risk levels, leverage settings, and budget allocation for each trade
🔶 Visual Indicators : Color-coded candles and trading signals provide visual feedback on market conditions
🔶 Trend Indication : Background colors showing ongoing uptrends/downtrends
🔶 Pivot Points & Daily Open : Optional display of pivot points and daily open price for additional context
🔶 Liquidity Analysis : Optional display of high/low liquidity timeframes throughout the trading week
🔶 Trade Control : Configurable limit for the maximum number of signals sent to 3Commas for execution (per bar close and category)
5 Available Exchanges
Pick coins/tokens and defined your Custom Category
----------------------------------------------
Methodology
The 3Commas Multicoin Scalper LITE utilizes a multi-faceted approach to identify potential trading setups:
1. Price Action Analysis : Detects abnormal price movements by comparing the current candle's range to historical averages and standard deviations, helping identify potential "pump and dump" scenarios or new-trends start
2. Price Momentum : Evaluates the relative strength of bullish vs. bearish price movements over time, indicating the build-up of buying or selling pressure.
3. Volume Analysis: Identifies unusual volume spikes by comparing current volume to historical averages, signaling strong market interest in a particular direction.
4. Volume Momentum : Measures the ratio of bullish to bearish volume, revealing the dominance of buyers or sellers over time.
5. Trend Analysis : Combines EMA slopes, RSI, and Stochastic RSI to determine overall trend direction and strength.
6. Volatility : Monitors the ATR (Average True Range) to detect periods of increased market volatility, which may indicate potential breakouts or reversals
7. Candle Wick Analysis : Evaluates upper and lower wick percentages to detect potential rejection patterns and reversals.
8. Pivot Point Analysis : Uses pivot points (PP, R1-R3, S1-S3) for identifying key support/resistance areas and potential breakout/breakdown levels.
9. Daily Open Reference: Analyzes price action relative to the daily open for potential setups related to price movement vs. the opening price
10. Market Timing/Liquidity : Evaluates high/low liquidity periods, specific days/times of heightened risk, and potential market manipulation timeframes.
11. Boost Factors : Applies additional weight to certain confluence patterns to adjust global scores
These factors are combined into a "Global Score" ranging from -1 to +1 , applied at bar close to the newly formed candles.
Scores above predefined thresholds (configurable via the Sensitivity Settings) indicate strong bullish or bearish conditions and trigger signals based on predefined patterns. The indicator then applies additional filters to generate specific "Trend Following" and "Contrarian" trading signals. The identified signals are packaged and sent to 3Commas for execution.
Pivot Points
Trend Background
----------------------------------------------
Who This Strategy Is For
The 3Commas Multicoin Scalper LITE may benefit:
Crypto Traders seeking to automate their trading across multiple coins simultaneously
3Commas Users looking to enhance their bot performance with technical signals
Busy Traders who want to monitor market opportunities without constant chart-watching
Multi-strategy traders interested in both trend-following and reversal trading approaches
Traders of Various Experience Levels from intermediate traders wanting to save time to advanced traders seeking to optimize their operations
Perpetual Futures Traders on major exchanges (Binance, Bybit, OKX, Gate.io, Bitget)
Swing and Scalp Traders seeking to identify short to medium-term profit opportunities
----------------------------------------------
Visual Indicators
The indicator provides visual feedback through:
1. Candlestick Colors :
* Lime: Strong bullish candle (High positive score)
* Blue: Moderate bullish candle (Medium positive score)
* Red: Strong bearish candle (High negative score)
* Purple: Moderate bearish candle (Medium negative score)
* Pale Green/Red: Mild bullish/bearish candle
2. Signal Markers :
* ↗: Trend following Long signal
* ↘: Trend following Short signal
* ⤴: Contrarian Long signal
* ⤵: Contrarian Short signal
3. Optional Elements :
* Pivot Points: Daily support/resistance levels (R1-R3, S1-S3, PP)
* Daily Open: Reference price level for the current trading day
* Trend Background: Color-coded background suggesting potential ongoing uptrend/downtrend
* Liquidity Highlighting: Background colors indicating typical high/low market liquidity periods
4. TradingView Strategy Plots and Backtesting Data : Standard performance metrics showing entry/exit points, equity curves, and trade statistics, based on the signals generated by the script.
----------------------------------------------
Detailed Setup & Configuration
The indicator features a user-friendly input panel organized in sequential steps to guide you through the complete setup process. Tooltips for each step provide additional information to help you understand the actions required to get the strategy running.
Informative tables provide additional details and instructions for critical setup steps such as 3Commas bot configuration and TradingView alert creation (to activate trading on specific categories).
1. Choose Exchange, Crypto Category & Sensitivity
* Select your USDT Perpetual Exchange (BINANCE, BYBIT, BITGET, GATEIO, or OKX) - i.e. the same Exchange connected in your 3Commas account
* Choose your preferred crypto category, or define your watchlist
* Choose from three sensitivity levels: Default, Aggressive, or Test Mode (test mode is designed to generate more signals, a potentially helpful feature when you are testing the indicator and alerts)
2. Setup 3Commas Bots and integrate them with the algo
* Create both LONG and SHORT DCA Bots in 3Commas
* Configure bots to accept signals for 'All USDT Pairs' with "TradingView Custom Signal" as deal start condition
* Enter your Bot IDs and Email Token in the indicator settings
* Set a maximum budget for LONG and SHORT trades
* Choose whether to allow LONG trades, SHORT trades, or both, according to your preference and market analysis
* Set maximum trades per bar/category (i.e. the max. number of simultaneous signals that the algo may send to your 3Commas bots for execution at every bar close - every hour if you set the 1H timeframe)
* Access the detailed setup guide table for step-by-step 3Commas configuration instructions
3Commas integration
3. Choose Visuals
* Toggle various optional visual elements to add to the chart: category metrics, fired alerts, coin metrics, daily open, pivot points
* Select a color theme: Dark or Light
4. Activate Trading via Alerts
* Create TradingView alerts for each category you want to trade
* Set alert condition to "3Commas Multicoin Scalper" with "Any alert() function call"
* Set the content of the message field to: {{Message}}, deleting the default content shown in this text field, to enable proper 3Commas integration (any other text than {{Message}}, would break the delivery trading signals from Tradingview to 3Commas)
* View the alerts setup instruction table for visual guidance on this critical step
Alerts
Fired Alerts (example at a single bar)
Fired Alerts (frequency)
Important Configuration Notes
Ensure that the TradingView chart's exchange matches your selected exchange in the indicator settings and your 3Commas bot settings.
You must configure the same leverage in both the script and your 3Commas bots
Your 3Commas bots must be configured for All USDT pairs
You must enter the exact Bot IDs and Email Token from 3Commas (these remain confidential - no one, including us, has access to them)
If you activate multiple categories without sufficient capital, 3Commas will display " insufficient funds " errors - align your available capital with the number of categories you activate (each deal will use the budget amount specified in user inputs)
You are free to set your Take Profit % / trailing on 3Commas
We recommend not to use DCA orders (i.e. set the number of DCA orders at zero)
Legend of symbols and plots on the chart
----------------------------------------------
FAQs
General Questions
❓ Q: What features are included in this indicator? A: This indicator provides access to the "Top Major Coins" category and a custom category option where you can define up to 10 pairs of your choice. It includes multi-exchange support, 3Commas integration, a dual strategy approach, visual indicators, trade controls, and comprehensive backtesting capabilities. The indicator is optimized to manage up to 2 trades per hour/category with leverage up to 10x and trade sizes up to 500 USDT - everything needed for traders looking to automate their crypto trading across multiple pairs simultaneously.
❓ Q: What is Global Score? A: The Global Score serves as a foundation for signal generation. When a candle's score exceeds certain thresholds (defined by your Risk Level setting), it becomes a candidate for signal generation. However, not all high-scoring candles generate trading signals - the indicator applies additional pattern recognition and contextual filters. For example, a strongly positive score (lime candle) in an established uptrend may trigger a "Trend Following" signal, while a strongly negative score (red candle) in a downtrend might generate a "Trend following Short" signal. Similarly, contrarian signals are generated when specific reversal patterns occur alongside appropriate Global Score values, often involving wick analysis and pivot point interactions. This multi-layer approach helps filter out false positives and identify higher-probability trading setups.
❓ Q: What's the difference between "Trend following" and "Contrarian" signals in the script? A: "Trend Following" signals follow the identified trends while "Contrarian" signals anticipate potential trend reversals.
❓ Q: Why don't I see any signals on my chart? A: Make sure you're viewing a USDT Perpetual pair from your selected exchange that belongs to the crypto category you've chosen to analyze. For example, if you've selected the "Top Major Coins" category with Binance as your exchange, you need to view a chart of one of those specific pairs (like BINANCE:BTCUSDT.P) to see signals. If you switch exchanges, for example from Binance to Bybit, you need to pull a Bybit pair on the chart to see backtesting data and signals.
❓ Q: Does this indicator guarantee profits? A: No. Trading cryptocurrencies involves significant risk, and past performance is not indicative of future results. This indicator is a tool to help you identify potential trading setups, but it does not and cannot guarantee profits.
❓ Q: Does this indicator repaint or use lookahead bias? A: No. All trading signals generated by this indicator are based only on completed price data and do not repaint. The system is designed to ensure that backtesting results reflect as closely as possible what you should experience in live trading.
While reference levels like pivot points are kept stable throughout the day using lookahead on, the actual buy and sell signals are calculated using only historical data (lookahead off) that would have been available at that moment in time. This ensures reliability and consistency between backtesting and real-time trading performance.
Technical Setup
❓ Q: What exchanges are supported? A: The strategy supports BINANCE, BYBIT, BITGET, GATEIO, and OKX USDT Perpetual markets (i.e. all the Exchanges you can connect to your 3Commas account for USDT Perpetual trading, excluding Coinbase Perpetual that offers USDC pairs, instead of USDT).
❓ Q: What timeframe should I use? A: The indicator is optimized for the 1-hour (1H) timeframe but may run on any timeframe.
❓ Q: How many coins can I trade at once? A: You can trade all coins within the selected category. You can activate categories by setting up alerts.
❓ Q: How many alerts do I need to set up? A: You need to set up one alert for each crypto category you want to trade. We recommend starting with one category, testing the results carefully, monitoring performance daily, and perhaps activating additional categories in a second stage.
❓ Q: Are there any specific risk management features built into the indicator? A: Yes, the indicator includes risk management features: adjustable maximum trades per hour/category, the ability to enable/disable long or short signals depending on market conditions, customizable trade size for both long and short positions, and different sensitivity/risk level settings.
❓ Q: What happens if 3Commas can't execute a signal? A: If 3Commas cannot execute a signal (due to insufficient funds, bot offline, etc.), the trade will be skipped. The indicator will continue sending signals for other valid setups, but it doesn't retry failed signals.
❓ Q: Can I run this indicator on multiple charts at once? A: Yes, but it's not necessary. The indicator analyzes all coins in your selected categories regardless of which chart you apply it to. For optimal resource usage, apply it to a single chart of a USDT Perpetual pair from your selected exchange. To stop trading a category, simply delete the alert created for that category.
❓ Q: How frequently does the indicator scan for new signals? A: The indicator scans all coins in your selected categories at the close of each bar (every hour if you selected the 1H timeframe).
----------------------------------------------
⚠️
Disclaimer
This indicator is for informational and educational purposes only and does not constitute financial advice. Trading cryptocurrencies involves significant risk, including the potential loss of all invested capital, and past performance is not indicative of future results.
Always conduct your own thorough research (DYOR) and understand the risks involved before making any trading decisions. Trading with leverage significantly amplifies both potential profits and losses - exercise extreme caution when using leverage and never risk more than you can afford to lose.
The Bot ID and Email Token information are transmitted directly from TradingView to 3Commas via secure connections. No third party or entity will ever have access to this data (including the Author). Do not share your 3Commas credentials with anyone.
This indicator is not affiliated with, endorsed by, or sponsored by TradingView or 3Commas.

3Commas Multicoin Scalper PRO [SwissAlgo]Introduction
Are you tired of tracking dozens of cryptocurrency charts and placing orders manually on your Exchange?
The 3Commas Multicoin Scalper PRO is an automated trading system designed to simultaneously identify and execute potential trading setups on multiple cryptocurrencies on your preferred Exchange (Binance, Bybit, OKX, Gate.io, Bitget) via 3Commas integration.
It analyzes price action, volume, momentum, volatility, and trend patterns across 180+ USDT Perpetual coins divided into 17 crypto categories , providing real-time signals directly to your 3Commas bots for automated trade execution. This indicator aims to identify potential trend-following and contrarian setups in both bull and bear markets.
-------------------------------------
What it Does
The 3Commas Multicoin Scalper PRO is a technical analysis tool that monitors multiple cryptocurrency pairs simultaneously and connects with 3Commas for signal delivery and execution.
Here's how the strategy works:
🔶 Technical Analysis : Analyzes price action, volume, momentum, volatility, and trend patterns across multiple USDT Perpetual Futures contracts simultaneously.
🔶 Pattern Detection : Identifies specific candle patterns and technical confluences that suggest potential trading setups across all USDT.P contracts of the selected categories
🔶 Signal Generation : When technical criteria are met at bar close, the indicator creates deal-start signals for the relevant pairs.
🔶 3Commas Integration : Packages these signals and delivers them to 3Commas through TradingView alerts, allowing 3Commas bots to receive specific pair information ('Deal-Start' signals).
🔶 Category Management : Each TradingView alert monitors an entire category (approximately 11 pairs), allowing selective activation of different crypto categories.
🔶 Visual Feedback : Provides color-coded candles and backgrounds to visualize technical conditions, with optional pivot points and trend visualization.
Candle types:
Signals:
-------------------------------------
Quick Start Guide
1. Setup 3Commas Bots : Configure two DCA bots in 3Commas (All USDT pairs) - one for LONG positions and one for SHORT positions.
2. Define Trading Parameters : Set your budget for each trade and adjust your preferred sensitivity within the indicator settings.
3. Create Category Alerts : Set up one TradingView alert for each crypto category you want to trade.
That's it! Once configured, the system automatically sends signals to your 3Commas bots when predefined trading setups are detected across coins in your selected/activated categories. The indicator scans all coins at bar close (for example, every hour on the 1H timeframe) and triggers trade execution only for those showing technical confluences.
Important : The more categories you activate by setting TradingView alerts, the more signals your 3Commas bots will receive. Consider your total capital when enabling multiple categories. More details about the setup process are provided below (see paragraph "Detailed Setup & Configuration")
-------------------------------------
Built-in Backtesting
The 3Commas Multicoin Scalper PRO includes backtesting visualization for each coin. When viewing any USDT Perpetual pair on your chart, you can visualize how the strategy would have performed historically on that specific asset.
Color-coded candles and signal markers show past trading setups, helping you evaluate which coins responded best to the strategy. This built-in backtesting capability can support your selection of assets/categories to trade before deploying real capital.
As backtesting results are hypothetical and do not guarantee future performance, your research and analysis are essential for selecting the crypto categories/coins to trade.
The default strategy settings are: Start Capital 1.000$, leverage 25X, Commissions 0.1% (average Taker Fee on Exchanges for average users), Order Amount 200$ for Longs/150$ for Shorts, Slippage 4
-------------------------------------
Key Features
🔶 Multi-Exchange Support : Compatible with BINANCE, BYBIT, BITGET, GATEIO, and OKX USDT Perpetual markets (USDT.P)
🔶 Wide Asset Coverage : Simultaneously analyzes 180+ cryptocurrencies across 17 specialized crypto categories
🔶 Custom Category Option : Create your watchlist with up to 10 custom USDT Perpetual pairs
🔶 3Commas Integration : Seamlessly connects with 3Commas bots to automate trade entries and exits
🔶 Dual Strategy Approach : Identifies both "trend following" and "contrarian" potential setups
🔶 Confluence-Based Signals : Uses a combination of multiple technical factors - price spikes, price momentum, volume spikes, volume momentum, trend analysis, and volatility spikes - to generate potential trading setups
🔶 Risk Management : Adjustable sensitivity/risk levels, leverage settings, and budget allocation for each trade
🔶 Visual Indicators : Color-coded candles and trading signals provide visual feedback on market conditions
🔶 Trend Indication : Background colors showing ongoing uptrends/downtrends
🔶 Pivot Points & Daily Open : Optional display of pivot points and daily open price for additional context
🔶 Liquidity Analysis : Optional display of high/low liquidity timeframes throughout the trading week
🔶 Trade Control : Configurable limit for the maximum number of signals sent to 3Commas for execution (per bar close and category)
Available Exchanges
Categories
Custom Category
Trend following/contrarian signals
-------------------------------------
Methodology
The 3Commas Multicoin Scalper PRO utilizes a multi-faceted approach to identify potential trading setups:
1. Price Action Analysis : Detects abnormal price movements by comparing the current candle's range to historical averages and standard deviations, helping identify potential "pump and dump" scenarios or new-trends start
2. Price Momentum : Evaluates the relative strength of bullish vs. bearish price movements over time, indicating the build-up of buying or selling pressure.
3. Volume Analysis: Identifies unusual volume spikes by comparing current volume to historical averages, signaling strong market interest in a particular direction.
4. Volume Momentum : Measures the ratio of bullish to bearish volume, revealing the dominance of buyers or sellers over time.
5. Trend Analysis : Combines EMA slopes, RSI, and Stochastic RSI to determine overall trend direction and strength.
6. Volatility : Monitors the ATR (Average True Range) to detect periods of increased market volatility, which may indicate potential breakouts or reversals
7. Candle Wick Analysis : Evaluates upper and lower wick percentages to detect potential rejection patterns and reversals.
8. Pivot Point Analysis : Uses pivot points (PP, R1-R3, S1-S3) for identifying key support/resistance areas and potential breakout/breakdown levels.
9. Daily Open Reference: Analyzes price action relative to the daily open for potential setups related to price movement vs. the opening price
10. Market Timing/Liquidity : Evaluates high/low liquidity periods, specific days/times of heightened risk, and potential market manipulation timeframes.
11. Boost Factors : Applies additional weight to certain confluence patterns to adjust global scores
These factors are combined into a "Global Score" ranging from -1 to +1 , applied at bar close to the newly formed candles.
Scores above predefined thresholds (configurable via the Sensitivity Settings) indicate strong bullish or bearish conditions and trigger signals based on predefined patterns. The indicator then applies additional filters to generate specific "Trend Following" and "Contrarian" trading signals. The identified signals are packaged and sent to 3Commas for execution.
Pivot Points
Daily open
Market Trend
Liquidity patterns by weekday
-------------------------------------
Who This Strategy Is For?
The 3Commas Multicoin Scalper PRO may benefit:
Crypto Traders seeking to automate their trading across multiple coins simultaneously
3Commas Users looking to enhance their bot performance with advanced technical signals
Busy Traders who want to monitor many market opportunities without constant chart-watching
Multi-strategy traders interested in both trend-following and reversal trading approaches
Traders of Various Experience Levels from intermediate traders wanting to save time to advanced traders seeking to scale their operations
Perpetual Futures Traders on major exchanges (Binance, Bybit, OKX, Gate.io, Bitget)
Swing and Scalp Traders seeking to identify short to medium-term profit opportunities
-------------------------------------
Visual Indicators
The indicator provides visual feedback through:
1. Candlestick Colors :
* Lime: Strong bullish candle (High positive score)
* Blue: Moderate bullish candle (Medium positive score)
* Red: Strong bearish candle (High negative score)
* Purple: Moderate bearish candle (Medium negative score)
* Pale Green/Red: Mild bullish/bearish candle
2. Signal Markers :
* ↗: Trend Following Long signal
* ↘: Trend Following Short signal
* ⤴: Contrarian Long signal
* ⤵: Contrarian Short signal
3. Optional Elements :
* Pivot Points: Daily support/resistance levels (R1-R3, S1-S3, PP)
* Daily Open: Reference price level for the current trading day
* Trend Background: Color-coded background suggesting potential ongoing uptrend/downtrend
* Liquidity Highlighting: Background colors indicating typical high/low market liquidity periods
4. TradingView Strategy Plots and Backtesting Data : Standard performance metrics showing entry/exit points, equity curves, and trade statistics, based on the signals generated by the script.
-------------------------------------
Detailed Setup & Configuration
The indicator features a user-friendly input panel organized in sequential steps to guide you through the complete setup process. Tooltips for each step provide additional information to help you understand the actions required to get the strategy running.
Informative tables provide additional details and instructions for critical setup steps such as 3Commas bot configuration and TradingView alert creation (to activate trading on specific categories).
1. Choose Exchange, Crypto Category & Sensitivity
* Select your USDT Perpetual Exchange (BINANCE, BYBIT, BITGET, GATEIO, or OKX) - i.e. the same Exchange connected in your 3Commas account
* Browse and choose your preferred crypto category, or define your watchlist
* Choose from three sensitivity levels: Default, Aggressive, or Test Mode (test mode is designed to generate way more signals, a potentially helpful feature when you are testing the indicator and alerts)
2. Setup 3Commas Bots and integrate them with the algo
* Create both LONG and SHORT DCA Bots in 3Commas
* Configure bots to accept signals for 'All USDT Pairs' with "TradingView Custom Signal" as deal start condition
* Enter your Bot IDs and Email Token in the indicator settings
* Set a maximum budget for LONG and SHORT trades
* Choose whether to allow LONG trades, SHORT trades, or both, according to your preference and market analysis
* Set maximum trades per bar/category (i.e. the max. number of simultaneous signals that the algo may send to your 3Commas bots for execution at every bar close - every hour if you set the 1H timeframe)
* Access the detailed setup guide table for step-by-step 3Commas configuration instructions
3Commas integration
3. Choose Visuals
* Toggle various optional visual elements to add to the chart: category metrics, fired alerts, coin metrics, daily open, pivot points
* Select a color theme: Dark or Light
4. Activate Trading via Alerts
* Create TradingView alerts for each category you want to trade
* Set alert condition to "3Commas Multicoin Scalper" with "Any alert() function call"
* Set the content of the message filed to: {{Message}}, deleting the default content shown in this text field, to enable proper 3Commas integration (any other text than {{Message}}, would break the delivery trading signals from Tradingview to 3Commas)
* View the alerts setup instruction table for visual guidance on this critical step
Alerts
Fired Alerts
Important Configuration Notes
Ensure that the TradingView chart's exchange matches your selected exchange in the indicator settings and your 3Commas bot settings.
You must configure the same leverage in both the script and your 3Commas bots
Your 3Commas bots must be configured for All USDT pairs
You must enter the exact Bot IDs and Email Token from 3Commas (these remain confidential - no one, including us, has access to them)
If you activate multiple categories without sufficient capital, 3Commas will display " insufficient funds " errors - align your available capital with the number of categories you activate (each deal will use the budget amount specified in user inputs)
You are free to set your Take Profit % / trailing on 3Commas
We recommend not to use DCA orders (i.e. set the number of DCA orders at zero)
Legend of symbols
-------------------------------------
FAQs
General Questions
❓ Q: What is Global Score? A: The Global Score serves as a foundation for signal generation. When a candle's score exceeds certain thresholds (defined by your Risk Level setting), it becomes a candidate for signal generation. However, not all high-scoring candles generate trading signals - the indicator applies additional pattern recognition and contextual filters. For example, a strongly positive score (lime candle) in an established uptrend may trigger a "Trend Following" signal, while a strongly negative score (red candle) in a downtrend might generate a "Trend Following Short" signal. Similarly, contrarian signals are generated when specific reversal patterns occur alongside appropriate Global Score values, often involving wick analysis and pivot point interactions. This multi-layer approach helps filter out false positives and identify higher-probability trading setups.
❓ Q: What's the difference between "Trend following" and "Contrarian" signals in the script? A: "Trend Following" signals follow the identified trends while "Contrarian" signals anticipate potential trend reversals.
❓ Q: Why can't I configure all the parameters? A: We've designed the solution to be plug-and-play to prevent users from getting lost in endless configurations. The preset values have been tested against their trade-offs in terms of financial performance, average trade duration, and risk levels.
❓ Q: Why don't I see any signals on my chart? A: Make sure you're viewing a USDT Perpetual pair from your selected exchange that belongs to the crypto category you've chosen to analyze. For example, if you've selected the "Top Major Coins" category with Binance as your exchange, you need to view a chart of one of those specific pairs (like BINANCE:BTCUSDT.P) to see signals. If you switch exchanges, for example from Binance to Bybit, you need to pull a Bybit pair on the chart to see backtesting data and signals.
❓ Q: Does this indicator guarantee profits? A: No. Trading cryptocurrencies involves significant risk, and past performance is not indicative of future results. This indicator is a tool to help you identify potential trading setups, but it does not and cannot guarantee profits.
❓ Q: Does this indicator repaint or use lookahead bias? A: No. All trading signals generated by this indicator are based only on completed price data and do not repaint. The system is designed to ensure that backtesting results reflect as closely as possible what you should experience in live trading.
While reference levels like pivot points are kept stable throughout the day using lookahead on, the actual buy and sell signals are calculated using only historical data (lookahead off) that would have been available at that moment in time. This ensures reliability and consistency between backtesting and real-time trading performance.
Technical Setup
❓ Q: What exchanges are supported? A: The strategy supports BINANCE, BYBIT, BITGET, GATEIO, and OKX USDT Perpetual markets (i.e. all the Exchanges you can connect to your 3Commas account for USDT Perpetual trading, excluding Coinbase Perpetual that offers UDSC pairs, instead of USDT).
❓ Q: What timeframe should I use? A: The indicator is optimized for the 1-hour (1H) timeframe but may run on any timeframe.
❓ Q: How many coins can I trade at once? A: You can trade all coins within each selected category (up to 11 coins per category in standard categories). You can activate multiple categories by setting up multiple alerts.
❓ Q: How many alerts do I need to set up? A: You need to set up one alert for each crypto category you want to trade. For example, if you want to trade both the "Top Major Coins" and the "DeFi" categories, you'll need to create two separate alerts, one for each category. We recommend starting with one category, testing the results carefully, monitoring performance daily, and perhaps activating additional categories in a second stage.
❓ Q: Are there any specific risk management features built into the indicator? A: Yes, the indicator includes risk management features: adjustable maximum trades per hour/category, the ability to enable/disable long or short signals depending on market conditions, customizable trade size for both long and short positions, and different sensitivity/risk level settings.
❓ Q: What happens if 3Commas can't execute a signal? A: If 3Commas cannot execute a signal (due to insufficient funds, bot offline, etc.), the trade will be skipped. The indicator will continue sending signals for other valid setups, but it doesn't retry failed signals.
❓ Q: Can I run this indicator on multiple charts at once? A: Yes, but it's not necessary. The indicator analyzes all coins in your selected categories regardless of which chart you apply it to. For optimal resource usage, apply it to a single chart of a USDT Perpetual pair from your selected exchange. To stop trading a category delete the alert created for that category.
❓ Q: How frequently does the indicator scan for new signals? A: The indicator scans all coins in your selected categories at the close of each bar (every hour if you selected the 1H timeframe).
3Commas Integration
❓ Q: Do I need a 3Commas account? A: Yes, a 3Commas account with active DCA bots (both LONG and SHORT) is required for automated trade execution. A paid subscription is needed, as multipair Bots and multiple simultaneous deals are involved.
❓ Q: How do I set the leverage? A: Set the leverage identically in both the indicator settings and your 3Commas DCA bots (the max supported leverage is 50x). Always be careful about leverage, as it amplifies both profits and losses.
❓ Q: Where do I find my 3Commas Bot IDs and Email Token? A: Open your 3Commas DCA bot and scroll to the "Messages" section. You'll find the Bot ID and Email Token within any message (e.g., "Start Deal").
Display Settings
❓ Q: What does the Sensitivity setting do? A: It adjusts the sensitivity of signal generation. "Default" provides a balanced approach with moderate signal frequency. "Aggressive" lowers the thresholds for signal generation, potentially increasing trade frequency but may include more noise. "Test Mode" is the most sensitive setting, useful for testing alert configurations but not recommended for live trading. Higher risk levels may generate more signals but with potentially lower average quality, while lower risk levels produce fewer but potentially better signals.
❓ Q: What does "Show fired alerts" do? A: The "Show fired alerts" option displays a label on your chart showing which signals have been fired and sent to 3Commas during the most recent candle closes. This visual indicator helps you confirm that your alerts are working properly and shows which coins from your selected category have triggered signals. It's useful when setting up and testing the system, allowing you to verify that signals are being sent to 3Commas as expected and their frequency over time.
❓ Q: What does "Show coin/token metrics" do? A: This toggle displays detailed technical metrics for the specific coin/token currently shown on your chart. When enabled, it shows statistics for the last closed candle for that coin.
❓ Q: What does "Show most liquid days/times" do? A: This toggle displays color-coded background highlighting to indicate periods of varying market liquidity throughout the trading week. Green backgrounds show generally higher liquidity periods (typically weekday trading hours), yellow highlights potentially manipulative periods (often Sunday/Monday overnight), and gray indicates low liquidity periods (when major markets are closed or during late hours).
⚠️ Disclaimer
This indicator is for informational and educational purposes only and does not constitute financial advice. Trading cryptocurrencies involves significant risk, including the potential loss of all invested capital, and past performance is not indicative of future results.
Always conduct your own thorough research (DYOR) and understand the risks involved before making any trading decisions. Trading with leverage significantly amplifies both potential profits and losses - exercise extreme caution when using leverage and never risk more than you can afford to lose.
The Bot ID and Email Token information are transmitted directly from TradingView to 3Commas via secure connections. No third party or entity will ever have access to this data (including the Author). Do not share your 3Commas credentials with anyone.
This indicator is not affiliated with, endorsed by, or sponsored by TradingView or 3Commas.

Destroyer LifeDestroyer Life Strategy - High-Frequency Long & Short Trading
Overview:
The Destroyer Life strategy is an advanced cryptocurrency trading algorithm designed for high-frequency execution on the 15-second timeframe. It combines CRT (Candle Range Trend) and Turtle Soup trading logic with multi-timeframe analysis to optimize entries and exits for both long and short trades. This strategy is specifically optimized for high-volatility crypto pairs, such as SOL/USD on MEXC, ensuring precise execution with minimal drawdown.
Key Features:
15-Second Timeframe Execution: Optimized for ultra-short-term trading.
Long & Short Strategy: Simultaneously identifies profitable buy and sell opportunities.
CRT & Turtle Soup Logic: Leverages price action patterns for enhanced trade accuracy.
Higher Timeframe Analysis (HTF): Incorporates liquidity zones, fair value gaps (FVG), and breaker blocks for context-aware trading.
Dynamic Position Sizing: Uses an adjustable leverage multiplier for risk-controlled trade sizing.
Commission Optimization: Ensures profitability even with trading fees.
Strict Risk Management: Implements exit conditions based on liquidity structure and trend reversals.
Strategy Performance (Backtested on SOL/USD - MEXC):
Overall Profitability: ~80% win rate in backtesting.
Net Profit: $3,151.12 (6.30% ROI).
Gross Profit: $3,795.68 (7.59%).
Gross Loss: $644.56 (1.29%).
Long Trades Profit: $1,459.05 (2.92%).
Short Trades Profit: $1,692.07 (3.38%).
Commission Paid: $924.82.
Minimum Trade Holding Period: 1-minute cooldown between trades.
Trading Logic:
Entry Conditions:
Long Trades: Triggered when the price enters a liquidity void and aligns with higher timeframe bullish bias.
Short Trades: Triggered when price approaches a resistance level with bearish higher timeframe confluence.
CRT & Turtle Soup Patterns: Identifies reversals by analyzing breakout and fake-out structures.
Exit Conditions:
Long Positions Close: Upon price exceeding a 3.88% profit threshold or reversing below an HTF structure.
Short Positions Close: Upon reaching a similar 3.88% threshold or showing strong bullish signals.
Dynamic Position Sizing:
Uses a leverage-based calculation that adapts trade size based on volatility.
Liquidity Awareness:
Tracks Mitigation Blocks (MB), Fair Value Gaps (FVG), Buy/Sell-Side Liquidity (BSL/SSL) to determine optimal execution.
Best Use Cases:
Scalpers & High-Frequency Traders: Those looking for rapid trade execution with short holding periods.
Crypto Traders Focused on Low Timeframes: Optimized for 15-second price action.
Traders Utilizing Liquidity Concepts: Built to exploit liquidity traps and inefficiencies.
Risks & Considerations:
High-Frequency Execution Requires Low Latency: Ensure your broker or exchange supports fast order execution.
Backtested Results May Vary: Real-time performance depends on market conditions.
Commission & Fees Impact Profits: Consider exchanges with low fees to maximize strategy efficiency.
Final Thoughts:
The Destroyer Life Strategy is designed for serious traders looking to take advantage of high-volatility markets with a structured, liquidity-based approach. By combining price action, liquidity concepts, and adaptive risk management, it provides a solid framework for executing high-probability trades on crypto markets.
🚀 Ready to take your trading to the next level? Try Destroyer Life today and dominate the markets!

AlgoBuilder [Trend-Following] | FractalystWhat's the strategy's purpose and functionality?
This strategy is designed for both traders and investors looking to rely on and trade based on historical and backtested data using automation. The main goal is to build profitable trend-following strategies that outperform the underlying asset in terms of returns while minimizing drawdown. For example, as for a benchmark, if the S&P 500 (SPX) has achieved an estimated 10% annual return with a maximum drawdown of -57% over the past 20 years, using this strategy with different entry and exit techniques, users can potentially seek ways to achieve a higher Compound Annual Growth Rate (CAGR) while maintaining a lower maximum drawdown.
Although the strategy can be applied to all markets and timeframes, it is most effective on stocks, indices, future markets, cryptocurrencies, and commodities and JPY currency pairs given their trending behaviors.
In trending market conditions, the strategy employs a combination of moving averages and diverse entry models to identify and capitalize on upward market movements. It integrates market structure-based trailing stop-loss mechanisms across different timeframes and provides exit techniques, including percentage-based and risk-reward (RR) based take profit levels.
Additionally, the strategy has also a feature that includes a built-in probability and sentiment function for traders who want to implement probabilities and market sentiment right into their trading strategies.
Performance summary, weekly, and monthly tables enable quick visualization of performance metrics like net profit, maximum drawdown, compound annual growth rate (CAGR), profit factor, average trade, average risk-reward ratio (RR), and more. This aids optimization to meet specific goals and risk tolerance levels effectively.
-----
How does the strategy perform for both investors and traders?
The strategy has two main modes, tailored for different market participants: Traders and Investors.
Trading:
1. Trading (1x):
- Designed for traders looking to capitalize on bullish trending markets.
- Utilizes a percentage risk per trade to manage risk and optimize returns.
- Suitable for active trading with a focus on trend-following and risk management.
- (1x) This mode ensures no stacking of positions, allowing for only one running position or trade at a time.
◓: Mode | %: Risk percentage per trade
2. Trading (2x):
Similar to the 1x mode but allows for two pyramiding entries.
This approach enables traders to increase their position size as the trade moves in their favor, potentially enhancing profits during strong bullish trends.
◓: Mode | %: Risk percentage per trade
3. Investing:
- Geared towards investors who aim to capitalize on bullish trending markets without using leverage while mitigating the asset's maximum drawdown.
- Utilizes 100% of the equity to buy, hold, and manage the asset.
- Focuses on long-term growth and capital appreciation by fully investing in the asset during bullish conditions.
- ◓: Mode | %: Risk not applied (In investing mode, the strategy uses 100% of equity to buy the asset)
-----
What's the purpose of using moving averages in this strategy? What are the underlying calculations?
Using moving averages is a widely-used technique to trade with the trend.
The main purpose of using moving averages in this strategy is to filter out bearish price action and to only take trades when the price is trading ABOVE specified moving averages.
The script uses different types of moving averages with user-adjustable timeframes and periods/lengths, allowing traders to try out different variations to maximize strategy performance and minimize drawdowns.
By applying these calculations, the strategy effectively identifies bullish trends and avoids market conditions that are not conducive to profitable trades.
The MA filter allows traders to choose whether they want a specific moving average above or below another one as their entry condition.
This comparison filter can be turned on (>/<) or off.
For example, you can set the filter so that MA#1 > MA#2, meaning the first moving average must be above the second one before the script looks for entry conditions. This adds an extra layer of trend confirmation, ensuring that trades are only taken in more favorable market conditions.
MA #1: Fast MA | MA #2: Medium MA | MA #3: Slow MA
⍺: MA Period | Σ: MA Timeframe
-----
What entry modes are used in this strategy? What are the underlying calculations?
The strategy by default uses two different techniques for the entry criteria with user-adjustable left and right bars: Breakout and Fractal.
1. Breakout Entries :
- The strategy looks for pivot high points with a default period of 3.
- It stores the most recent high level in a variable.
- When the price crosses above this most recent level, the strategy checks if all conditions are met and the bar is closed before taking the buy entry.
◧: Pivot high left bars period | ◨: Pivot high right bars period
2. Fractal Entries :
- The strategy looks for pivot low points with a default period of 3.
- When a pivot low is detected, the strategy checks if all conditions are met and the bar is closed before taking the buy entry.
◧: Pivot low left bars period | ◨: Pivot low right bars period
By utilizing these entry modes, the strategy aims to capitalize on bullish price movements while ensuring that the necessary conditions are met to validate the entry points.
-----
What type of stop-loss identification method are used in this strategy? What are the underlying calculations?
Initial Stop-Loss:
1. ATR Based:
The Average True Range (ATR) is a method used in technical analysis to measure volatility. It is not used to indicate the direction of price but to measure volatility, especially volatility caused by price gaps or limit moves.
Calculation:
- To calculate the ATR, the True Range (TR) first needs to be identified. The TR takes into account the most current period high/low range as well as the previous period close.
The True Range is the largest of the following:
- Current Period High minus Current Period Low
- Absolute Value of Current Period High minus Previous Period Close
- Absolute Value of Current Period Low minus Previous Period Close
- The ATR is then calculated as the moving average of the TR over a specified period. (The default period is 14).
Example - ATR (14) * 1.5
⍺: ATR period | Σ: ATR Multiplier
2. ADR Based:
The Average Day Range (ADR) is an indicator that measures the volatility of an asset by showing the average movement of the price between the high and the low over the last several days.
Calculation:
- To calculate the ADR for a particular day:
- Calculate the average of the high prices over a specified number of days.
- Calculate the average of the low prices over the same number of days.
- Find the difference between these average values.
- The default period for calculating the ADR is 14 days. A shorter period may introduce more noise, while a longer period may be slower to react to new market movements.
Example - ADR (14) * 1.5
⍺: ADR period | Σ: ADR Multiplier
Application in Strategy:
- The strategy calculates the current bar's ADR/ATR with a user-defined period.
- It then multiplies the ADR/ATR by a user-defined multiplier to determine the initial stop-loss level.
By using these methods, the strategy dynamically adjusts the initial stop-loss based on market volatility, helping to protect against adverse price movements while allowing for enough room for trades to develop.
Trailing Stop-Loss:
One of the key elements of this strategy is its ability to detec buyside and sellside liquidity levels across multiple timeframes to trail the stop-loss once the trade is in running profits.
By utilizing this approach, the strategy allows enough room for price to run.
There are two built-in trailing stop-loss (SL) options you can choose from while in a trade:
1. External Trailing Stop-Loss:
- Uses sell-side liquidity to trail your stop-loss, allowing price to consolidate before continuation. This method is less aggressive and provides more room for price fluctuations.
Example - External - Wick below the trailing SL - 12H trailing timeframe
⍺: Exit type | Σ: Trailing stop-loss timeframe
2. Internal Trailing Stop-Loss:
- Uses the most recent swing low with a period of 2 to trail your stop-loss. This method is more aggressive compared to the external trailing stop-loss, as it tightens the stop-loss closer to the current price action.
Example - Internal - Close below the trailing SL - 6H trailing timeframe
⍺: Exit type | Σ: Trailing stop-loss timeframe
Each market behaves differently across various timeframes, and it is essential to test different parameters and optimizations to find out which trailing stop-loss method gives you the desired results and performance.
-----
What type of break-even and take profit identification methods are used in this strategy? What are the underlying calculations?
For Break-Even:
- You can choose to set a break-even level at which your initial stop-loss moves to the entry price as soon as it hits, and your trailing stop-loss gets activated (if enabled).
- You can select either a percentage (%) or risk-to-reward (RR) based break-even, allowing you to set your break-even level as a percentage amount above the entry price or based on RR.
For TP1 (Take Profit 1):
- You can choose to set a take profit level at which your position gets fully closed or 50% if the TP2 boolean is enabled.
- Similar to break-even, you can select either a percentage (%) or risk-to-reward (RR) based take profit level, allowing you to set your TP1 level as a percentage amount above the entry price or based on RR.
For TP2 (Take Profit 2):
- You can choose to set a take profit level at which your position gets fully closed.
- As with break-even and TP1, you can select either a percentage (%) or risk-to-reward (RR) based take profit level, allowing you to set your TP2 level as a percentage amount above the entry price or based on RR.
The underlying calculations involve determining the price levels at which these actions are triggered. For break-even, it moves the initial stop-loss to the entry price and activate the trailing stop-loss once the break-even level is reached.
For TP1 and TP2, it's specifying the price levels at which the position is partially or fully closed based on the chosen method (percentage or RR) above the entry price.
These calculations are crucial for managing risk and optimizing profitability in the strategy.
⍺: BE/TP type (%/RR) | Σ: how many RR/% above the current price
-----
What's the ADR filter? What does it do? What are the underlying calculations?
The Average Day Range (ADR) measures the volatility of an asset by showing the average movement of the price between the high and the low over the last several days.
The period of the ADR filter used in this strategy is tied to the same period you've used for your initial stop-loss.
Users can define the minimum ADR they want to be met before the script looks for entry conditions.
ADR Bias Filter:
- Compares the current bar ADR with the ADR (Defined by user):
- If the current ADR is higher, it indicates that volatility has increased compared to ADR (DbU).(⬆)
- If the current ADR is lower, it indicates that volatility has decreased compared to ADR (DbU).(⬇)
Calculations:
1. Calculate ADR:
- Average the high prices over the specified period.
- Average the low prices over the same period.
- Find the difference between these average values in %.
2. Current ADR vs. ADR (DbU):
- Calculate the ADR for the current bar.
- Calculate the ADR (DbU).
- Compare the two values to determine if volatility has increased or decreased.
By using the ADR filter, the strategy ensures that trades are only taken in favorable market conditions where volatility meets the user's defined threshold, thus optimizing entry conditions and potentially improving the overall performance of the strategy.
>: Minimum required ADR for entry | %: Current ADR comparison to ADR of 14 days ago.
-----
What's the probability filter? What are the underlying calculations?
The probability filter is designed to enhance trade entries by using buyside liquidity and probability analysis to filter out unfavorable conditions.
This filter helps in identifying optimal entry points where the likelihood of a profitable trade is higher.
Calculations:
1. Understanding Swing highs and Swing Lows
Swing High: A Swing High is formed when there is a high with 2 lower highs to the left and right.
Swing Low: A Swing Low is formed when there is a low with 2 higher lows to the left and right.
2. Understanding the purpose and the underlying calculations behind Buyside, Sellside and Equilibrium levels.
3. Understanding probability calculations
1. Upon the formation of a new range, the script waits for the price to reach and tap into equilibrium or the 50% level. Status: "⏸" - Inactive
2. Once equilibrium is tapped into, the equilibrium status becomes activated and it waits for either liquidity side to be hit. Status: "▶" - Active
3. If the buyside liquidity is hit, the script adds to the count of successful buyside liquidity occurrences. Similarly, if the sellside is tapped, it records successful sellside liquidity occurrences.
5. Finally, the number of successful occurrences for each side is divided by the overall count individually to calculate the range probabilities.
Note: The calculations are performed independently for each directional range. A range is considered bearish if the previous breakout was through a sellside liquidity. Conversely, a range is considered bullish if the most recent breakout was through a buyside liquidity.
Example - BSL > 50%
-----
What's the sentiment Filter? What are the underlying calculations?
Sentiment filter aims to calculate the percentage level of bullish or bearish fluctuations within equally divided price sections, in the latest price range.
Calculations:
This filter calculates the current sentiment by identifying the highest swing high and the lowest swing low, then evenly dividing the distance between them into percentage amounts. If the price is above the 50% mark, it indicates bullishness, whereas if it's below 50%, it suggests bearishness.
Sentiment Bias Identification:
Bullish Bias: The current price is trading above the 50% daily range.
Bearish Bias: The current price is trading below the 50% daily range.
Example - Sentiment Enabled | Bullish degree above 50% | Bullish sentimental bias
>: Minimum required sentiment for entry | %: Current sentimental degree in a (Bullish/Bearish) sentimental bias
-----
What's the range length Filter? What are the underlying calculations?
The range length filter identifies the price distance between buyside and sellside liquidity levels in percentage terms. When enabled, the script only looks for entries when the minimum range length is met. This helps ensure that trades are taken in markets with sufficient price movement.
Calculations:
Range Length (%) = ( ( Buyside Level − Sellside Level ) / Current Price ) ×100
Range Bias Identification:
Bullish Bias: The current range price has broken above the previous external swing high.
Bearish Bias: The current range price has broken below the previous external swing low.
Example - Range length filter is enabled | Range must be above 5% | Price must be in a bearish range
>: Minimum required range length for entry | %: Current range length percentage in a (Bullish/Bearish) range
-----
What's the day filter Filter, what does it do?
The day filter allows users to customize the session time and choose the specific days they want to include in the strategy session. This helps traders tailor their strategies to particular trading sessions or days of the week when they believe the market conditions are more favorable for their trading style.
Customize Session Time:
Users can define the start and end times for the trading session.
This allows the strategy to only consider trades within the specified time window, focusing on periods of higher market activity or preferred trading hours.
Select Days:
Users can select which days of the week to include in the strategy.
This feature is useful for excluding days with historically lower volatility or unfavorable trading conditions (e.g., Mondays or Fridays).
Benefits:
Focus on Optimal Trading Periods:
By customizing session times and days, traders can focus on periods when the market is more likely to present profitable opportunities.
Avoid Unfavorable Conditions:
Excluding specific days or times can help avoid trading during periods of low liquidity or high unpredictability, such as major news events or holidays.
Increased Flexibility: The filter provides increased flexibility, allowing traders to adapt the strategy to their specific needs and preferences.
Example - Day filter | Session Filter
θ: Session time | Exchange time-zone
-----
What tables are available in this script?
Table Type:
- Summary: Provides a general overview, displaying key performance parameters such as Net Profit, Profit Factor, Max Drawdown, Average Trade, Closed Trades, Compound Annual Growth Rate (CAGR), MAR and more.
CAGR: It calculates the 'Compound Annual Growth Rate' first and last taken trades on your chart. The CAGR is a notional, annualized growth rate that assumes all profits are reinvested. It only takes into account the prices of the two end points — not drawdowns, so it does not calculate risk. It can be used as a yardstick to compare the performance of two strategies. Since it annualizes values, it requires a minimum 4H timeframe to display the CAGR value. annualizing returns over smaller periods of times doesn't produce very meaningful figures.
MAR: Measure of return adjusted for risk: CAGR divided by Max Drawdown. Indicates how comfortable the system might be to trade. Higher than 0.5 is ideal, 1.0 and above is very good, and anything above 3.0 should be considered suspicious and you need to make sure the total number of trades are high enough by running a Deep Backtest in strategy tester. (available for TradingView Premium users.)
Avg Trade: The sum of money gained or lost by the average trade generated by a strategy. Calculated by dividing the Net Profit by the overall number of closed trades. An important value since it must be large enough to cover the commission and slippage costs of trading the strategy and still bring a profit.
MaxDD: Displays the largest drawdown of losses, i.e., the maximum possible loss that the strategy could have incurred among all of the trades it has made. This value is calculated separately for every bar that the strategy spends with an open position.
Profit Factor: The amount of money a trading strategy made for every unit of money it lost (in the selected currency). This value is calculated by dividing gross profits by gross losses.
Avg RR: This is calculated by dividing the average winning trade by the average losing trade. This field is not a very meaningful value by itself because it does not take into account the ratio of the number of winning vs losing trades, and strategies can have different approaches to profitability. A strategy may trade at every possibility in order to capture many small profits, yet have an average losing trade greater than the average winning trade. The higher this value is, the better, but it should be considered together with the percentage of winning trades and the net profit.
Winrate: The percentage of winning trades generated by a strategy. Calculated by dividing the number of winning trades by the total number of closed trades generated by a strategy. Percent profitable is not a very reliable measure by itself. A strategy could have many small winning trades, making the percent profitable high with a small average winning trade, or a few big winning trades accounting for a low percent profitable and a big average winning trade. Most trend-following successful strategies have a percent profitability of 15-40% but are profitable due to risk management control.
BE Trades: Number of break-even trades, excluding commission/slippage.
Losing Trades: The total number of losing trades generated by the strategy.
Winning Trades: The total number of winning trades generated by the strategy.
Total Trades: Total number of taken traders visible your charts.
Net Profit: The overall profit or loss (in the selected currency) achieved by the trading strategy in the test period. The value is the sum of all values from the Profit column (on the List of Trades tab), taking into account the sign.
- Monthly: Displays performance data on a month-by-month basis, allowing users to analyze performance trends over each month.
- Weekly: Displays performance data on a week-by-week basis, helping users to understand weekly performance variations.
- OFF: Hides the performance table.
Labels:
- OFF: Hides labels in the performance table.
- PnL: Shows the profit and loss of each trade individually, providing detailed insights into the performance of each trade.
- Range: Shows the range length and Average Day Range (ADR), offering additional context about market conditions during each trade.
Profit Color:
- Allows users to set the color for representing profit in the performance table, helping to quickly distinguish profitable periods.
Loss Color:
- Allows users to set the color for representing loss in the performance table, helping to quickly identify loss-making periods.
These customizable tables provide traders with flexible and detailed performance analysis, aiding in better strategy evaluation and optimization.
-----
User-input styles and customizations:
To facilitate studying historical data, all conditions and rules can be applied to your charts. By plotting background colors on your charts, you'll be able to identify what worked and what didn't in certain market conditions.
Please note that all background colors in the style are disabled by default to enhance visualization.
-----
How to Use This Algobuilder to Create a Profitable Edge and System:
Choose Your Strategy mode:
- Decide whether you are creating an investing strategy or a trading strategy.
Select a Market:
- Choose a one-sided market such as stocks, indices, or cryptocurrencies.
Historical Data:
- Ensure the historical data covers at least 10 years of price action for robust backtesting.
Timeframe Selection:
- Choose the timeframe you are comfortable trading with. It is strongly recommended to use a timeframe above 15 minutes to minimize the impact of commissions on your profits.
Set Commission and Slippage:
- Properly set the commission and slippage in the strategy properties according to your broker or prop firm specifications.
Parameter Optimization:
- Use trial and error to test different parameters until you find the performance results you are looking for in the summary table or, preferably, through deep backtesting using the strategy tester.
Trade Count:
- Ensure the number of trades is 100 or more; the higher, the better for statistical significance.
Positive Average Trade:
- Make sure the average trade value is above zero.
(An important value since it must be large enough to cover the commission and slippage costs of trading the strategy and still bring a profit.)
Performance Metrics:
- Look for a high profit factor, MAR (Mar Ratio), CAGR (Compound Annual Growth Rate), and net profit with minimum drawdown. Ideally, aim for a drawdown under 20-30%, depending on your risk tolerance.
Refinement and Optimization:
- Try out different markets and timeframes.
- Continue working on refining your edge using the available filters and components to further optimize your strategy.
Automation:
- Once you’re confident in your strategy, you can use the automation section to connect the algorithm to your broker or prop firm.
- Trade a fully automated and backtested trading strategy, allowing for hands-free execution and management.
-----
What makes this strategy original?
1. Incorporating direct integration of probabilities into the strategy.
2. Leveraging market sentiment to construct a profitable approach.
3. Utilizing built-in market structure-based trailing stop-loss mechanisms across various timeframes.
4. Offering both investing and trading strategies, facilitating optimization from different perspectives.
5. Automation for efficient execution.
6. Providing a summary table for instant access to key parameters of the strategy.
-----
How to use automation?
For Traders:
1. Ensure the strategy parameters are properly set based on your optimized parameters.
2. Enter your PineConnector License ID in the designated field.
3. Specify the desired risk level.
4. Provide the Metatrader symbol.
5. Check for chart updates to ensure the automation table appears on the top right corner, displaying your License ID, risk, and symbol.
6. Set up an alert with the strategy selected as Condition and the Message as {{strategy.order.alert_message}}.
7. Activate the Webhook URL in the Notifications section, setting it as the official PineConnector webhook address.
8. Double-check all settings on PineConnector to ensure the connection is successful.
9. Create the alert for entry/exit automation.
For Investors:
1. Ensure the strategy parameters are properly set based on your optimized parameters.
2. Choose "Investing" in the user-input settings.
3. Create an alert with a specified name.
4. Customize the notifications tab to receive alerts via email.
5. Buying/selling alerts will be triggered instantly upon entry or exit order execution.
----
Strategy Properties
This script backtest is done on 4H COINBASE:BTCUSD , using the following backtesting properties:
Balance: $5000
Order Size: 10% of the equity
Risk % per trade: 1%
Commission: 0.04% (Default commission percentage according to TradingView competitions rules)
Slippage: 75 ticks
Pyramiding: 2
-----
Terms and Conditions | Disclaimer
Our charting tools are provided for informational and educational purposes only and should not be construed as financial, investment, or trading advice. They are not intended to forecast market movements or offer specific recommendations. Users should understand that past performance does not guarantee future results and should not base financial decisions solely on historical data.
Built-in components, features, and functionalities of our charting tools are the intellectual property of @Fractalyst Unauthorized use, reproduction, or distribution of these proprietary elements is prohibited.
By continuing to use our charting tools, the user acknowledges and accepts the Terms and Conditions outlined in this legal disclaimer and agrees to respect our intellectual property rights and comply with all applicable laws and regulations.

BotDCA | Algorithmic Smart DCA Bot🌌 What the script does, how it does ?
At the heart of its algorithm, this script incorporates the concept of Dollar Cost Averaging (DCA), a method of periodically allocating funds to an asset to mitigate the effects of market volatility.
Before we start, it's important to clarify that the script is adapted for the cryptocurrency market on USDT & USDC pairs in Spot, and on the Daily timeframe (D).
For this reason, and to optimize profits, the script will generate very few buy and sell positions.
Please also note that the script does not repaint.
Essentially, BotDCA generates buy and sell orders.
These buy and sell orders are generated using the following logic :
BUYING LOGIC :
• Volume : Current volume is compared with a linear percentile of volume over a short period.
This means that if current volume is higher than observed volumes over this period, the volume criteria is considered valid.
• Momentum & Volatility : The Average True Range (ATR) indicator adjusted by a square root is used as a measure of volatility.
Momentum is then calculated as the difference between the current closing price and a short moving average, normalized by this adjusted volatility.
The oversold condition is validated when momentum exceeds a specific level.
For the buy order to be triggered, the volume, momentum and volatility criteria must be validated.
SELLING LOGIC :
• Volume : Similar to the buy logic, the volume criteria is validated when current volume is higher than previous volumes.
• Momentum & Volatility : Volatility is measured using the adjusted ATR indicator, similar to the buy logic.
An overbought condition is validated when normalized momentum, calculated as the difference between the current closing price and a volatility-adjusted short-period moving average, exceeds a specific level.
• Trend : The general market trend is considered for the sell logic.
The trend criteria is validated when the current moving average is higher than that of the previous period.
For the sell order to be triggered, the volume, momentum, volatility and trend criteria must be validated.
These orders are also adjusted according to what the user defines as buy and sell settings :
🔵 Buying settings
• Quantity per order ($) : Defines the amount in stable coins to be invested for each buy order.
• └> Mult. quantity (x) : Multiplication factor applied to the buy quantity for successive orders, enabling the investment to be increased in the event of a price fall.
Example : If Quantity per order is $200 and Mult. quantity is x2, then the second buy order will be $400, the third buy order will be $800, the fourth buy order will be $1600 ...
After a sell order, the multiplier is cancelled.
Note : If value is set to 1 : Disabled
• └> Max. quantity (x) : Sets a maximum purchase quantity limit, preventing orders from exceeding this amount.
Example : If Quantity per order is $200, Mult. quantity is x2, and Max. quantity is $700, then the second buy order will be $400, the third buy order will be $700, the fourth buy order will be $700 ...
Note : If value is less than Quantity or is set to 0 : Disabled
• └> If Price > Average price : Enable or disable quantity multiplier when current price exceeds average price.
• Min. delay (in days) : Establishes a minimum interval in days between two successive purchases to avoid investing too close together.
Example : By default the time interval for the bot is set to D, so if you set 20 as the value, the bot will wait at least 20 days between buy orders before entering a position.
Note : If value is set to 0 : Disabled
• └> Min. deviation (%) : Defines the minimum price difference in percent to trigger a new purchase after the first.
Note : If value is set to 0 : Disabled
• └> Mult. deviation (x) : Apply a multiplication factor to the price differential for successive buys, progressively increasing the purchase interval.
Example : If Mult. deviation is 10% and Min. deviation is x2, then between the first and second buy orders the minimum deviation will be 10%, between the second and third buy orders the minimum deviation will be 20%, between the third and fourth buy orders the minimum deviation will be 40%...
After a sell order, the multiplier is cancelled.
Note : If value is set to 1 : Disabled
• Display help for these settings : On chart, displays help text about buying settings.
🟢 Selling settings
• Quantity (% position) : Percentage of the position to be sold in each sell order.
Example : If the first buy order is 0.1 BTC and the second buy order is 0.2 BTC, then the position is 0.3 BTC.
If Quantity (% position) is set to 20, then the first sell order will be 0.06 BTC (20% of 0.3 BTC), the second sell order will be 0.048 BTC (20% of 0.24 BTC) ...
(Auto ?) : If this option is enabled, the bot will automatically sell part of your position.
The quantity sold depends on the volatility of the last 30 days : the higher the volatility, the more it sells, and the lower the volatility, the less it sells.
The minimum sale defined is 10%, while the maximum sale will not exceed 50%.
• └> Min. deviation (%) : Minimum percentage of price deviation to trigger a sale.
Example : If Average price of BTC is 30 000 USDT and Min. deviation is 10%, then the first sell order will be at least 33 000 USDT, the second sell order will be at least 36 300 USDT ...
Note : If value is set to 0 : Disabled
(Auto ?) : If this option is activated, the bot automatically determines the sell minimum deviation percentage.
The deviation set depends on the volatility of the last 30 days : the higher the volatility, the higher the deviation, and the lower the volatility, the lower the deviation.
A start and end date defines when the script should generate buy and sell positions :
📆 Date settings
• Start date : Indicate the script launch date (If it’s a new launch, you must choose today’s date before creating your TradingView alert).
• End date : Enter the date on which you want the script to stop.
Other parameters can be configured to fine-tune buys and sells :
⏲️ Trading session settings
• Days : Allows you to select the specific days on which the script will be active, offering the possibility of excluding certain days.
🏛️ Exchange settings
• Fees (%) : Indicate the percentage fee applied by the exchange platform on each transaction.
• Price spread (%) : Specifies the price spread to be considered for realistic order adjustment.
🤖 Bot settings
• Add to Position ? : Allows tokens to be manually added to the position when the script is launched.
• └> How much ? (Base) : Number of tokens to add.
• └> Cost ? ($) : Stable coins amount of addition to position.
These settings are included in the calculation when an order is triggered.
Advanced visual customization options can be modified :
🎨 Visual settings
• TradingView Theme : Choose between a light or dark theme for the bot interface.
• Panel : Enables or disables the display of the information panel on the graph, and modifies its size and alignment.
• Positions : Show or hide buy and sell position labels on the chart, and modify their size and appearance (several display modes : basic, simple, advanced).
• Average price : Enables or disables the display of the average price line and modifies its size and color.
• Simulator : Enables or disables the ATH percentage-based simulator line and modifies its size and color.
• Trading session : Displays or hides the background of specified trading sessions.
• Hide warning messages ? : Hide or show warning messages on graph.
A profit simulator can be configured :
🕹️ Simulator settings
• Price (% ATH) : Determines a percentage of the token's ATH to simulate potential gains if the token reaches this price level again.
Users can also activate buying and selling alerts in the settings :
🤖 Bot settings
• START THE BOT ? » ALERTS ON : REAL MODE : Enable or disable the bot to execute real orders based on alerts.
• Mode FULL Auto ? : Enables the Mode FULL Auto, requiring additional configuration for connection to exchange APIs.
• └> Password FULL Auto : Password required to activate the Mode FULL Auto.
By activating FULL Auto Mode with TradingView's webhook system, the user can connect the script to the APIs of compatible exchanges, and receive notifications of buy and sell orders by e-mail, Telegram or Discord.
On the chart, a panel displays a variety of information, and also a backtesting / result of the script.
Here is a list of elements displayed by the panel :
💻 Informations panel
General :
• Pair
• Exchange
• └> Fees
• └> Price spread
• Period
• Start date
• End date
• Trading days
Buying
• Quantity per order
• └> Mult. quantity
• └> Max. quantity
• └> If Price > Average price
• └> Min. deviation
• └> Mult. deviation
• Min. delay (in days)
Selling
• Quantity (% position)
• └> Min. deviation
Exchange
• Next buy
• Next sell
Backtesting / Results
• No. of buys
• No. of sells
• Average price
• Actual position
• Actual net profit
• └> Simulator
• Last buy
• Last sell
🌌 About default settings
Default settings are defined as an example.
Above in the description, you will find details of each setting.
Here's a description of how user-defined setting categories affect the script's buy and sell positions :
📆 Date : Determines between which time ranges buy and sell positions are generated.
⏲️ Trading session : Exclude selected days disables buy positions on deselected days.
🕹️ Simulator : Does not affect buying and selling. It is for information purposes only.
🏛️ Exchange : Fees should be as close as possible to your exchange and price spread depends on your tolerance. This affects buy and sell position.
🔵 Buy : Depending on your investment capacity and risk management, these settings have an impact on buy positions.
🟢 Sell : These settings determine profit-taking. This has an impact on sell positions.
🎨 Visual : Does not affect buy and sell positions. For information only.
🤖 Bot : This part is mainly used to use the script with TradingView alerts. Only the 'Add to position' option affects buy and sell positions.
Once you've set all your settings for the script, you can view the backtesting displayed in the panel on the chart.
🌌 How to use it ?
To summarize how to use this script successfully, please follow these steps :
1. First, choose a cryptocurrency pair (e.g. BTC/USDT).
2. Set a start date (preferably today's date if it's your first launch) and an end date.
3. According on your preferences, you can choose specific trading days, or default to all days of the week.
4. Depending on your exchange, you can set fees and a price spread.
5. Then, based on your portfolio management and investment capabilities, define buy and sell parameters.
6. You can set the bot's appearance on the chart.
7. Once you have configured your settings, you can choose a simulation price.
8. Finally, to activate TradingView Alerts, check the box START THE BOT ? ALERTS ON : REAL MODE.
🌌 Overview
Here's a preview of the script with a few screenshots :
BTC/USDT • Basic display
SOL/USDT • Simple display
XRP/USDT • Advanced display
MATIC/USDT • Light theme
Script settings
🌌 Why do I have to pay ?
BotDCA uses advanced indicators and complex calculations to identify buying and selling opportunities.
With TradingView's alert system, it automates your investment strategy, eliminating the need for constant manual analysis and constant market monitoring.
This saves you precious time.
With adjustable buy and sell settings, you can customize the script to suit your risk tolerance and investment objectives.
This flexibility adds considerable value, allowing you to optimize the script to suit your situation.
Paid access ensures that you benefit from ongoing support and updates, which are essential for maintaining the script's effectiveness.
🌌 Disclaimer
This script is provided for educational purposes only and should not be construed as investment advice.
Users should be aware that trading in the financial markets involves risks, and that past performance of a script does not guarantee future results.
It is strongly recommended that you carry out a detailed analysis and consider your financial situation and risk tolerance before committing yourself to trading/investing.
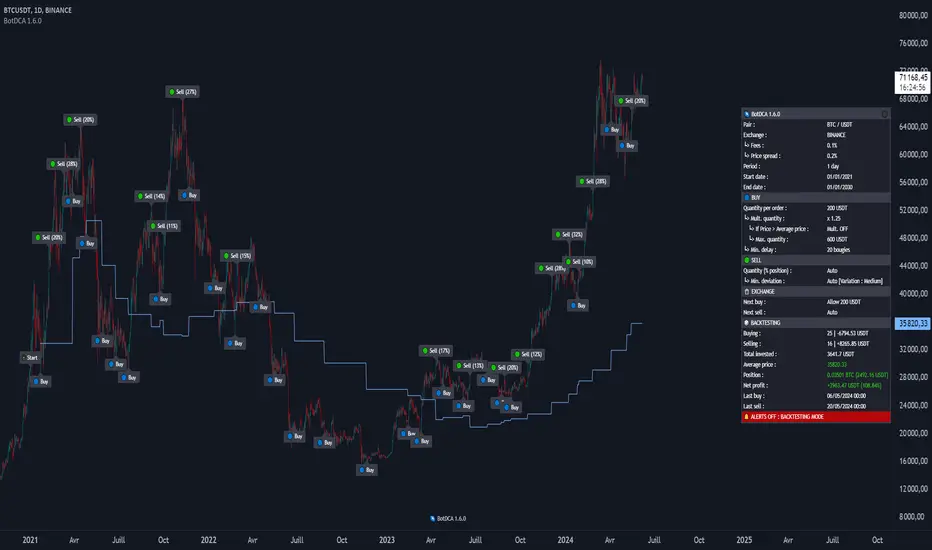
[blackcat] L5 Alchemy Gold (ALGOLD)" L5 Alchemy Gold (ALGOLD)" indicator is a trend-following indicator that blends volume and price data to create a MACD-like oscillator, aiming to address the lagging issue typical in price-only indicators. The integration of leading volume information with lagging price data is a smart approach to create more timely signals. Additionally, incorporating a volatility filter to reduce false signals during sideways markets is a thoughtful enhancement.
It is shaping up to be quite comprehensive. It includes:
- An adaptive filter for smoothing price and volume data.
- A volatility filter based on Average True Range (ATR).
- A trigger moving average for generating smoothed price information.
- An ALMA (Arnaud Legoux Moving Average) for further filtering of price and volume.
- A divergence detector to identify potential trend reversals.
Entry Criteria : A composite crossover and crossunder of the fast and slow lines of the ALGOLD oscillator.
Exit Criteria : A crossover and crossunder of the fast and slow lines of the ALGOLD oscillator, but using a lower time frame for more sensitivity.
The input parameters of " L5 Alchemy Gold (ALGOLD)" indicator, are categorized into three groups:
Group 1, Alchemy Setting:
Alchemy Sharpness (Default: 7) - Controls the sharpness of the adaptive filter.
Alchemy Period (Default: 55) - Determines the smoothness of the oscillator.
Group 2, DVATAR Setting:
DVATR Length (Default: 11) - Sets the period length for the DVATR, similar to ATR's Length.
DVATR Threshold (Default: 0.07) - Adjusts sensitivity for sideways market detection.
Smooth Length (Default: 21) - Smoothens the DVATR output, balancing with volatility detection.
Group 3, Divergence Setting:
Parameters like Pivot Lookback, Max/Min of Lookback Range - Sets the sensitivity for divergence detection.
Options to enable or disable plots for various types of divergence (Bullish, Hidden Bullish, Bearish, Hidden Bearish).
" L5 Alchemy Gold (ALGOLD)" indicator are vivid and intuitive:
Candle Bar Color :
Gradient color changes to indicate trend strength, with warmer colors for bullish and cooler colors for bearish trends.
Line Colors and Shapes :
Green color represents the fast line, red for the slow line.
Crosses of these lines signal entries (triangles) and exits (cross shapes).
A band is created between these lines, filled with green for uptrends and red for downtrends.
Histogram :
Red histogram for above 0 and uptrend.
Blue histogram for above 0 and retracement.
Green histogram for below 0 and downtrend.
Yellow histogram for below 0 and bounce-up.
YinYang MomentumOverview:
YinYang Momentum is a Price, Volume and Momentum Oscillator. Its job is to help you see swings in momentum and the strength of it. It also creates signals (Blood Diamond (Bear) and Support Cross (Bull)) where these momentum swings may occur. YinYang Momentum features 3 Price and 3 Volume 'Mountains with Ice'. There are Predictive, Regular and Confirming Mountains. You have the ability to overlay them on top of each other which helps to decipher momentum swings. The Volume Mountains are very important for showing the strength behind the Price Mountains and their Signals. If you look, you'll notice, as the 'Ice' starts to curve into the 'Mountains' it signals a potential shift in Momentum. The green Mountain is the Predictive, the Blue is the Regular and the Purple is the Confirming. You'll also notice that the Predictive Mountains movements happen first and move much more drastically. When you notice the regular starts to follow suit, there is a potential for a momentum shift. Shortly after, a signal will occur if this shift is actually happening. You can also check the Confirming Mountain for more confirmation (however, leaving the Confirming Mountain active can be a little confusing and make it harder to read signals). YinYang Momentum also features Information Tables. These tables display how the Blood Diamonds and Support Cross' are fairing on different Timeframes. This way, you'll be able to see if it's in a Bullish or Bearish state on critical Time Frames no matter what Timeframe you're trading on.
Before we move onto the tutorial, let's discuss what each of these Mountains and Ice are and how they work. All of our Mountains and Ice are calculated using the same algorithm but with varying sources, lengths and multipliers. We are essentially calculating differences in movement and then sending those differences into an EMA for the Mountain Base and SMA for the mountain Ice. The values we use for the Predictive are much lower and therefore occur much quicker as they aren’t averaged out on longer lengths/time frames; this helps to make it more of a leading Indicator which may predict momentum changes. Our Regular is over a medium length and multipliers that result in a smooth but generally also gradual movement that helps reliability; this helps it act as more of an ‘in the now’ Indication of momentum changes. Our Confirming uses lengths and multipliers that are of a higher value and longer span; this makes it more difficult to use for determining entry / exit locations as it's more of a lagging indicator, but it helps to add confirmation as to whether the momentum change has occurred and wasn't a false signal.
Tutorial:
YinYang Momentum may look like a lot is going on.. And well that’s cause there is.. But that doesn’t mean it's confusing or hard to read once you know what you’re looking for!
To make this tutorial a little easier to understand, let's turn off a few settings and dissect this indicator one thing at a time. YinYang Momentum features Price and Volume mountains. Currently in the photo above we have 2 Price Mountains and 1 Volume Mountain turned on (this is how it's set by default and how we recommend using it), however there are 3 Mountains available for both Price and Volume:
Predictive
Regular
Confirming
We are going to deactivate everything so it's the Regular Price Mountain + Ice enabled.
Now that it is just the Regular Price Mountain and Ice it is much easier to teach and understand. As you can see there are two different colors on the mountain. The dark blue is the Mountain and the light blue is the Ice.
The Ice moves before the mountain does and when the momentum happens it is larger than it (below or above). When the momentum starts to change however, the Ice curves inside of the mountain. As you can see here, where the BUY signal (red cross) is, the Ice curves into the mountain; also where the SELL signal (red circle) is, the Ice curves into the mountain. The Ice curving into the mountain is a very important leading indication that momentum is changing and the Signals (crosses and diamonds) help solidify this momentum change.
The Index levels for YinYang Momentum is a little different than most oscillators that range from 0-100. Instead YinYang Momentum’s neutral level is 0 and it ranges from -100 to 100. For these reasons, the Viable Range for Buying is -40 to -70 and the Optimal Range for Buying is -70 to -100. For Selling, the Viable Range is 40 to 70 and the Optimal Range is 70 to 100.
If you look at the example above, you can see whenever it has been in the optimal range and the signal occurred, it may potentially be an amazing time to buy or sell. However, when it is within the Viable Range it can be hit or miss. The reason for this is because we are only looking at the Regular Price Mountain and Ice. Once we turn on the Predictive Price and Regular Volume we will have a much clearer idea as to what is noise and what is a true purchase signal. Why don’t we turn on Predictive Price Mountains and Ice so you can see what we’re talking about:
So there are 2 big things that changed when we added the predictive price mountains + ice.
We can see that where the orange circle is, is just noise, it isn’t a viable buy signal.
We can see that where the red circle is, is actually a better spot to sell than the previous marked white circle slightly to the right of it.
We will explain why both above are true, but first let's explain how we were able to deduce this information.
There are 5 rules when deciphering if the signal is a true signal or just noise.
You want the predictive mountain to be decently spaced out from the regular mountain. Refer to the example above how that should look. Remember it's predictive so with parabolic movements it will get quite spaced out. If the price went up but slowly, it generally won’t be as spaced and isn’t as strong of a signal predictor.
You want the Ice to be of a decent size and to curve in on both the Predictive and Regular Mountains. Both arrows (red and white circle arrows) are pointing to Ice that does just that. The Predictive mountain is of decent size and spaced out and the Ice curves in sharply on the Predictive, before curving in sharply on the Regular and then we get both Predictive and Regular Support Cross on the Same Bar.
When you get the Signals (Predictive and Regular) the amount of bars between them matters a lot! On the same Bar is ideal, however 1-2, max 3 bars between them is acceptable. Any more than 3 bars spacing and it's too risky of a signal because that means momentum change was happening but then stopped before picking back up. This doesn’t mean it can’t be a good signal, it just means it is much more risky and we don’t recommend it.
You don’t want Signal Clustering. You can see an example of this from the picture above. Signal Clustering is where signals are back to back over and over. During this time the momentum is in a consolidation phase and easily swaps back and forth between signals. These signals are not reliable and should not be traded on. We only want to act on clear momentum based signals.
Last but certainly not least, actually, the most important! Ensure that the Mountain + Ice for both the Predictive and Regular is at the bare minimum touching (preferably inside) the Viable Range. The Optimal range is best, but most mountains don’t make it that far. Viable Range is where you will make most of your trades from. Sometimes a great signal happens with all 5 of these rules but it is only touching the Viable Range right at 40 or -40. This CAN be okay, but is also much more risky than if it was at 50 to 60 or -50 to -60.
Based on the 5 rules mentioned, take a second and look back at the photo where we initially added the Predictive Price mountains and Ice, can you decipher why the orange circle is just noise, and can you see why the red circle is a better sell location than the white circle slightly to the right of it?
Let’s bring that photo back up now and let’s discuss this:
Let's start with the orange circle:
This orange circle, without the predictive, was hard to tell if it was a good location to buy or not, but the second we turned it on we could clearly see it was just noise.
The spacing between the Predictive mountains and the Regular is almost non-existent.
There was signal clustering shortly before this signal.
Remember, there doesn’t have to be many rules broken for a signal to be either too risky or not valid at all. The safest trades are ones where it meets the requirements of all 5 rules (6 once we talk about volume, but 5 price rules).
Now, let's discuss the red circle:
This red circle, although it could have been chosen with just the regular, was much more noticeable with the predictive added on top.
It has a perfect spacing between the Predictive and the Regular all the way to the peak.
The Ice is large and both curve in very nicely towards the mountains.
The signals are within 2 bars apart from each other.
There is no signal clustering.
The Predictive is within the Viable Range and the Regular is just touching it.
For these reasons, the red circle actually would have been where you sold and not the white circle beside it.
This pretty much covers the Price Mountains, but wait! The most important Cherry on Top to your decision making process is coming next!
We have just enabled our Regular Volume Mountains and Ice (which are the black mountains + ice). As you can see, we have circled what we call the ‘Perfect Combo’. This Perfect combo is when you have all 5 Price rules met COMBINED with a high volume mountain. The Volume Mountain and Ice act as strength. They aren’t biased towards bulls or bears, they simply show strength to whatever signal is present with it.
For example, if all 5 rules are met with Price on a Blood Diamond (Bear) Signal and there is a High Volume Mountain then this is also a ‘Perfect Combo’. That Blood Diamond signal will potentially have great strength behind it. The Viable and Optimal Ranges don’t apply to volume mountains. Any volume mountain, even close to the Viable Range, is considered to be a very high mountain. High volume is when the mountain is above 0 and low volume is when it's below 0. Any signal with low volume has less of a chance of being correct, regardless of whether it abides by all 5 price rules.
You can see here that the 5 Price rules are achieved but the volume mountain is low. It is at -25. Since the 5 Price rules are right, there is still a decent amount of accuracy to this signal and the price did plummet after, but not nearly as much as it would have if the volume mountain was high with it.
We have turned our Confirming Price Mountain on here so you can get an idea of what it looks like and how it’s used. If you refer to the Support Crosses and Blood Diamonds circled in white, you’ll see that although they both received their signals on the Predictive and Regular, neither of them received it on the Confirming. This shows that these signals lost momentum shortly after. However if you look at both the red and green circles, you’ll see that they both received their confirming signals and that it helped give those signals momentum. The Confirming Price Mountain is meant to help confirm if the momentum change is still on track and the max 3 bars from the regular signal rule still applies to it. However its height within the viable and optimal range is important, just not as relevant
Before we move on to our Information Tables we want to take a second just to discuss our Volume Mountains and Ice. We haven’t had a chance yet to discuss the Predictive or Confirming Volume. When it comes to our Volume Mountains + Ice, we don’t recommend having more than 1 on at a time. The reason we have included the Predictive and Confirming is in case you find they suit your Trading Style best, not necessarily to be used the same way the Price Mountains and Ice are. The main reason for this is due to the fact that the Volume Mountains are much smaller and when overlaid on top of each other can make a confusing blur that is hard to decipher.
In this example above we have enabled both Predictive and Regular Volume just so you can understand what we are talking about. The two together can be rather confusing and actually interfere with your decision making process. For this reason, we highly recommend finding the Volume Mountain that suits your trading style best and solely sticking to that.
Our Predictive Volume Mountains and Ice may help sense volume changes before they’ve even happened. This can be very useful if your Trading Style revolves around heavy volume changes.
Our Confirming Volume Mountains and Ice are much slower and smaller, but they help show the movement of volume that has occurred already. This can be used to help see the movement of volume without fearing it may or may not happen.
Our Information Tables are there to show you valuable information on whether it is in a state of Support Cross or Blood Diamond on 6 different Time Frames at the same time. The % it shows you displays how much of a price change has occurred since that signal has happened. It is important to note, if for instance you see it is in a state of Support Cross but the % is negative, this generally means it is going to switch to Blood Diamond soon and vice versa. Therefore if you are in a trade, especially on a lower Time Frame and you are watching the 1 Day or a higher Time Frame and notice that the % is getting less and less, it may be a good time to get out.
We will conclude our Tutorial here. If you have any Questions, Concerns, Suggestions or Comments please don’t hesitate to contact us.
Settings:
1. Show Predictive to Confirmed Trendline:
The Predictive to Confirmed Trendline is very useful for seeing when the predictive (Support Cross or Blood Diamond) has hit the confirmed (It’s a strong confirmation that the trend may be shifting). This trendline also features a Moving Average which helps give you a solid marker for when the Regular / Predictive mountains cross under or over it that a momentum swing may occur. Somewhat like when the RSI crosses above/below its Moving Average it dictates momentum change, that is likewise how to interpret when it happens with the mountains and this trendline.
2. Show Price Ice and Mountains based on:
The Price Ice and Mountains are very important when it comes to deciphering signal strength. For example, When the mountains are very low (regular and predictive) and are between the 2 red line (undervalued) or even possibly below the bottom red line, and the Ice on the mountains starts to curve into the mountains and then the Predictive and Regular Support Cross occur; this is a very strong Bullish Signal. But wait, that's not all, the cherry on top is when the volume mountain (black) is ALSO high while this occurs; the Volume Mountain adds Strength to the signal. When the volume mountain is high too during this ‘Perfect Combo’ this may potentially lead to very bullish price movement occurring soon. Here is an overview of each mountain:
2.1. Predictive: Are the least reliable, but they move first and nothing will move without the predictive moving first, and getting you ready.
2.2. Regular: Are the most accurate, they don't signify strength on its own, but they sure show some momentum.
2.3. Confirming: Are slightly behind when it comes to displaying data, and therefore shouldn't be used for entry / exit, but rather to show if the trend movement has truly been confirmed or not.
When the Ice starts to curve into the Mountain, (either upward or below) it signifies possible momentum change. There are Crosses (Bull), and Diamonds (Bear) to show when they've crossed. Cross' and Diamonds balance each other out and therefore there can never be more than 1 in a row (of the same type). When the Ice and Mountain size is very large (between 40 and 70), and the predictive Ice starts to curve into its mountain, and then the predictive curves into the Regular, and the Regular Ice is curving into its Mountain, then it may have some strong weight behind that signal.\nIMPORTANT: refer to Volume tooltip below for how to increase the signal strength even more.
3. Show Volume Ice and Mountains based on:
The Volume Ice and Mountains are for giving strength to the Price's signals and Size. When there is the perfect combo (described above) AND the Volume Ice + Mountain is high, then there may be a lot of strength to that Price signals (whether it is Cross (Bull), or Diamond (Bear)).
IMPORTANT: High volume mountains, unlike Price, don't mean good or bad. Volume shows strength to the Price, and therefore if there are high Volume mountains during a Diamond (Bearish), then there may be a lot of strength to that signal and vice versa.
4. Show Information Tables:
Information tables are used to display 6 different Time Frames and whether or not each time frame is in a state of Blood Diamond (red) or Support Cross (green). They also show how much % in price has changed since the current signal happened. These are very useful for seeing how the price is fairing on different Time Frames without having to constantly change your timeframe. For instance, maybe you base your entry off the 1 day time frame but then you swing trade on the 15 minute. Well, after you’ve confirmed your entry position and are sitting on the 15 minute, you can stay on the 15 minute and see how it is fairing on the 1 day, 5 minute or whatever time frame you choose. This way you aren’t distracted from the trade at hand. All of these Time Frames can be adjusted in the Settings (GUI) to whatever resolution you wish.
5. Res1 / Res2/ Res3 / Res4 / Res5 / Res6:
These represent the different resolutions (Time Frames) being used in your information tables and can be modified to display whatever resolution works best for your trading style. By default they are:
Res1: Current Timeframe
Res2: 15 Minute
Res3: 1 Hour
Res4: 4 Hour
Res5: 1 Day
Res6: 1 Week
Backup Res (not changeable): 5 Minute (this is only used if your Current Timeframe in Res1 is a duplicate of one of the other resolutions)
HAPPY TRADING!

SOFEX High-End Indicators + BacktestingBINANCE:BTCUSDT.P BINANCE:ETHUSDT.P
Introducing the first publicly available suite of indicators for Bitcoin and Ethereum by Sofex - the High-End Indicators & Backtesting System.
🔬 Trading Philosophy
The High-End Indicators & Backtesting system offers both trend-following and mean-reversal algorithms to provide traders with a deep insight into the highly volatile cryptocurrency markets, known for their market noise and vulnerability to manipulation.
With these factors in mind, our indicators are designed to sidestep most potentially false signals. This is facilitated further by the "middle-ground" time frame (1 Hour) we use. Our focus is on the two largest cryptocurrencies: Bitcoin and Ethereum , which provide high liquidity, necessary for reliable trading.
Therefore, we recommend using our suite on these markets.
The backtesting version of the Sofex High-End Indicators includes mainly trend-following indicators. This is because our trading vision is that volatility in cryptocurrency markets is a tool that should be used carefully, and many times avoided. Furthermore, mean-reversal trading can lead to short-term profits, but we have found it less than ideal for long-term trading.
The script does not aim to make a lot of trades, or to always remain in a position and switch from long to short. Many times there is no direction and the market is in "random walk mode", and chasing trades is futile.
Based on our experience, it is preferable if traders remain neutral the majority of the time and only enter trades that can be exited in the foreseeable future. Trading just for the sake of it ultimately leads to loss in the long-run.
Expectations of performance should be realistic.
We also focus on a balanced take-profit to stop-loss ratio. In the default set-up of the script, that is a 2% : 2% (1:1) ratio. A relatively low stop loss and take profit build onto our idea that positions should be exited promptly. There are many options to edit these values, including enabling trailing take profit and stop loss. Traders can also completely turn off TP and SL levels, and rely on opposing signals to exit and enter new trades.
Extreme scenarios can happen on the cryptocurrency markets, and disabling stop-loss levels completely is not recommended. The position size should be monitored since all of it is at risk with no stop-loss.
We take pride in presenting this comprehensive suite of trading indicators, designed for both manual and automated use. Although automated use leads to increased efficiency, traders are free to incorporate any of our indicators into their own manual trading strategy.
⚙️ Indicators
By default, all indicators are enabled for both Long and Short trades.
Extreme Trend Breakouts
The Extreme Trend Breakouts indicator seeks to follow breakouts of support and resistance levels, while also accounting for the unfortunate fact that false signals can be generated on these levels. The indicator combines trend-breakout strategies with various other volatility and direction measurements. It works best in the beginning of trends.
Underpinning this indicator are renowned Perry Kaufman's Adaptive Moving Averages (PKAMA) alongside our proprietary adaptive moving averages. These dynamic indicators adjust their parameters based on recent price movements, attempting to catch trends while maintaining consistent performance in the long run.
In addition, our modification of the TTM Squeeze indicator further enhances the Extreme Trend Breakouts indicator, making it more responsive, especially during the initial stages of trends and filtering of "flat" markets.
High-Volatility Trend Follower
The High-Volatility Trend Follower indicator is based around the logic of evading market conditions where volatility is low (choppy markets) and aggressively following confirmed trends. The indicator works best during strong trends, however, it has the downside of entering trades at trend tops or bottoms.
This indicator also leverages our proprietary adaptive moving averages to identify and follow high-volatility trends effectively. Furthermore, it uses the Average Directional Index, Aroon Oscillator, ATR and a modified version of VWAP, to categorize trends into weak or strong ones. The VWAP indicator is used to identify the monetary (volume) inflow into a given trend, further helping to avoid short-term manipulations.
Low-Volatility Reversal
The Low-Volatility Reversal aims at plugging the holes that trend-following indicators ignore. It specifically looks for choppy markets. Using proven concepts such as Relative Strength Index and volume measurements, among others, this indicator finds local tops and bottoms with good accuracy. It works best in choppy markets with low to medium volatility. It has a downside that all reversals have, losing trades at the end of choppy markets and in the beginning of big trends.
This indicator, like the others, employs PKAMA in conjunction with our proprietary adaptive moving averages, and an Average PSAR indicator to seek out "sideways" markets. Furthermore, Bollinger Bands with an adaptive basis line is used, with the idea of trading against the short-term trends by looking at big deviations in price movement. The above mentioned indicators attempt to catch local tops and bottoms in markets.
Adaptive Trend Convergence
The Adaptive Trend Convergence aims at following trends while avoiding entering positions at local bottoms and tops. It does so by comparing a number of adaptive moving averages and looking for convergence among them. Adaptive filtering techniques for avoiding choppy markets are also used.
This indicator utilizes our proprietary adaptive moving averages, and an Average Price Range indicator to identify trend convergence and divergence effectively, preventing false signals during volatile market phases. It also makes use of Bollinger Bands with an adaptive moving average basis line and price-action adjusted deviation. Contrasting to the Low-Volatility Reversal condition described above, the Bollinger Bands used here attempt to follow breakouts outside of the lower and upper bands.
Double-Filtered Channel Breakouts
The Double-Filtered Channel Breakouts indicator is made out of adaptive channel-identifying indicators. The indicator then follows trends that significantly diverge from the established channels. This aims at following extreme trends, where rapid, continuous movements in either direction occur. This indicator works best in very strong trends and follows them relentlessly. However, these strong trends can end in strong reversals, and the indicator can be stopped out on the last trade.
Our Double-Filtered Channel Breakouts indicator is built on a foundation of adaptive channel indicators. We've harnessed the power of Keltner Channels and Bollinger Band Channels, with a similar approach used in the Adaptive Trend Convergence indicator. The basis and upper/lower bands of the channels do not rely on fixed deviation parameters, rather on adaptive ones, based on price action and volatility. This combination seeks to identify and follows extreme trends.
Direction Tracker
The Direction Tracker indicator is made out of a central slower, adaptive moving average that clearly recognizes global, long-term trends. Combined with direction and range indicators, among others, this indicator excels at finding the long-term trend and ignoring temporary pullbacks in the opposite direction. It works best at the beginning and middle of long and strong trends. It can fail at the end of trends and on very strong historical resistance lines (where sharp reversals are common).
Our Direction Tracker indicator integrates an adaptive SuperTrend indicator into its core, alongside our proprietary adaptive moving averages, to accurately identify and track long-term trends while mitigating temporary pullbacks. Furthermore, it uses Average True Range, ADX and other volatility indicators to attempt to catch unusual moves on the market early-on.
📟 Parameters Menu
To offer traders flexibility, our system comes with a comprehensive parameter menu:
Preset Selection : Choose between Bitcoin or Ethereum presets to tailor the indicators to your preferred cryptocurrency market.
Global Signal Direction: Set the global signal direction as Long, Short, or Both, depending on your trading strategy.
Global Sensitivity Parameter : Adjust the system's sensitivity to adapt to different trend-following conditions, particularly beneficial during higher-strength trends.
Source of Signals : Toggle individual indicators on or off according to your preference. By default, all indicators are enabled. Customize the indicators to trade Long, Short, or Both, aligning them with your desired market exposure.
Confirmation of Signals : Set the minimum number of confirmed signals on the same bar, ensuring signals are generated only when specific confirmation criteria are met. The default value is one, and it can be adjusted for both Long and Short signals.
Exit of Signals : You have options regarding Take-Profit (TP) and Stop-Loss (SL) levels. Enable TP/SL levels to exit trades at predetermined levels, or disable them to rely on direction changes for exits. Be aware that removing stop losses can introduce additional risk, and position sizing should be carefully monitored.
By enabling Trailing TP/SL, the system switches to a trailing approach, allowing you to:
- Place an initial customizable SL.
- Specify a level (%) for the Trailing SL to become active.
- When the activation level is reached, the system moves the trailing stop by a given Offset (%).
Additionally, you can enable exit at break-even, where the system places an exit order when the trail activation level is reached, accounting for fees and slippage.
Alert Messages : Define the fields for alert messages based on specific conditions. You can set up alerts to receive email, SMS, and in-app notifications. If you use webhooks for alerts, exercise caution, as these alerts can potentially execute trades without human supervision.
Backtesting : Default backtesting parameters are set to provide realistic backtesting performance:
- 0.04% Commission per trade (for both entries and exits)
- 3 ticks Slippage (highly dependent on exchange)
- Initial capital of $1000
- Order size of $1000
While the order size is equal to the initial capital, the script employs a 2% stop-loss order to limit losses and attempts to prevent risky trades from creating big losses. The order size is a set dollar value, so that the backtesting performance is linear, instead of using % of capital which may result in unrealistic backtesting performance.
Risk Disclaimer
Please be aware that backtesting results, while valuable for statistical overview, do not guarantee future performance in any way. Cryptocurrency markets are inherently volatile and risky. Always trade responsibly and do not risk more than you can afford to lose.

[Volume Profile] Signal Clean Up Analysis with Backtest (TSO) This is a full-cycle trading system indicator, which uses Volume Profile for generating signals using a custom developed algorithm, TP (Take Profit) and SL (Stop Loss) levels. There are 2 SOURCES for signals (each can be used separately or both can be used at the same time, each signal SOURCE is using Volume Profile levels to open optimal trade direction) with chained (NOTE: You can select several or ALL of the features, this is not limited to either one) signal cleanup and analysis approach with scheduling and alerting capabilities. Works with most popular timeframes: 1M, 5M, 15M, 1H, 4H, D, great for intraday trading!
NOTE: Every calculation is done on a confirmed closed candle bar state, so the indicator will never repaint!
===========================================================================
Explanation of all the Features | Configuration Guide | Indicator Settings | Signal Cleanup Analysis
---------------------------------------------------------------------------
>>> Customizable Backtesting for a specific date range, results via TradingView strategy, which includes “Deep Backtesting” for largest amounts of data on trading results.
>>> Trading Schedule with customizable trading daily time range, automatic closing/alert trades before Power Hour or right before market closes or leave it open until next day.
>>> 3 Trading Systems.
>>> Multiple Signal SOURCEs for opening trades, either SOURCE can be used or both at the same time!
>>> Static/Dynamic Stop-Loss setups (HIGHLIGHT: Stop-Loss will be moved to Entry after TP1 is taken, which minimizes risk).
>>> Single or Multiple profit targets (up to 3).
>>> Take-Profit customizable offset feature (set your Take-Profit targets slightly before everyone is expecting it!).
>>> Candle bar signal analysis (matching candle color, skip opposite structured and/or doji candle uncertain signals).
>>> Additional analysis of VWAP/EMA/ATR/EWO (Elliot Wave Oscillator)/Divergence MACD+RSI/Volume signal confirmation (clean up your chart with indicator showing only the best potential signals!).
>>> Advanced Alerts setup, which can be potentially setup with a trading bot over TradingView Webhook (NOTE: This will require advanced programming knowledge).
===========================================================================
Labels, plots, colors explanations:
---------------------------------------------------------------------------
>>>>> Signal SOURCE(s): Green/Red arrows, which will be shown unconditionally, outside of trade engine and can be hidden if desired.
>>>>> LONG open: green "house" looking arrow below candle bar.
>>>>> SHORT open: red "house" looking arrow above candle bar.
>>>>> LONG/SHORT take-profit target: green/red circles (multi-profit > TP2/3/4/5 smaller circles).
>>>>> LONG/SHORT take-profit hits: green/red diamonds.
>>>>> LONG/SHORT stop-loss target: green/red + crosses.
>>>>> LONG/SHORT stop-loss hits: green/red X-crosses.
>>>>> LONG/SHORT EOD close (profitable trade): green/red squares.
>>>>> LONG/SHORT EOD close (loss trade): green/red PLUS(+)-crosses.
===========================================================================
Date Range and Trading Schedule Settings
---------------------------------------------------------------------------
>>>>> Date Range: Select your start and/or end dates (uncheck “End” for indicator to show results up to the very moment and to use for LIVE trading) for backtesting results, if not using backtesting – uncheck “Start”/“End” to turn it off.
>>>>> Use TradingView “Strategy Tester” to see backtesting results
NOTE: If Strategy Tester does not show any results with Date Ranged fully unchecked, there may be an issue where a script opens a trade, but there is not enough TradingView power to set the Take-Profit and Stop-Loss and somehow an open trade gets stuck and never closes, so there are “no trades present”. In such case you will need to manually check “Start”/“End” dates or use “Depp Backtesting” feature!
>>>>> Trading Schedule: This is where you can setup Intraday Session or any custom session schedule you wish. Turn it ON. Select trading hours. Select EOD (End of Day) setting (NOTE: If it will be OFF, the indicator will assume you are holding your position open until next day!).
>>> Trading Systems: 1) "Open Until Closed by TP or SL": the signal will only open a trade if no trades are currently open/trunning, a trade can only be closed by Take Profit, Stop Loss or End of Day close (if turned on) | 2) "Open Until Closed by TP or SL + OCA": Same as 1), but if there is an opposite signal to the trade which is currently open > it will immediately be closed with new trade open or End of Day close (if turned on) | 3) "OCA (no TP or SL)": There are is Take Profit or Stop Loss, only an opposite signal will close current trade and open an opposite one or End of Day close (if turned on)
>>>>> MULTIPROFIT | TP (Take-Profit) System: Once the trade is open, all Take-Profit target(s) are immediately calculated and set for the trade > once the target(s) is hit > trade will be partially closed (if candle bar closes beyond several Take-Profit targets > trade will be reduced accordingly to the amount of how many Take-Profit targets were hit)
>>>>> MULTIPROFIT | SL (Stop-Loss) System: 1) Static – Once the trade is open, Stop-Loss is calculated and set for the remaining of the trade ||| 2) Dynamic – At trade open, Stop-Loss is calculated and set the same way, however once 1st Take-Profit is taken > Stop-Loss is moved to Entry, reducing the risk.
>>>>> # of TPs (number of take profit targets): Just like it is named, this is where you select the number of Take-Profit targets for your trading system (NOTE: If "OCA (no TP or SL)" Trading System is selected, this setting won’t do anything, since there are no TP or SLs for that system).
>>>>> TP(s) offset: This is a special feature for all Take-Profit targets, where you can turn on a customizable offset, so that if the price is almost hitting the Take-Profit target, but never actually touches it > you will capture it. This is good to use with HHLL (Highest High Lowest Low), which is pretty much a Support/Resistance as often the price will nearly touch these strong areas and turn around…
===========================================================================
Take-Profit and Stop-Loss visual example:
---------------------------------------------------------------------------
1) A simply nice intraday trading day for SPY (S&P500 ETF TRUST) with a single Take-Profit target on each trade.
See how Take-Profit distances increase with price momentum and how Stop-Loss is following the trade reducing the risk!
2) Same intraday trading day for SPY (S&P500 ETF TRUST) with 3 Take-Profit targets with static Stop-Loss.
3) Same intraday trading day for SPY (S&P500 ETF TRUST) with 3 Take-Profit targets with dynamic Stop-Loss.
You can see how Stop-Loss was moved once TP1 is taken!
===========================================================================
Trade Analysis and Cleanup Settings
---------------------------------------------------------------------------
>>>>> Candle Analysis | Candle Color signal confirmation: If closed candle bar color does not match the signal direction > no trade will be open.
>>>>> Candle Analysis | Skip opposite candle signals: If closed candle bar color will match the signal direction, but candle structure will be opposite (for example: bearish green hammer, long high stick on top of a small green square) > no trade will be open.
>>>>> Candle Analysis | Skip doji candle signals: If closed candle bar will be the uncertain doji > no trade will be open.
>>>>> Divergence/Oscillator Analysis | EWO (Elliot Wave Oscillator) signal confirmation: LONG will only be open if at signal, EWO is green or will be at bullish slope (you can select which setting you desire), SHORT if EWO is red or will be at bearish slope.
>>>>> Divergence/Oscillator Analysis | VWAP signal confirmation: LONG will only be open if at signal, the price will be above VWAP, SHORT if below.
>>>>> Divergence/Oscillator Analysis | Moving Average signal confirmation: LONG will only be open if at signal, the price will be above selected Moving Average, SHORT if below.
>>>>> Divergence/Oscillator Analysis | ATR signal confirmation: LONG will only be open if at signal, the price will be above ATR, SHORT if below.
>>>>> Divergence/Oscillator Analysis | RSI + MACD signal confirmation: LONG will only be open if at signal, RSI + MACD will be bullish, SHORT if RSI + MACD will be bearish.
>>>>> Volume signal confirmation: LONG/SHORT will only be open if closing candle volume is 150% above average Volume based on the Volume Length.
===========================================================================
Alert Settings (you don’t have to touch this section unless you will be using TradingView alerts through a Webhook to use with trading bot)
---------------------------------------------------------------------------
Here is how a LONG OPEN alert looks like (each label is customizable + I can add up more items/labels if needed):
COIN: BTCUSD
TIMEFRAME: 15M
LONG: OPEN
ENTRY: 20000
TP1: 20500
TP2: 21000
TP3: 21500
SL: 19000
Leverage: 0
===========================================================================
Adding Alerts in TradngView
---------------------------------------------------------------------------
-Right-click anywhere on the TradingView chart
-Click on Add alert
-Condition: Select this indicator by it’s name
-Alert name: Whatever you want
-Hit “Create”
-Note: If you change ANY Settings within the indicator – you must DELETE the current alert and create a new one per steps above, otherwise it will continue triggering alerts per old Settings!
===========================================================================
If you have any questions or issues with the indicator, please message me directly via TradingView.
---------------------------------------------------------------------------
Good Luck! (NOTE: Trading is very risky, past performance is not necessarily indicative of future results, so please trade responsibly!)

METRIC-TREND-TRADERThis script is a Fully Automated trading script meant to be used with "Oanda" broker and the plug-ins for algorithmic trading automation.( FOREX ONLY)
This script is meant to capture "TREND FOLLOWING " for intraday charts (1hour) preferably and will hold for days / weeks .trading on forex markets.
(The combination of indicators includes a short high and low price channel and a longer term high and low price channel)
This script is original in description as being automated to try and capture dynamic trending markets with both long and short fractal price channels. although trend trading is not an original concept. trend trading with this dynamic indicator allows the user visualize both short term and longer term price action at the same time, helping to make better trading decisions. the channels are designed to buy breakouts in the direction of the longer term trend while trailing stop a built-in stop loss that allows normal market movement while attempting to lock in flexible profits.
The concept of this indicator is be able to quickly visualize trends by high lighting the large green areas beneath price "when trending long" which is the difference between the (user defined) short term lows and the (user defined) Long period price lows.
For "down trending" markets a large red area above price will be displayed and this is the difference between the (user defined) short term highs and the (user defined) long term highs.
This strategy uses a lower than reward profile to jump in direction of market moves for continuation,
(1 risk to 4 reward)
in the likelihood the instrument will continue (example) 200 pips before it reverts 50 pips in the counter direction.
This strategy should only be used in markets that you believe are "TRENDING" at the time of trading otherwise you risk trend trading a range market.
This script uses a (user defined period) of short term high and low price ( green/red color) and (user defined period) Long Term high and low price (green/red) chosen in the indicator settings menu.
The default parameters are 10 with a (minimum of 1 and maximum of 10000) for the short term channel and 50 with a (minimum of 1 and maximum of 10000) for the long term price channel , the default parameters = roughly 2 days "long term" and 10 hours "short term" of price action on the (1 hour) chart.
Strategy entries and exits , for Long trades the trade will be entered if the short term high crosses above the Long Term high and the Short term low is not equal to the Long term low . the trade will exit if profit or stop loss are hit or if the Short term low crosses under the long term low.
For Short trades the trade will enter short if , the short term low crosses under the long term low and the short term high is not equal to the long term high. the trade will exit if profit or stop loss are hit or the short term high crosses over the long term high
"The default parameters should be kept unless you fully understand the complete strategy"
There are two very important inputs to be selected at the user setting menu "Long Only " and "Short Only" if you are looking to place long trades only select "Long Only" or for short trades select " Short Only" it is not recommended to keep both selected as it will trade both sides!
When the trade is entered a red , a blue and green horizontal dotted line will appear on the chart.
the blue line is the strategy entry price , the red line is the stop loss price , and the green line is the take profit price . the colors will invert if the trade is long or short.
(Setting alerts should be done in the indicator settings menu, and the parameters you chose will determine the stop loss/target and the amount of "units = (position size)" you wish to trade for the (forex only) markets. using "alert() function calls only" is the only alert that should be used with this strategy.
(note : when "alert() function calls only" is set two messages will be sent, one closing any open position in the opposite direction and one placing the new order regardless if you are currently in a trade or not)
Trade targets , stoploss and trade position size are a user defined variables entered in the indicator settings menu. (target pips minimum 0 and a maximum of 1000)(stop pips minimum of 0 and maximum of 1000)
Back test date range is included in the script for back testing different data periods.
the back ground will be colored a transparent navy blue if the period you are looking trading is with in the date range( note: to place live trades the end date will need to be in the future)
this is also adjustable in the settings menu
The avoid spread filter is a user defined time in which the spread is typically higher than average, applying this filter avoids trades in the specified time. When this filter is applied there will be a transparent red back ground color in the specified time.
Back test default setting are equivocal to OANDA:USDJPY
at the time of this publication placing trades with the "Oanda" broker are as follows , USD units = 2000 equal 2000 USD position size . "Oanda" current leverage is 20 to 1 for this particular pair and commission is paid in spread (1.4) pips = 0.19 USD per trade , Margin required for the trade is 100.0 USD , Position sizing = 10% of a 1000 USD account.
OANDA:USDJPY

BE - Volume Scalping ProDear Traders,
Here with presenting the new Indicator (Strategy) for scalping which is primarily built based on the the Volume Analysis.
Idea behind this Indicator: I am sure every trader would agree that Volume is one of the Leading indicator along with Price, and hence thought to use the same for scalping the trades. There is a direct co-relation between the price and volume and thereby used this as a base for arriving at strength of the volume pumped in. Indicator is working on the Logic of "What is the ROC in price for the volume dumped in and does ROC quantify the same which is happened in the recent past of x candles." In order to be successful in scalping trade, Accuracy, Risk to reward and Money Management is very much crucial and hence thought so much on this to make it happen.
Note: Accuracy here being profitable in the trade and not hitting the bulls eye all the time.
What this indicator is providing:
Based on the volume, ROC & Candle Thresholds and using the inputs provided for RISK and Money Management options, Indicator continuously scans for trading opportunities and provides alerts for possible trades.
Alerts & Notifications:
There are basically 3 types of Alerts provided one with General Notification and Other with Dhan HQ notifications to support Algo Trades and AlgoJi for supporting Algo trades too.
Self Declaration:
I have been testing the performance in 30 seconds and 1 min chart and I haven't faced any issues yet. I strongly recommend users to use the same in timeframe less than 10 Min only.
Enjoy!
DISCLAIMER: No sharing, copying, reselling, modifying, or any other forms of use are authorized for our documents, script / strategy, and the information published with them. This informational planning script / strategy is strictly for individual use and educational purposes only. This is not financial or investment advice. Investments are always made at your own risk and are based on your personal judgement. I am not responsible for any losses you may incur. Please invest wisely.
Happy to receive suggestions and feedback in order to improve the performance of the indicator better.

Ratings AlgoThe ratings algo is my discount version of the many paid-for algorithms put out by numerous different companies. A technical "rating" (by default between -10 and 10) is produced for each candle, telling the user when to buy, sell, or hold. I took 11 of my personal favorite indicators to develop a rating system. They are:
50/200 SMA crossover
10/20 SMA crossover
10/20 LSMA crossover
10/20 EMA crossover
"Arnold" a rate-of-change analysis of a smoothed LSMA
PVT and OBV momentum
MACD
RSI
DMI
Fisher Transform
The ratings system is very basic (a more complex, detailed version will be coming in the future!) where each indicator returns -1, 0, or 1, and the MAs and Oscillators are stratified with a user-defined weighting. The total calculation is based on the function:
maweight * (average of MA ratings) + oscillator weight * (average of osc ratings)
If the total value > user-defined threshold, the bar is teal, and if > 2.5 * threshold, is green, and vice versa for orange/red respectively. Purple is given if the total value is close to zero.
"Strong" signals are printed if the bar changes to either green or red and exits are printed if the bars change from green/red to any other color.
A table is also produced showing what each indicator is indicating, either "Buy" "Sell" or "Hold.
Reversal Bands are printed, intended to be used as areas where a trade might be exited if the market is sideways. If a Strong Buy signal is produced, it may be a good idea to enter the trade, and hold until the price enters the reversal bands, then hold until a candle closes outside the band for the first time.
This indicator truly shines in trending markets (like most indicators), but with very fast-acting exit signals and reversal zones, will facilitate minimal losses and possibly even profits in sideways markets.

Bot go_up DD_long/shortHello!
This strategy is based on the double bottom pattern - for entering a long position / double top-short
A double bottom pattern is formed when two price bottoms are relatively at the same level and the top acts as resistance. This pattern appears at the end of a downtrend and signals a reversal.
A double top is a bearish reversal pattern that signals the end of an uptrend. It is formed by two price highs forming at the same level and a notch line that acts as local support.
As history and practice show, the double bottom pattern works better. Moreover, in a bull market.
You can include only long or only short. BUT while there is a long, a short position will not be opened, in fact, with a long as well.
You can use reverse trade, one coin at a time.
DESCRIPTION:
// LOGIC ENTRY:
Period for short and long positions-to search for double bottom as well as double top. the more, the less false.
Change liong and short-channel width for pattern search separately for long and short.
General shift-the overall width of the channel, which changes equally at once for long and short
By default, quiet settings for tf 5 minutes are applied!
You can choose the settings you like.
// AMOUNT(USDT) FIRST ORDER AND > % NEXT
In the first column, indicate the amount, in the second, how many percent the next order will be more than the previous one.
// EXIT SETTINGS
Closing a trade by RSI when it reaches the level specified in the settings (but in the negative, the trade will never be closed, even if the condition is triggered)
Using a percentage to exit a trade + stop loss. (Put a stop order 1000+ on the market can be anything, especially if you use spot trading)
PS: in order to use the RSI output at a certain level, put a checkmark on the desired one, and also check the percentage box and indicate a take on the percentage 10-20 +)
// MARTINGALE GRID
If there is a check mark, then the grid is used.
Use all signals?
If yes, then there will be no limit on inputs from logic
If the checkbox is not checked, then you can limit the entries from the strategy logic by the specified percentage.
Grid, the next order, when decreasing by a certain percentage, an order when decreasing by the percentage that will be specified (after entering from the logic, when the next signal appears, the grid will be counted from the beginning)
PS: orders are not automatically placed, if the conditions are triggered, then the entry is only at the next bar (within the TV, it is not possible to add orders immediately, but most often, in case of straits, for the better)
// FILTER SETTINGS
The filter consists of a series of popular, averaged oscillators
//DATA RANGE
You can see the results for the selected period
//
CALCULATION OF ORDERS AND MARGIN (FOR INFO ONLY)
The number of orders is the number of entries (you must always have the same number of orders in the arguments and in the properties !!)
- in the aruments for understanding, in the properties - it does not matter how much it will cost there, so many inputs will be!)
-leverage is created to calculate the margin
When you change these parameters, you will understand how much money is required in general and what maximum drawdown can be allowed
Green line-take, lower-stop-order.
To use algo trading, in fact, you need to use a script, in the service through which you will transmit a signal through webhooks, you need to select the amount.
{{strategy.order.contracts}}
ОПИСАНИЕ НА РУССКОМ
//ЛОГИКА ВХОДА:
Период для шорт и лонг позиций, сдвиг для шорта лонга, также общий
По умолчанию применены спокойные настройки для тф. 5 минут.
Вы можете самостоятельно подбирать настройки, основываясь на прошлые результаты
//СУММА ВХОДА В ЮЗДТ +МАРТИНГЕЙЛ:
В первой графе указываете сумму , во второй -на сколько процентов следующий ордер будет больше предыдущего.
//НАСТРОЙКИ ВЫХОДА ИЗ СДЕЛКИ
Закрытие сделки по RSI, когда достигнет уровня, указанного в настройках ( но в минус сделка не будет закрыта никогда, даже если условие сработало)
Использование процента для выхода из сделки+ стоп приказ.( Ставьте стоп-приказ 1000+ на рынке может быть всякое, тем более, если используете спотовую торговлю)
ПС: для того, чтобы использовать выход по RSI по определенному уровню, поставьте галочку на нужный , а также поставьте галочку по проценту и укажите тейк по проценту 10-20+)
//НАСТРОЙКИ СЕТКИ
Если стоит галочка-то сетка используется.
Использовать все сигналы?
Если да, то лимита по входам от логики не будет
Если не стоит галочка, то можно ограничить входы от логики стратегии, на указанный процент.
Сетка, следующий ордер, при снижении на определенный процент-след ордер при снижении на тот процент, который будет указан ( после входа от логики , при появлении следующего сигнала сетка будет считаться с начала)
ПС: ордера автоматически не ставятся, если сработали условия, то вход, только на следующем баре ( в рамках ТВ, нет возможности добавить сразу ордера, но чаще всего, при проливах-к лучшему)
//НАСТРОЙКИ ФИЛЬТРА
Фильтр состоит из серии популярных, усредненных осцилляторов.
//
БЭКТЕСТИНГ
Можете посмотреть результаты за выбранный промежуток
//
ПИРАМИДИНГ (исключительно для расчета)
Количество ордеров-это количество входов ( у вас всегда должно быть одинаковое количество ордеров в агрументах и в свойствах!!)
-в аргументах для понимания, в свойствах -важно, сколько там будет стоить-столько входов и будет!)
-плечо создано для расчета маржи
При изменение данных параметров Вы будете понимать сколько потребуется средств в общем и какую максимальную просадку можно допустить
Зеленая линия-тейк, нижняя-стоп-приказ.
Для использования алго-трейдинга, собственно так и нужно использовать скрипт, в сервисе, через который Вы будете передавать сигнал через веб-хуки , Вам нужно выбрать количество.
{{strategy.order.contracts}}
Удачных трейдов, друзья!

MechaAlgoWhat is MechaAlgo?
MechaAlgo was created to assist any type of trader on a day to day basis. Our intelligent and accurate algorithms turn complex charts into profitable plays, minimizing losses and maximizing profits. We hope that you will find use in the tools and resources we provide, and we will continue to improve on our products in order to take your trading to new heights!
Any Time, Any Market
Our indicators work with real time data on any market. This means that any kind of trader will find our tools useful, regardless of what you are trading.
Feature List
Multiple Signal Modes
Numerous Candle Coloring Modes
Reversal Cloud Overlay
Auto Support & Resistance
Auto Trendlines
Auto Profit Targets
Real Time Informational Dashboard
Multi-Timeframe Trend Panel
Future Trend Projection
Many More Features to Come!
By using this script you acknowledge that MechaAlgo cannot guarantee you profit, and that this product was only created in attempt to benefit traders. You also acknowledge that past performance is not indicative of future results, and that the experience of other users or what you see online may not always be your experience.
SignalCAVE Strategy BuilderYou can create strategies without writing single line of Pine Script code!
Do backtesting, set alerts and explore algorithmic trading with using SignalCAVE Strategy Builder on TradingView.
SignalCAVE Strategy Builder for TradingView
SignalCAVE is a tool that help you to create strategies in TradingView. SignalCAVE offers flexible strategy builder panel enabling users to backtest and set alerts with custom conditions (selected indicators and parameters).
CAPABILITIES
You can define rules and conditions for “Long” and “Short” signals.
“Stop Loss” or “Take Profit” functions can be activated with providing percentage values.
“Only Long”, “Only Short” or both “Long and Short” signals can be used at the same time.
Available Indicators
EMA, SMA, WMA, HMA, RSI, MACD, Stochastic, Bollinger Bands, SuperTrend, Parabolic SAR, DMI, ATR, CCI, CMF, ROC, Ichimoku, OHLC Prices
How to Set Strategy Rules?
On SignalCAVE strategy settings screen, there are four types of input groups. You can populate these input boxes based on your strategy.
A: First indicator’s parameter and index value selection area
First Input: First indicator selection.
Second Input: First indicator’s parameter selection. If you want to use default parameters, select “Default Parameters”. If you want to use custom parameters, select “Custom Parameters”. If your selection was custom, then you need to fill “P:A” input boxes to assign your custom parameter.
Third Input: First indicator’s index selection. Default parameter is “0”, If you want to get previous value of indicator/price, you can type positive numbers.
?: Condition and Interval selection area.
You can select “Upper (>), Lower (<), Upper or Equal (>=), Lower or Equal (<=), CrossOver (⬆), CrossUnder (⬇)” conditions and time frame interval for calculation both first (A:) and second (B:) indicator.
B: Second indicator’s parameter and index value selection area
First Input: Second indicator selection.
Second Input: Second indicator’s parameter selection. You may use either default parameters, or custom parameters. If your selection was custom, then you need to fill “P:B” input boxes to assign your custom parameter.
Third Input: Second indicator’s index selection. Default parameter is “0”, If you want to get previous values of indicator/price, you can type positive numbers.
P:A First indicator’s custom parameter settings. If selected indicator has less then four parameters, you can fill unnecessary fields with “0” value.
P:B Second indicator’s custom parameter settings. If selected indicator has less then four parameters, you can fill unnecessary fields with “0” value.
DASHBOARD
After you build the strategy with SignalCAVE, you can see rules and conditions on dashboard with chart view screen.
Hint: By adding multiple times of SignalCAVE strategy on your chart screen, you can build more then one strategy.
STRATEGY TESTER / BACKTEST RESULTS
You can see strategy backtest results from “Strategy Tester” panel.
By changing parameters or strategy rules (strategy optimization), you may get better results. These results does not guarantee a success for future trades.
ALERT SETTINGS
If you want to get notify about your strategy outputs (Long Entry, Long Exit, Short Entry, Short Exit, Stop, Take Profit) you can set an “Alert”.
You can click “Alert” button to create a new alert. Make sure on “Conditions” selection must be “SignalCAVE” strategy.
Paste to “Message” field exactly the text below.
{{strategy.order.alert_message}}
Hint: By setting a single alarm, you can get notifications for all outputs.
Do your alerts modifies when you change the strategy conditions or parameters?
While the strategy got updated, its alerts still use the strategy’s state from the time when we made the alert (TradingView Wiki, 2018b).
This has the advantage that, once we made a script alert, we can change the script’s input options, change chart settings, or remove the script from to the chart. All of that won’t affect our existing alert. That gives a lot of flexibility to keep interacting with the chart and script.
But there’s also a disadvantage: if we do want our script’s alerts to change, we first need to remove the existing alerts. Then we have to create and configure new alerts based on the indicator’s updated code or settings.

Jaws Mean Reversion [Strategy]This very simple strategy is an implementation of PJ Sutherlands' Jaws Mean reversion algorithm. It simply buys when a small moving average period (e.g. 2) is below
a longer moving average period (e.g. 5) by a certain percentage and closes when the small period average crosses over the longer moving average.
If you are going to use this, you may wish to apply this to a range of investment assets using a screener for setups, as the amount signals are low. Alternatively, you may wish to tweak the settings to provide more signals.
Context can be found here:
LINK

High Low Reversal This bot makes use of an algorithm which detects new highs and lows. When doing long trades, the bot will trigger a buy order on a newly made low. When making shorts, the bot will trigger a short trade on new highs.
Currently, the bot is optimized for cryptocurrencies on the M15 time frame. With the right amount of leverage and portfolio optimization this bot can obtain very strong results.
Feel free to optimize it to your own liking on different assets and/or time frames.
This bot performs exceptionally well in trending markets. Currently, it's only making long trades, but you can make it do short trades in the control panel.
The settings of the back test as follows:
starting capital = 100k
leverage = 1
commission = 0.2%
Equity per trade = 50%. Since the bot only makes one trade at a time you can allow it to use a bigger portion of your balance per trade.
I've also made a study-script for easy implementation on the exchange. You get that script once you get access to this bot.

MM DonBased on the nnfx trading style this algorithms has many different calculations to provide the best signal and confirmations
1. The SuperSmooth Forecast Moving Average
2. TrendLine Moving Average
3. Smoothed Heiken Ashi Moving Average
4. Baseline that can change between 15 different moving averages
Buy/Sell Alarms for all the moving averages
Exit buy/sell Alarms
Entry
3 TP
ATR x1.5 Stop Loss auto generated per signal.
Also be able to set tp alarms for both buy/sell entries. so you place your trade and be alerted when your take profits have been hit.
works on all timeframes for scalpers, intraday, or even swing.
effective on binary as well.
Directions are simple
combine simple Market Structure & as long as everything matches (Buy Signal & everything is blue + baseline is white) (Sell Signal & everything is Red + Baseline is Red) you can enter the signal generated, exit the trade when told to exit and Manage your trade.
this was made to make trading easy and create confidence with in the trader.
Link below or PM us for access to this indicator Happy Trading
