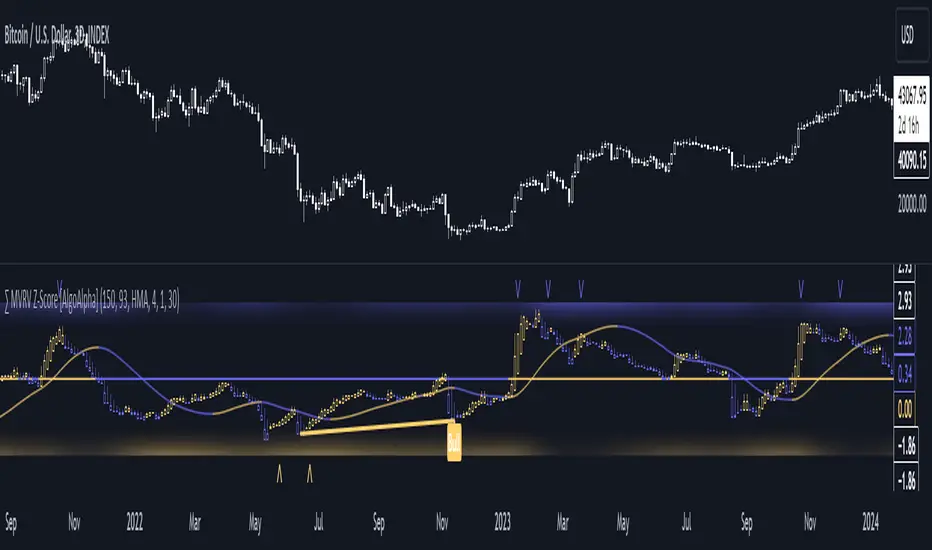
MVRV Z-Score [AlgoAlpha]Introducing the ∑ MVRV Z-Score by AlgoAlpha, a dynamic and sophisticated tool designed for traders seeking to gain an edge in INDEX:BTCUSD analysis. This script employs advanced statistical techniques on Bitcoin On-Chain data to offer a deeper understanding of market conditions, focusing on valuation extremes and momentum trends. Let's explore the features and functionalities that make this tool a valuable addition to your trading arsenal.
Key Features:
🔶 Adjustable Parameters: Customize the Z score lookback length, moving average lookback length, and choose from six moving average types, tailoring the analysis to your trading style.
🔶 Heiken Ashi Compatibility: Incorporate Heiken Ashi plots to visualize market trends, adding a layer of clarity to your technical analysis.
🔶 Divergence Alerts: Detect significant bullish and bearish divergences, allowing for timely identification of potential market reversals.
🔶 Configurable Alerts: Set alerts for overbought, oversold, and divergence conditions, ensuring you never miss an opportunity.
How to Use:
1. ➡️ Parameter Selection: Start by configuring the Z-Score and moving average settings according to your analysis needs. This includes selecting the lookback period and the type of moving average.
2. ➡️ Visualization Options: Choose to enable Heiken Ashi plots for an alternative view of the Z-Score, which can help in identifying trend directions more clearly.
3. ➡️ Monitor for Signals: Keep an eye out for divergence signals and overbought/oversold conditions as potential indicators for entering or exiting trades.
4. ➡️ Alert Setup: Configure alerts based on your selected parameters to receive notifications for important market movements and conditions.
How It Works:
The core of this tool is the Z-Score calculation, which assesses the standard deviation of the current market value from its mean, highlighting overvalued or undervalued market conditions. Here's a brief overview of the script's operational mechanics:
1. 📊 Calculating the Z-Score: The script first calculates the mean over a user-defined lookback period of the MVRV ratio, then it computes the Z-Score to identify deviations from the average.
meanValue = ta.sma(marketValue, zScoreLookback)
zScoreValue = (marketValue - meanValue) / ta.stdev(marketValue, zScoreLookback)
2. 📈 Applying a Moving Average: To smooth the Z-Score data and make trends more discernible, a moving average is applied. Users can choose from several types, such as SMA, EMA, or HMA, based on their preference.
3. 🔄 Heiken Ashi Visualization: For those opting for a more intuitive trend analysis, Heiken Ashi plots can be enabled, transforming the Z-Score data into candlestick charts that simplify trend identification.
4. 🔍 Identifying Divergences: The script is equipped to spot divergences between the market price action and the Z-Score, signaling potential bullish or bearish market reversals.
oscHigherLow = haClose > ta.valuewhen(findPivotLow, haClose , 1) and isInRange(findPivotLow )
priceLowerLow = low < ta.valuewhen(findPivotLow, low , 1)
bullishCondition = enablePlotBullish and priceLowerLow and oscHigherLow and findPivotLow
5. 🚨 Configurable Alerts: Lastly, the script allows for the setting of customizable alerts based on the Z-Score, moving averages, and identified divergences, enabling traders to react promptly to market changes.
The ∑ MVRV Z-Score by AlgoAlpha is an essential tool for traders looking to analyze and interpret market dynamics through a quantitatively rigorous lens. Whether you're focused on identifying market extremes or tracking trend momentum, this script offers the insights needed to support informed trading decisions. 🌟📊💡
Cerca negli script per "algo"
Volume-Trend Sentiment (VTS) [AlgoAlpha]Introducing the Volume-Trend Sentiment by AlgoAlpha, a unique tool designed for traders who seek a deeper understanding of market sentiment through volume analysis. This innovative indicator offers a comprehensive view of market dynamics, blending volume trends with price action to provide an insightful perspective on market sentiment. 🚀📊
Key Features:
1. 🌟 Dual Trend Analysis: This indicator combines the concepts of price movement and volume, offering a multi-dimensional view of market sentiment. By analyzing the relationship between the closing and opening prices relative to volume, it provides a nuanced understanding of market dynamics.
2. 🎨 Customizable Settings: Flexibility is at the core of this indicator. Users can adjust various parameters such as the length of the volume trend, standard deviation, and SMA length, ensuring a tailored experience to match individual trading strategies.
3. 🌈 Visual Appeal: With options to display noise, the main plot, and background colors, the indicator is not only informative but also visually engaging. Users can choose their preferred colors for up and down movements, making the analysis more intuitive.
4. ⚠️ Alerts for Key Movements: Stay ahead of market changes with built-in alert conditions. These alerts notify traders when the Volume-Trend Sentiment crosses above or below the midline, signaling potential shifts in market momentum.
How It Works:
The core of the indicator is the calculation of the Volume-Trend Sentiment (VTS). It is computed by subtracting a double-smoothed Exponential Moving Average (EMA) of the price-volume ratio from a single EMA of the same ratio. This method highlights the trend in volume relative to price changes.
volumeTrend = ta.ema((close - open) / volume, volumeTrendLength) - ta.ema(ta.ema((close - open) / volume, volumeTrendLength), volumeTrendLength)
To manage volatility and noise in the volume trend, the indicator employs a standard deviation calculation and a Simple Moving Average (SMA). This smoothing process helps in identifying the true underlying trend by filtering out extreme fluctuations.
standardDeviation = ta.stdev(volumeTrend, standardDeviationLength) * 1
smoothedVolumeTrend = ta.sma(volumeTrend / (standardDeviation + standardDeviation), smaLength)
A unique feature is the dynamic background color, which changes based on the sentiment level. This visual cue instantly communicates the market's bullish or bearish sentiment, enhancing the decision-making process.
getColor(volumeTrendValue) =>
sentimentLevel = math.abs(volumeTrendValue * 10)
baseTransparency = 60 // Base transparency level
colorTransparency = math.max(90 - sentimentLevel * 5, baseTransparency)
volumeTrendValue > 0 ? color.new(upColor, colorTransparency) : color.new(downColor, colorTransparency)
bgcolor(showBackgroundColor ? getColor(smoothedVolumeTrend) : na)
In summary, the Volume-Trend Sentiment by AlgoAlpha is a comprehensive tool that enhances market analysis through a unique blend of volume and price trends. Whether you're a seasoned trader or just starting out, this indicator offers valuable insights into market sentiment and helps in making informed trading decisions. 📈📉🔍🌐

Volume Exhaustion [AlgoAlpha]Introducing the Volume Exhaustion by AlgoAlpha, is an innovative tool that aims to identify potential exhaustion or peaks in trading volume , which can be a key indicator for reversals or continuations in market trends 🔶.
Key Features:
Signal Plotting : A special feature is the plotting of 'Release' signals, marked by orange diamonds, indicating points where the exhaustion index crosses under its previous value and is above a certain boundary. This could signify critical market points 🚨.
Calculation Length Customization : Users can adjust the calculation and Signal lengths to suit their trading style, allowing for flexibility in analysis over different time periods. ☝️
len = input(50, "Calculation Length")
len2 = input(8, "Signal Length")
Visual Appeal : The script offers customizable colors (col for the indicator and col1 for the background) enhancing the visual clarity and user experience 💡.
col = input.color(color.white, "Indicator Color")
col1 = input.color(color.gray, "Background Color")
Advanced Volume Processing : At its core, the script utilizes a combination of Hull Moving Average (HMA) and Exponential Moving Average (EMA) applied to the volume data. This sophisticated approach helps in smoothing out the volume data and reducing lag.
sv = ta.hma(volume, len)
ssv = ta.hma(sv, len)
Volume Exhaustion Detection : The script calculates the difference between the volume and its smoothed version, normalizing this value to create an exhaustion index (fff). Positive values of this index suggest potential volume exhaustion.
f = sv-ssv
ff = (f) / (ta.ema(ta.highest(f, len) - ta.lowest(f, len), len)) * 100
fff = ff > 0 ? ff : 0
Boundary and Zero Line : The script includes a boundary line (boundary) and a zero line (zero), with the area between them filled for enhanced visual interpretation. This helps in assessing the relative position of the exhaustion index.
Customizable Background : The script colors the background of the chart for better readability and to distinguish the indicator’s area clearly.
Overall, Volume Exhaustion is designed for traders who focus on volume analysis. It provides a unique perspective on volume trends and potential exhaustion points, which can be crucial for making informed trading decisions. This script is a valuable addition for traders looking to enhance their trading experience with advanced volume analysis tools.

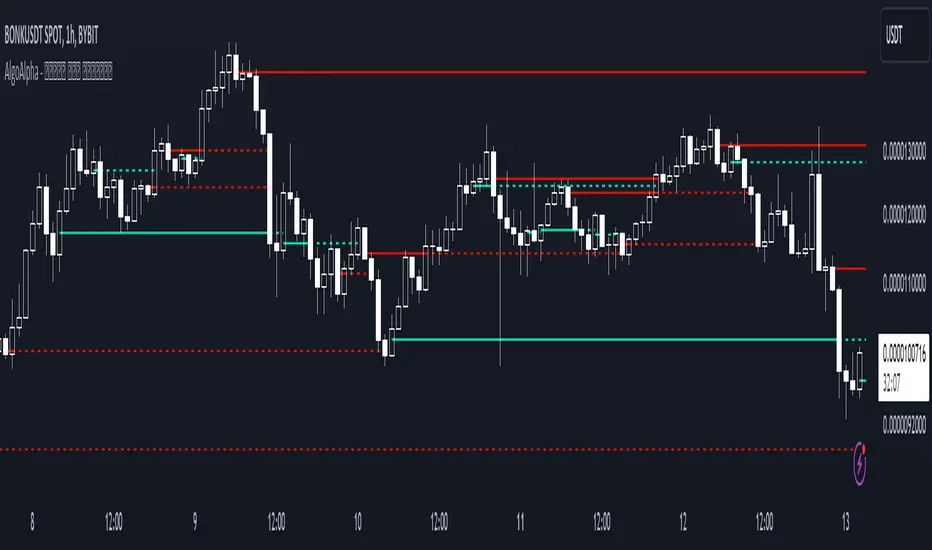
Peak & Valley Levels [AlgoAlpha]The Peak & Valley Levels indicator is a sophisticated script designed to pinpoint key support and resistance levels in the market. By utilizing candle length and direction, it accurately identifies potential reversal points, offering traders valuable insights for their strategies.
Core Components:
Peak and Valley Detection: The script recognizes peaks and valleys in price action. Peaks (potential resistance levels) are identified when a candle is longer than the previous one, changes direction, and closes lower, especially on lower volume. Valleys (potential support levels) are detected under similar conditions but with the candle closing higher.
Color-Coded Visualization:
Red lines mark resistance levels, signifying peaks in the price action.
Green lines indicate support levels, representing valleys.
Dynamic Level Adjustment: The script adapts these levels based on ongoing market movements, enhancing their relevance and accuracy.
Rejection Functions:
Bullish Rejection: Determines if a candlestick pattern rejects a level as potential support.
Bearish Rejection: Identifies if a pattern rejects a level as possible resistance.
Usage and Strategy Integration:
Visual Aid for Support and Resistance: The indicator is invaluable for visualizing key market levels where price reversals may occur.
Entry and Exit Points: Traders can use the identified support and resistance levels to fine-tune entry and exit points in their trading strategies.
Trend Reversal Signals: The detection of peaks and valleys serves as an early indicator of potential trend reversals.
Application in Trading:
Versatile for Various Trading Styles: This indicator can be applied across different trading styles, including swing trading, scalping, or trend-following approaches.
Complementary Tool: For best results, it should be used alongside other technical analysis tools to confirm trading signals and strategies.
Customization and Adaptability: Traders are encouraged to experiment with different settings and timeframes to tailor the indicator to their specific trading needs and market conditions.
In summary, the Peak & Valley Levels by AlgoAlpha is a dynamic and adaptable tool that enhances a trader’s ability to identify crucial market levels. Its integration of candlestick analysis with dynamic level adjustment offers a robust method for spotting potential reversal points, making it a valuable addition to any trader's toolkit.
Limited Growth Stock-to-Flow (LGS2F) [AlgoAlpha]Description:
The "∂ Limited Growth Stock-to-Flow (LG-S2F)" indicator, developed by AlgoAlpha, is a technical analysis tool designed to analyze the price of Bitcoin (BTC) based on the Stock-to-Flow model. The indicator calculates the expected price range of BTC by incorporating variables such as BTC supply, block height, and model parameters. It also includes error bands to indicate potential overbought and oversold conditions.
How it Works:
The LG-S2F indicator utilizes the Stock-to-Flow model, which measures the scarcity of an asset by comparing its circulating supply (stock) to its newly produced supply (flow). In this script, the BTC supply and block height data are obtained to calculate the price using the model formula. The formula includes coefficients (a, b, c) and exponentiation functions to derive the expected price.
The script incorporates error bands based on uncertainty values derived from the standard errors of the model parameters. These error bands indicate the potential range of variation in the expected price, accounting for uncertainties in the model's parameters. The upper and lower error bands visualize potential overbought and oversold conditions, respectively.
Usage:
Traders can utilize the LG-S2F indicator to gain insights into the potential price movements of Bitcoin. The indicator's main line represents the expected price, while the error bands highlight the potential range of variation. Traders may consider taking long positions when the price is near or below the lower error band and short positions when the price is close to or above the upper error band.
It's important to note that the LG-S2F indicator is specifically designed for Bitcoin and relies on the Stock-to-Flow model. Users should exercise caution and consider additional analysis and factors before making trading decisions solely based on this indicator.
Originality:
The LG-S2F indicator, developed by QuantMario and AlgoAlpha, is an original implementation that combines the Stock-to-Flow model with error bands to provide a comprehensive view of BTC's potential price range. While the concept of Stock-to-Flow analysis exists, the specific calculations, incorporation of error bands, and customization options in this script are unique to QuantMario's methodology. The script is released under Mozilla Public License 2.0, allowing users to utilize and modify it while adhering to the license terms.

Fibonacci Volume Profiles [AlgoAlpha]Unlock a deeper understanding of price action with the Fibonacci Volume Profiles indicator by AlgoAlpha! This powerful tool blends Fibonacci retracement levels with customizable volume profiles, helping traders identify high-probability areas of support, resistance, and accumulation. Designed for both continuous dynamic levels and custom time periods, this indicator is a must-have for traders seeking confluence in market structure analysis.
🔑 Key Features
📈 Dual Mode Selection : Choose between Continuous Fibonacci levels, which adapt dynamically to pivots, or a Custom Period mode, where you set your own start and end points.
📊 Integrated Volume Profile : Visualize volume distributions at key Fibonacci retracement levels, revealing areas of strong buying/selling interest.
🎨 Customizable Colors & Transparency : Adjust Fibonacci level colors, fill zones, and profile transparency for a visually clear experience.
🔍 Profile Resolution & Scaling : Control the number of price levels and width of the volume profile for detailed market insights.
🛠 Extendable Levels : Optionally extend Fibonacci levels to the right of the chart for better visualization of future price interaction.
📌 How to Use
Add the Indicator: Click on the star icon to add it to your favorites and apply it to your TradingView chart.
Analyze The Market: Observe how price interacts with Fibonacci levels alongside the volume profile to confirm support/resistance zones. Switch between custom range or continuous mode to align the tool with your trading style.
⚙️ How It Works
The indicator calculates pivot highs/lows dynamically (or uses user-defined time periods) to plot Fibonacci retracement levels. It then builds a volume profile by analyzing historical volume data, grouping it into price bins to highlight volume-heavy zones. The Point of Control (PoC) is identified as the level with the highest traded volume, acting as a key price magnet. The color-coded Fibonacci levels help traders spot retracement zones, while the volume profile confirms strength or weakness in those areas.

Smoothed Gaussian Trend Filter [AlgoAlpha]Experience seamless trend detection and market analysis with the Smoothed Gaussian Trend Filter by AlgoAlpha! This cutting-edge indicator combines advanced Gaussian filtering with linear regression smoothing to identify and enhance market trends, making it an essential tool for traders seeking precise and actionable signals.
Key Features :
🔍 Gaussian Trend Filtering: Utilizes a customizable Gaussian filter with adjustable length and pole settings for tailored smoothing and trend identification.
📊 Linear Regression Smoothing: Reduces noise and further refines the Gaussian output with user-defined smoothing length and offset, ensuring clarity in trend representation.
✨ Dynamic Visual Highlights: Highlights trends and signals based on volume intensity, allowing for real-time insights into market behavior.
📉 Choppy Market Detection: Identifies ranging or choppy markets, helping traders avoid false signals.
🔔 Custom Alerts: Set alerts for bullish and bearish signals, trend reversals, or choppy market conditions to stay on top of trading opportunities.
🎨 Color-Coded Visuals: Fully customizable colors for bullish and bearish signals, ensuring clear and intuitive chart analysis.
How to Use :
Add the Indicator: Add it to your favorites and apply it to your TradingView chart.
Interpret the Chart: Observe the trend line for directional changes and use the accompanying buy/sell signals for entry and exit opportunities. Choppy market conditions are flagged for additional caution.
Set Alerts: Enable alerts for trend signals or choppy market detections to act promptly without constant chart monitoring.
How It Works :
The Smoothed Gaussian Trend Filter uses a combination of advanced smoothing techniques to identify trends and enhance market clarity. First, a Gaussian filter is applied to price data, using a user-defined length (Gaussian length) and poles (smoothness level) to calculate an alpha value that determines the degree of smoothing. This creates a refined trend line that minimizes noise while preserving key market movements. The output is then further processed using linear regression smoothing, allowing traders to adjust the length and offset to flatten minor oscillations and emphasize the dominant trend. To incorporate market activity, volume intensity is analyzed through a normalized Hull Moving Average (HMA), dynamically adjusting the trend line's color transparency based on trading activity. The indicator also identifies trend direction by comparing the smoothed trend line with a calculated SuperTrend-style level, generating clear trend regimes and highlighting ranging or choppy conditions where trends are less reliable and avoiding false signals. This seamless integration of Gaussian smoothing, regression analysis, and volume dynamics provides traders with a powerful and intuitive tool for market analysis.

Trend Reversal Probability [Algoalpha]Introducing Trend Reversal Probability by AlgoAlpha – a powerful indicator that estimates the likelihood of trend reversals based on an advanced custom oscillator and duration-based statistics. Designed for traders who want to stay ahead of potential market shifts, this indicator provides actionable insights into trend momentum and reversal probabilities.
Key Features :
🔧 Custom Oscillator Calculation: Combines a dual SMA strategy with a proprietary RSI-like calculation to detect market direction and strength.
📊 Probability Levels & Visualization: Plots average signal durations and their statistical deviations (±1, ±2, ±3 SD) on the chart for clear visual guidance.
🎨 Dynamic Color Customization: Choose your preferred colors for upward and downward trends, ensuring a personalized chart view.
📈 Signal Duration Metrics: Tracks and displays signal durations with columns representing key percentages (80%, 60%, 40%, and 20%).
🔔 Alerts for High Probability Events: Set alerts for significant reversal probabilities (above 84% and 98% or below 14%) to capture key trading moments.
How to Use :
Add the Indicator: Add Trend Reversal Probability to your favorites by clicking the star icon.
Market Analysis: Use the plotted probability levels (average duration and ±SD bands) to identify overextended trends and potential reversals. Use the color of the duration counter to identify the current trend.
Leverage Alerts: Enable alerts to stay informed of high or extreme reversal probabilities without constant chart monitoring.
How It Works :
The indicator begins by calculating a custom oscillator using short and long simple moving averages (SMA) of the midpoint price. A proprietary RSI-like formula then transforms these values to estimate trend direction and momentum. The duration between trend reversals is tracked and averaged, with standard deviations plotted to provide probabilistic guidance on trend longevity. Additionally, the indicator incorporates a cumulative probability function to estimate the likelihood of a trend reversal, displaying the result in a data table for easy reference. When probability levels cross key thresholds, alerts are triggered, helping traders take timely action.

Kalman Step Signals [AlgoAlpha]Take your trading to the next level with the Kalman Step Signals indicator by AlgoAlpha! This advanced tool combines the power of Kalman Filtering and the Supertrend indicator, offering a unique perspective on market trends and price movements. Designed for traders who seek clarity and precision in identifying trend shifts and potential trade entries, this indicator is packed with customizable features to suit your trading style.
Key Features
🔍 Kalman Filter Smoothing : Dynamically smooths price data with user-defined parameters for Alpha, Beta, and Period, optimizing responsiveness and trend clarity.
📊 Supertrend Overlay : Incorporates a classic Supertrend indicator to provide clear visual cues for trend direction and potential reversals.
🎨 Customizable Appearance : Adjust colors for bullish and bearish trends, along with optional exit bands for more nuanced analysis.
🔔 Smart Alerts : Detect key moments like trend changes or rejection entries for timely trading decisions.
📈 Advanced Visualization : Includes optional entry signals, exit bands, and rejection markers to pinpoint optimal trading opportunities.
How to Use
Add the Indicator : Add the script to your TradingView favorites. Customize inputs like Kalman parameters (Alpha, Beta, Period) and Supertrend settings (Factor, ATR Period) based on your trading strategy.
Interpret the Signals : Watch for trend direction changes using Supertrend lines and directional markers. Utilize rejection entries to identify price rejections at trendlines for precision entry points.
Set Alerts : Enable the built-in alert conditions for trend changes or rejection entries to act swiftly on trading opportunities without constant chart monitoring.
How It Works
The indicator leverages a Kalman Filter to smooth raw price data, balancing responsiveness and noise reduction using user-controlled parameters. This refined price data is then fed into a Supertrend calculation, combining ATR-based volatility analysis with dynamic upper and lower bands. The result is a clear and reliable trend-detection system. Additionally, it features rejection markers for bullish and bearish reversals when prices reject the trendline, along with exit bands to visualize potential price targets. The integration of customizable alerts ensures traders never miss critical market moves.
Add the Kalman Step Signals to your TradingView charts today and enjoy a smarter, more efficient trading experience! 🚀🌟

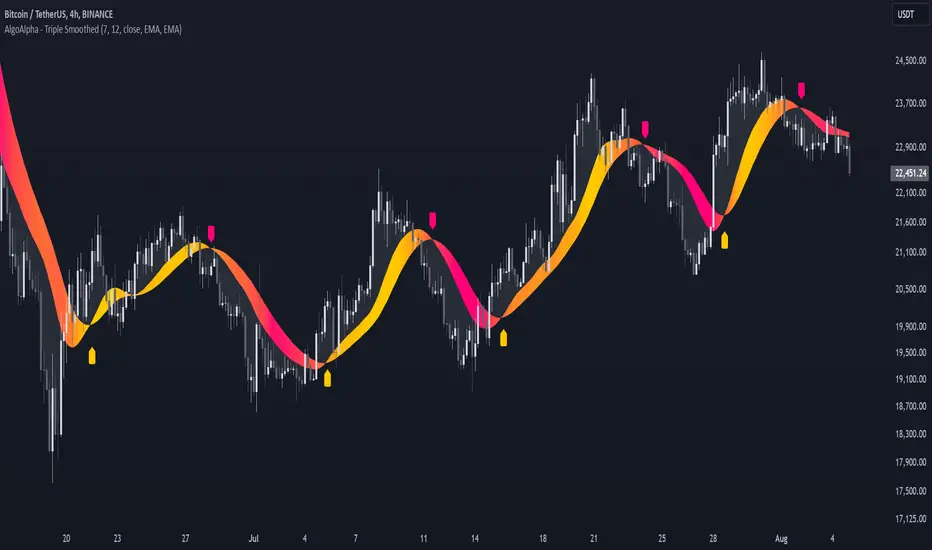
Triple Smoothed Signals [AlgoAlpha]Introducing the Triple Smoothed Signals indicator by AlgoAlpha, a powerful tool designed to help traders identify trend direction and market momentum with greater accuracy. By applying triple smoothing techniques to your chosen data source, this indicator filters out market noise, allowing you to focus on significant price movements. Perfect for traders looking to enhance their technical analysis and gain an edge in the markets.
Key Features
🎨 Customizable Moving Averages : Choose between EMA, SMA, RMA, or WMA for both the triple smoothing and the signal line to tailor the indicator to your trading style.
🛠 Adjustable Smoothing Lengths : Configure the main smoothing length and signal length to fit different timeframes and market conditions.
🌈 Dynamic Color Fills : Visual gradients and fills highlight trend strength and direction, making chart analysis more intuitive.
🔔 Alerts : Set alerts for bullish and bearish crossover signals to stay ahead of market moves without constant chart monitoring.
📈 Clear Signal Visualization : Bullish and bearish signals are plotted directly on your chart for easy interpretation and timely decision-making.
Quick Guide to Using the Triple Smoothed Signals Indicator
🛠 Add the Indicator : Add the indicator to your TradingView chart by clicking on the star icon to add it to your favorites. Customize the settings such as the main smoothing length, signal length, data source, and moving average types to match your trading strategy.
📊 Market Analysis : Monitor the crossovers between the triple smoothed moving average and the signal line. A bullish signal is generated when the signal line crosses under the triple smoothed MA, indicating a potential upward trend. Conversely, a bearish signal occurs when the signal line crosses over the triple smoothed MA, suggesting a possible downward trend.
🔔 Alerts : Enable notifications for reversal signals and trend shifts to stay informed about market movements without constantly monitoring the chart.
How It Works
The Triple Smoothed Signals indicator enhances trend detection by applying a triple smoothing process to your selected data source using the moving average type of your choice (EMA, SMA, RMA, or WMA). This triple smoothed moving average (v1) effectively reduces short-term fluctuations and noise, revealing the underlying market trend. A signal line (v2) is then calculated by smoothing the triple smoothed MA with a separate moving average, further refining the signal. The indicator calculates the normalized distance between the triple smoothed MA and the signal line over a specified period, which is used to create dynamic color gradients and fills on the chart. These visual elements provide immediate insight into trend strength and direction. Bullish and bearish signals are generated based on the crossovers between the signal line and the triple smoothed MA, and are plotted directly on the chart along with customizable alerts to assist traders in making timely decisions.
Double Top/Bottom [AlgoAlpha]Introducing the Double Top/Bottom Indicator by AlgoAlpha, a powerful tool designed to identify key reversal patterns in the market with precision. This indicator meticulously detects double tops and double bottoms, helping traders recognize potential trend reversals and make informed trading decisions.
Key Features:
🔍 Pattern Detection : Accurately identifies double top and double bottom formations based on customizable time horizons.
🎨 Customizable Appearance : Choose your preferred colors for bullish and bearish trends to match your trading style.
📊 Signal Labels : Option to display only the second pivot of the double top/bottom for a cleaner chart view.
🔧 Flexible Settings : Adjust the time horizon to control the look-back period, allowing for detection of both short-term and long-term patterns.
📈 Visual Enhancements : Draws trend lines and fills between pivotal points to visually highlight potential reversal zones.
🔔 Alerts : Set up alerts for potential double top and double bottom formations to stay informed of key market movements.
How to Use the Double Top/Bottom Indicator :
🛠 Add the Indicator : Simply add the Double Top/Bottom Indicator to your TradingView chart from your favorites. Customize the time horizon and appearance settings to fit your trading preferences.
📊 Analyze Patterns : Watch for the identified double top and double bottom patterns along with the corresponding trend lines and filled areas to anticipate potential market reversals.
🔔 Set Alerts : Enable alerts to receive notifications when double top or double bottom patterns are detected, ensuring you never miss a critical trading opportunity.
How It Works : The indicator scans the price action for pivot highs and lows within a specified time horizon, identifying potential double top and double bottom patterns. It maintains a sequence of these pivots and verifies the formation of these patterns based on the relationship between consecutive pivots and the proximity to a defined limit. When a double top or double bottom is confirmed, the indicator marks the second pivot point with a label and draws trend lines to visualize the reversal pattern. Additionally, it provides alert conditions to notify traders of potential confirmations, enhancing decision-making without cluttering the chart.
⚠️ Important Reminder : The labels indicating double tops and bottoms appear with a delay and are intended to mark the formations after they have already formed. They are not meant to be used as real-time trading signals. While they align perfectly with pivot points in hindsight, please use them as markers for analysis rather than immediate trading triggers.

Reversal Signals [AlgoAlpha]📈🔄 Reversal Signals – Master Market Reversals with Precision! 🚀✨
Elevate your trading strategy with the Reversal Signals indicator by AlgoAlpha. This advanced tool is designed to pinpoint potential bullish and bearish reversals by analyzing price action and, optionally, volume confirmations. It seamlessly combines reversal detection with trend analysis, giving you a comprehensive view of market dynamics to make informed trading decisions.
Key Features
🔎 Price Action Reversal Detection : Identifies potential reversal points by comparing current price movements against historical candle patterns within a customizable lookback period.
📊 Volume Confirmation : Optionally integrates volume analysis to confirm the strength of reversal signals, enhancing their reliability.
📈 Stepped Moving Average Trend Indicator : Employs a stepped moving average that adjusts at set intervals to reflect underlying market trends.
⚙️ Customizable Settings : Tailor the indicator to your trading style with adjustable parameters for lookback periods, confirmation windows, moving average types, and more.
🎨 Visual Signals and Trend Coloring : Clear on-chart labels for reversal signals and color-coded trend areas to quickly identify bullish and bearish conditions.
🔔 Alerts for Key Market Events : Set up custom alerts for reversal signals and trend shifts to stay ahead of market movements.
Quick Guide to Using the Reversal Signals Indicator :
🛠 Add the Indicator : Add the indicator to your favorites by pressing the star icon. Customize settings like Candle Lookback, Confirm Within, and Use Volume Confirmation to fit your trading style.
📊 Market Analysis : Observe the "𝓡" labels on the chart indicating bullish and bearish reversal signals. Look for labels below the bars for bullish signals and above the bars for bearish signals. Use the color-filled areas between the stepped moving average and the center line to assess market trends.
🔔 Alerts : Enable notifications for reversal signals and trend shifts to stay informed about market movements without constantly monitoring the chart.
How It Works
The Reversal Signals indicator operates by conducting a thorough analysis of price action over a user-defined lookback period. For a bullish reversal, the indicator checks if the current closing price is lower than the lows of the preceding candles within the lookback window, suggesting a potential oversold condition. If this criterion is met, it marks the candle as a potential reversal point and waits for confirmation within a specified number of subsequent candles. Confirmation occurs when the price rises above the high of the identified candle, signaling a bullish reversal. An optional volume confirmation can be enabled to ensure that the reversal is supported by higher-than-average trading volume, adding an extra layer of validation to the signal. The process is mirrored for bearish reversals, where the indicator looks for the closing price exceeding previous highs and awaits confirmation of a downward move.
Complementing the reversal signals, the indicator features a stepped moving average that serves as a dynamic trend indicator. This moving average updates at intervals defined by the MA Step Period and shifts direction based on price crossings. If the price remains above the stepped MA, it indicates a bullish trend, coloring the area between the MA and the center line in green. Conversely, if the price falls below the stepped MA, a bearish trend is signaled, and the area is shaded red. This visual representation helps traders quickly assess the prevailing market trend and align their trading decisions accordingly.
Experience a new level of market insight with the Reversal Signals indicator. Add it to your TradingView chart today and enhance your ability to detect and act on key ma

Zero Lag Trend Signals (MTF) [AlgoAlpha]Zero Lag Trend Signals 🚀📈
Ready to take your trend-following strategy to the next level? Say hello to Zero Lag Trend Signals , a precision-engineered Pine Script™ indicator designed to eliminate lag and provide rapid trend insights across multiple timeframes. 💡 This tool blends zero-lag EMA (ZLEMA) logic with volatility bands, trend-shift markers, and dynamic alerts. The result? Timely signals with minimal noise for clearer decision-making, whether you're trading intraday or on longer horizons. 🔄
🟢 Zero-Lag Trend Detection : Uses a zero-lag EMA (ZLEMA) to smooth price data while minimizing delay.
⚡ Multi-Timeframe Signals : Displays trends across up to 5 timeframes (from 5 minutes to daily) on a sleek table.
📊 Volatility-Based Bands : Adaptive upper and lower bands, helping you identify trend reversals with reduced false signals.
🔔 Custom Alerts : Get notified of key trend changes instantly with built-in alert conditions.
🎨 Color-Coded Visualization : Bullish and bearish signals pop with clear color coding, ensuring easy chart reading.
⚙️ Fully Configurable : Modify EMA length, band multiplier, colors, and timeframe settings to suit your strategy.
How to Use 📚
⭐ Add the Indicator : Add the indicator to favorites by pressing the star icon. Set your preferred EMA length and band multiplier. Choose your desired timeframes for multi-frame trend monitoring.
💻 Watch the Table & Chart : The top-right table dynamically updates with bullish or bearish signals across multiple timeframes. Colored arrows on the chart indicate potential entry points when the price crosses the ZLEMA with confirmation from volatility bands.
🔔 Enable Alerts : Configure alerts for real-time notifications when trends shift—no need to monitor charts constantly.
How It Works 🧠
The script calculates the zero-lag EMA (ZLEMA) by compensating for data lag, giving traders more responsive moving averages. It checks for volatility shifts using the Average True Range (ATR), multiplied to create upper and lower deviation bands. If the price crosses above or below these bands, it marks the start of new trends. Additionally, the indicator aggregates trend data from up to five configurable timeframes and displays them in a neat summary table. This helps you confirm trends across different intervals—ideal for multi-timeframe analysis. The visual signals include upward and downward arrows on the chart, denoting potential entries or exits when trends align across timeframes. Traders can use these cues to make well-timed trades and avoid lag-related pitfalls.

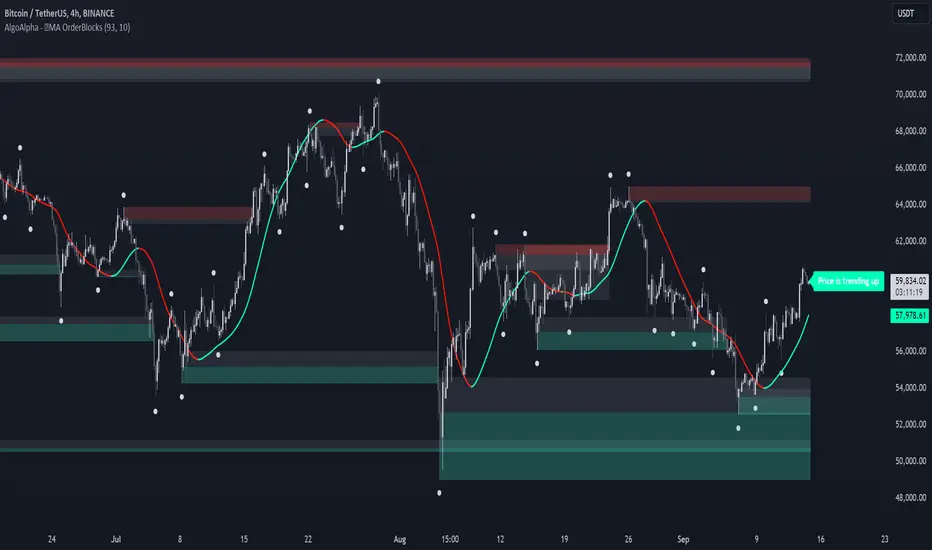
MA OrderBlocks [AlgoAlpha]🟨 HMA OrderBlocks by AlgoAlpha is a powerful tool designed to help traders visualize key pivot zones and order blocks based on the Hull Moving Average (HMA). By dynamically identifying bullish and bearish pivot points, this script provides insights into potential price reversals and trend continuations. With customizable settings, it allows traders to tweak the behavior of the indicator to match their strategies. Plus, it comes packed with built-in alerts for trend changes, making it easier to spot potential trade opportunities.
Key Features :
📊 Trend Detection : Utilizes Hull Moving Average to detect the current trend.
🟢🔴 Bullish & Bearish Zones : Automatically plots bullish and bearish order blocks, using customizable colors for clear visual cues.
🎯 Pivot Points : Detects and marks pivot highs and lows, helping traders spot key price reversals.
🚨 Alerts : Built-in alert system for when the price approaches key bullish or bearish zones, or when the trend changes.
🔨 Customizable MA: Choose from various moving averages (SMA, HMA, EMA, etc.) to suit your strategy.
How to Use :
⭐ Add the Indicator : Add the indicators to favourites by pressing the star icon. Once added, configure settings like the Hull MA period and pivot detection period.
📈 Analyze the Chart : Watch for the plotted order blocks and pivot points to identify possible price action strategies.
🔔 Enable Alerts : Set up alerts to be notified of potential trend reversals or when the price nears a bullish/bearish block.
How It Works :
The script starts by calculating the Hull Moving Average (HMA) based on the user-defined length, which is used to determine the market trend direction. It compares the current HMA value with the previous one to confirm whether the price is trending upwards or downwards. Once a trend change is detected, it plots bullish or bearish order blocks based on recent pivot highs and lows. These zones are extended in real-time as long as they remain invalidated. Zones are invalidated are invalidated when price completely closes through them. If the price gets close to a zone in the opposing direction, a warning system alerts the user that the block may not hold. Additionally, customizable alerts trigger whenever the price trend shifts or the price gets near important bullish/bearish blocks. The script’s logic ensures that order blocks are cleared if price violates them, keeping the chart clean and updated.
Ranges and Breakouts [AlgoAlpha]💥 Ranges and Breakouts by AlgoAlpha is a dynamic indicator designed for traders seeking to identify market ranges and capitalize on breakout opportunities. This tool automatically detects ranges based on price action over a specified period, visualizing these ranges with shaded boxes and midlines, making it easy to spot potential breakout scenarios. The indicator includes advanced features such as customizable pivot detection, internal range allowance, and automatic trend color changes for quick market analysis.
Key Features
💹 Dynamic Range Detection : Automatically identifies market ranges using customizable look-back and confirmation periods.
🎯 Breakout Alerts : Get alerted to bullish and bearish breakouts for potential trading opportunities.
📊 Visual Aids : Displays pivot highs/lows within ranges and plots midlines with adjustable styles for easier market trend interpretation.
🔔 Alerts : Signals potential take-profit points based on volatility and moving average crossovers.
🎨 Customizable Appearance : Choose between solid, dashed, or dotted lines for midlines and adjust the colors for bullish and bearish zones.
How to Use
⭐ Add the Indicator : Add the indicator to favorites by pressing the star icon. Adjust the settings like the look-back period, confirmation length, and pivot detection to match your trading strategy.
👀 Monitor the Chart : Watch for new ranges to form, highlighted by shaded boxes on the chart. Midlines and range bounds will appear to help you gauge potential breakout points.
⚡ React to Breakouts : Pay attention to color changes and alert signals for bullish or bearish breakouts. Use these signals to enter or exit trades.
🔔 Set Alerts : Customize alert conditions for new range formations, breakout signals, and take-profit levels to stay on top of market movements without constant monitoring.
How It Works
The indicator detects price ranges by analyzing the highest and lowest prices over a specified period. It confirms a range if these levels remain unchanged for a set number of bars, at which point it visually marks the range with shaded boxes. Pivots are identified within these ranges, and a midline is plotted to help interpret potential breakouts. When price breaks out of these defined ranges, the indicator changes the chart's background color to signal a bullish or bearish trend. Alerts can be set for range formation, breakouts, and take-profit opportunities, helping traders stay proactive in volatile markets.

Hullinger Percentile Oscillator [AlgoAlpha]🚀 Introducing the Hullinger Percentile Oscillator by AlgoAlpha! 🚀
This versatile Pine Script™ indicator is designed to help you identify swing trends and potential reversals with precision. Whether you're looking to catch market swings or spot divergences, the Hullinger Percentile Oscillator offers a comprehensive suite of features to enhance your trading strategy.
Key Features
🎯 Customizable Hullinger Settings: Adjust the main length, source, and standard deviation multipliers to fine-tune the indicator to your preferred trading style.
🔄 Dynamic Oscillator Modes: Switch between "Swing" mode for trend identification and "Contrarian" mode for reversal spotting, adapting the indicator to your market view.
📉 Divergence Detection: The indicator includes parameters to control the sensitivity and confirmation of divergence signals, helping to filter out noise and highlight significant market moves.
🌈 Color-Coded Visuals: Easily distinguish between bullish and bearish signals with customizable color settings for a clear visual representation on your chart.
🔔 Alert Integration: Stay ahead of the market with built-in alerts for key conditions, including strong and weak reversals, as well as bullish and bearish swings.
Quick Guide to Using the Hullinger Percentile Oscillator
Maximize your trading edge with the Hullinger Percentile Oscillator by following these steps! 📈✨
🛠 Add the Indicator: Add the indicator to favorites by pressing the star icon ⭐. Customize settings like Main Length, Oscillator Mode, and Appearance to fit your trading needs.
📊 Market Analysis: Use "Swing" mode to track trends and "Contrarian" mode to spot reversals. Watch for divergence signals to catch potential trend changes.
🔔 Alerts: Set up alerts to be notified of significant market movements without constantly monitoring your chart.
How It Works
The Hullinger Percentile Oscillator calculates its signals by applying a modified standard deviation approach to the Hull Moving Average (HMA) of a selected price source. It creates both inner and outer bands based on different multipliers. The oscillator then measures the position of the price relative to these bands, smoothing the result for swing trend detection. Depending on the chosen mode, the oscillator either highlights swing trends or potential reversals. Divergences are detected by comparing recent pivot highs and lows in both price and the oscillator, allowing you to spot bullish or bearish divergence setups. Alerts are triggered based on key crossovers or when specific conditions are met, ensuring that you are always informed of crucial market developments.

Hullinger Bands [AlgoAlpha]🎯 Introducing the Hullinger Bands Indicator ! 🎯
Maximize your trading precision with the Hullinger Bands , an advanced tool that combines the strengths of Hull Moving Averages and Bollinger Bands for a robust trading strategy. This indicator is designed to give traders clear and actionable signals, helping you identify trend changes and optimize entry and exit points with confidence.
✨ Key Features :
📊 Dual-Length Settings : Customize your main and TP signal lengths to fit your trading style.
🎯 Enhanced Band Accuracy : The indicator uses a modified standard deviation calculation for more reliable volatility measures.
🟢🔴 Color-Coded Signals : Easily spot bullish and bearish conditions with customizable color settings.
💡 Dynamic Alerts : Get notified for trend changes and TP signals with built-in alert conditions.
🚀 Quick Guide to Using Hullinger Bands
1. ⭐ Add the Indicator : Add the indicator to favorites by pressing the star icon. Adjust the settings to align with your trading preferences, such as length and multiplier values.
2. 🔍 Analyze Readings : Observe the color-coded bands for real-time insights into market conditions. When price is closer to the upper bands it suggests an overbought market and vice versa if price is closer to the lower bands. Price being above or below the basis can be a trend indicator.
3. 🔔 Set Alerts : Activate alerts for bullish/bearish trends and TP signals, ensuring you never miss a crucial market movement.
🔍 How It Works
The Hullinger Bands indicator calculates a central line (basis) using a simple moving average, while the upper and lower bands are derived from a modified standard deviation of price movements. Unlike the traditional Bollinger Bands, the standard deviation in the Hullinger bands uses the Hull Moving Average instead of the Simple Moving Average to calculate the average variance for standard deviation calculations, this give the modified standard deviation output "memory" and the bands can be observed expanding even after the price has started consolidating, this can identify when the trend has exhausted better as the distance between the price and the bands is more apparent. The color of the bands changes dynamically, based on the proximity of the closing price to the bands, providing instant visual cues for market sentiment. The indicator also plots TP signals when price crosses these bands, allowing traders to make informed decisions. Additionally, alerts are configured to notify you of crucial market shifts, ensuring you stay ahead of the curve.

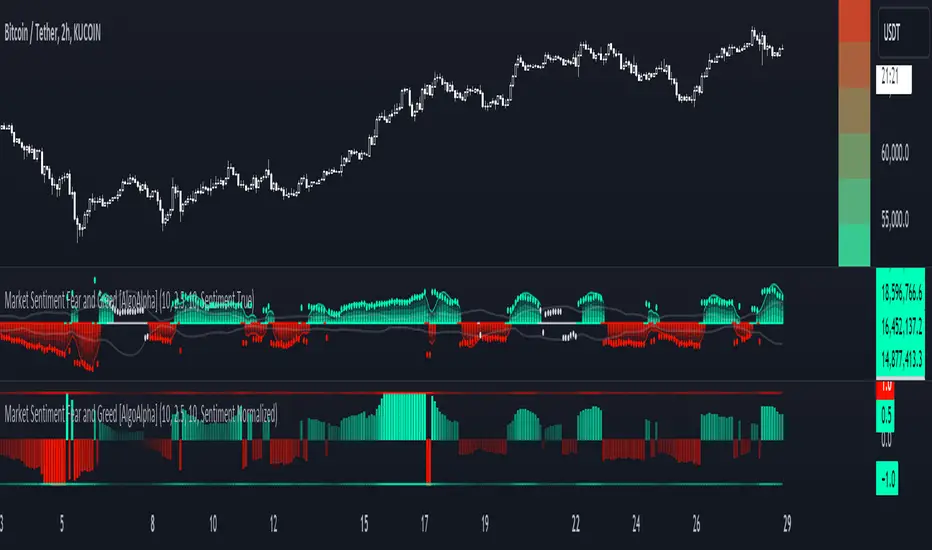
Market Sentiment Fear and Greed [AlgoAlpha]Unleash the power of sentiment analysis with the Market Sentiment Fear and Greed Indicator! 📈💡 This tool provides insights into market sentiment, helping you make informed trading decisions. Let's dive into its key features and how it works. 🚀✨
Key Features 🎯
🧠 Sentiment Analysis : Calculates market sentiment using volume and price data. 📊
📅 Customizable Lookback Window : Adjust the lookback period to fine-tune sensitivity. 🔧
🎨 Bullish and Bearish Colors : Visualize trends with customizable colors. 🟢🔴
🚀 Impulse Detection : Identifies bullish and bearish impulses for trend confirmation. 🔍
📉 Normalized Sentiment Index : Offers a normalized view of market sentiment. 📊
🔔 Alerts : Set alerts for key sentiment changes and trend impulses. 🚨
🟢🔴 Table Visualization : Displays sentiment strength using a gradient color table. 🗂️
How to Use 📖
Maximize your trading potential with this indicator by following these steps:
🔍 Add the Indicator : Search for "Market Sentiment Fear and Greed " in TradingView's Indicators & Strategies. Customize settings like the lookback window and trend breakout threshold to suit your trading strategy.
📊 Monitor Sentiment : Watch the sentiment gauge and plot changes to detect market sentiment shifts. Use the Normalized Sentiment Index for a more balanced view.
🚨 Set Alerts : Enable alerts for sentiment flips and trend impulses to stay ahead of market movements.
How It Works ⚙️
The indicator calculates market sentiment by averaging the volume and closing prices over a user-defined lookback period, creating a sentiment score. It differentiates between bullish and bearish sentiment by evaluating whether the closing price is higher or lower than the opening price, summing the respective volumes. The true sentiment is determined by comparing these summed values, with a positive score indicating bullish sentiment and a negative score indicating bearish sentiment. The indicator further normalizes this sentiment score by dividing it by the EMA of the highest high minus the lowest low over double the lookback period, ensuring values are constrained between -1 and 1. Bullish and bearish impulses are identified using Hull Moving Averages (HMA) of the positive and negative sentiments, respectively. When these impulses exceed a calculated threshold based on the standard deviation of the sentiment, it indicates a significant trend change. The script also includes a gradient color table to visually represent the strength of sentiment, and customizable alerts to notify users of key sentiment changes and trend impulses.
Unlock deeper insights into market sentiment and elevate your trading strategy with the Market Sentiment Fear and Greed Indicator! 📈✨
Visible Range Support and Resistance [AlgoAlpha]🌟 Introducing the Visible Range Support and Resistance 🌟
Discover key support and resistance levels with the innovative "Visible Range Support and Resistance" indicator by AlgoAlpha! 🚀📈 This advanced tool dynamically identifies significant price zones based on the visible range of your chart, providing traders with crucial insights for making informed decisions.
Key Features:
Dynamic support and resistance levels based on visible chart range 📏
User-defined resolution for tailored analysis 🎯
Clear visual representation of significant key zones 🖼️
Easy integration with any trading strategy 💼
How to Use:
🛠 Add the Indicator : Add the indicator to favourites. Adjust settings like resolution and horizontal extension to suit your trading style.
📊 Market Analysis : Identify key support and resistance zones based on the highlighted areas. These zones indicate significant price levels where the market may react.
How it Works:
The indicator segments the price range into user-defined resolutions, analyzing the highest and lowest points to establish boundaries. It calculates the frequency of price action within these segments, highlighting key levels where price movements are least concentrated (areas where price tends to pivot). Customizable settings like resolution and horizontal extension allow for tailored analysis, while the intuitive visual representation makes it easy to spot potential support and resistance zones directly on your chart.
By leveraging this indicator, you can gain deeper insights into market dynamics and improve your trading strategy with data driven support and resistance analysis. Happy trading! 💹✨

Trend Strength Signals [AlgoAlpha]🌟Introducing the Trend and Strength Signals indicator by AlgoAlpha ! This tool is designed to help you identify trends and gauge market strength with precision and ease. 📈🚀
🛠 Customizable Parameters : Adjust the period, standard deviation multiplier, gauge size, and colors to fit your trading style.
📊 Trend Detection : Visualize trends with clear color-coded signals for uptrends and downtrends.
📈 Strength Gauge : Assess market strength with a dynamic gauge that adapts to the current price action.
🔔 Alerts : Set alerts for bullish and bearish trend crossovers and take profit points to stay ahead of the market.
🎨 Visual Enhancements : Enjoy a clutter-free chart with the integration of plot shapes, color fills, and gradient gauges.
🚀 Quick Guide to Using the Trend and Strength Signals Indicator
Maximize your trading with the Trend and Strength Signals indicator by following these streamlined steps! 🎯✨
🛠 Add the Indicator : Add the indicator to your favorites. Customize settings like period, standard deviation multiplier, and colors to fit your trading style.
📊 Market Analysis : Observe the color-coded candles and gauge to understand market trend direction and strength. Use the alerts for key trading signals.
🔔 Alerts : Enable notifications for trend crossovers and take profit points to catch trading opportunities without constantly monitoring the chart.
⚙️ How it works
This indicator calculates the moving average and standard deviation of the closing price over a customizable period to identify the upper and lower bounds. When the price crosses these bounds, it signals an uptrend or downtrend. The gauge measures market strength by comparing the price to the moving average and scaling it over a customizable range, while the underlying logic uses concepts from the Bollinger Bands, this indicator gives a unique perspective on price behavior through added features and signals derived from it.
Unleash the power of trend and strength analysis with this comprehensive indicator! Happy trading! 🚀📈✨
Net Buying/Selling Flows Toolkit [AlgoAlpha]🌟📊 Introducing the Net Buying/Selling Flows Toolkit by AlgoAlpha 📈🚀
🔍 Explore the intricate dynamics of market movements with the Net Buying/Selling Flows Toolkit designed for precision and effectiveness in visualizing money inflows and outflows and their impact on asset prices.
🔀 Multiple Display Modes : Choose from "Flow Comparison", "Net Flow", or "Sum of Flows" to view the data in the most relevant way for your analysis.
📏 Adjustable Unit Display : Easily manage the magnitude of the values displayed with options like "1 Billion", "1 Million", "1 Thousand", or "None".
🔧 Lookback Period Customization : Tailor the sum calculation window with a configurable lookback period, applicable in "Sum of Flows" mode.
📊 Deviation Thresholds : Set up lower and upper deviation thresholds to identify significant changes in flow data.
🔄 Reversal Signals and Deviation Bands : Enable signals for potential reversals and visualize deviation bands for comparative analysis.
🎨 Color-coded Visualization : Distinct colors for upward and downward movements make it easy to distinguish between buying and selling pressures.
🚀 Quick Guide to Using the Net Buying/Selling Flows Toolkit :
🔍 Add the Indicator : Add the indicator to you favorites. Customize the settings to fit your trading requirements.
👁️🗨️ Data Analysis : Compare the trend of Buying and Selling to help indicate whether bulls or bears are in control of the market. Utilize the different display modes to present the data in different form to suite your analysis style.
🔔 Set Alerts : Activate alerts for reversal conditions to keep abreast of significant market movements without having to monitor the charts constantly.
🌐 How It Works :
The toolkit processes volume data on a lower timeframe to distinguish between buying and selling pressures based on intra-bar price closing higher or lower than it opened. It aggregates these transactions and finds the net selling and buying that took place during that bar, offering a clearer view of market fundamentals. The indicator then plots this data visually with multiple modes including comparisons between buying/selling and the net flow of the asset. Deviation thresholds help in identifying significant changes, allowing traders to spot potential buying or selling opportunities based on the money flow dynamics. The "Sum of Flows" mode is unique from other trend following indicators as it does not determine trend based on price action, but rather based on the net buying/selling. Therefore in some cases the "Sum of Flows" mode can be a leading indicator showing bullish/bearish net flows even before the prices move significantly.
Embark on a more informed trading journey with this dynamic and insightful tool, tailor-made for those who demand precision and clarity in their trading strategies. 🌟📉📈

Institutional Activity Index [AlgoAlpha]🌟 Introducing the Institutional Activity Index by AlgoAlpha 🌟
Welcome to a powerful new indicator designed to gauge institutional trading activity! This cutting-edge tool combines volume analysis with price movement to derive a unique index that shines a spotlight on potential institutional moves in the market. 🎯📈
Key Features:
🔍 Normalization Period : Adjust the look-back period for normalization to tailor the sensitivity to your trading strategy.
📊 Moving Average Types : Choose from SMA, HMA, EMA, RMA, WMA, or VWMA to smooth the index and pinpoint trends.
🌈 Color-Coded Trends : Instant visual feedback on index trend direction with customizable up and down colors.
🔔 Alerts : Set alerts for when the index shows increasing activity, decreasing activity, or has reached a peak.
Quick Guide to Using the Institutional Activity Index:
1. 📝 Add the Indicator: Add the indicator to favorites. Adjust the normalization period, MA type, and peak detection settings to match your trading style.
2. 📈 Market Analysis: Similar to volume that reflects the amount of collective trading activity, this index reflects an estimate of the amount of trading activity by institutions. A higher value means that institutions are trading the asset more, this can mean selling or buying as the indicator does not indicate direction . Look out for peak signals, which may indicate that institutions have already secured positions in preparation for a move in price.
3. 🔔 Set Alerts: Enable alerts to notify you when there is a significant change in the activity levels or a new peak is detected, allowing for timely decisions without constant monitoring.
How It Works: 🛠
It is common knowledge that institutions trade with high amounts of capital, but employ tactics so as to not move the price significantly when entering on positions. This can be done by entering in times of high liquidity so that when an institution buys, there are enough sellers to cancel out the price movements and prevent a huge pump in price and vice versa. The Institutional Activity Index calculates liquidity by measuring the volume relative to the price range (close-open). This value is smoothed using median and a user defined moving average type and period, enhancing its clarity. If normalization is enabled, the index is adjusted relative to its range over a user-defined period, making the data comparable across different conditions.
Embrace this innovative tool to enhance your trading insights and strategies! 🚀✨

Crypto Realized Profits/Losses Extremes [AlgoAlpha]🌟🚀 Introducing the Crypto Realized Profits/Losses Extremes Indicator by AlgoAlpha 🚀🌟
Unlock the potential of cryptocurrency markets with our cutting-edge On-Chain Pine Script™ indicator, designed to highlight extreme realized profit and loss zones! 🎯📈
Key Features:
✨ Realized Profits/Losses Calculation: Uses real-time data from the blockchain to monitor profit and loss realization events.
📊 Multi-Crypto Compatibility: The Indicator is compatible on other Crypto tickers besides Bitcoin.
⚙️ Customizable Sensitivity: Adjust the look-back period, normalization period, and deviation thresholds to tailor the indicator to your trading style.
🎨 Visual Enhancements: Choose from a variety of colors for up and down trends, and toggle extreme profit/loss overlay for easy viewing.
🔔 Integrated Alerts: Set up alerts for high and extreme profit or loss conditions, helping you stay ahead of significant market movements.
🔍 How to Use:
🛠 Add the Indicator: Add the indicator to favorites. Customize settings like period lengths and deviation thresholds according to your needs.
📊 Market Analysis: Monitor the main oscillator and the bands to understand current profit and loss extremes in the market. When the oscillator is at the upper band, this means that the market is doing really well and traders/investors will be likely to take profit and cause a reversal. The opposite is true when the oscillator reaches the lower band. The main oscillator can also be used for trend analysis.
🔔 Set Alerts: Configure alerts to notify you when the market enters a zone of high profit or loss, or during trend changes, enabling timely decisions without constant monitoring.
How It Works:
The indicator calculates a normalized area under the RSI curve applied on on-chain data regarding the number of wallets in profit. It employs a custom "src" variable that aggregates data from the blockchain about profit and loss addresses, adapting to intraday or longer timeframes as needed. The main oscillator plots this normalized area, while the upper and lower bands are plotted based on a deviation metric to identify extreme conditions. Colored fills between these bands visually denote these zones. For interaction, the indicator plots bubbles for extreme profits or losses and provides optional bar coloring to reflect the current market trend.
🚀💹 Enjoy a comprehensive, customizable, and visually engaging tool that helps you stay ahead in the fast-paced crypto market!
