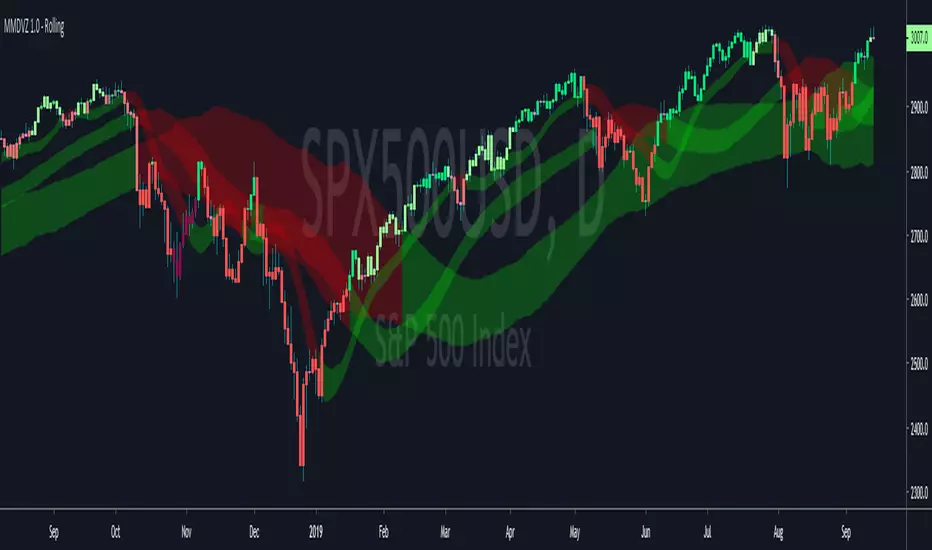
MMDVZ 1.0 (Rolling) - Moving Multi-Day VWAP Zones Rolling version of the MMDVZ script .
The bands do not reset at a fixed interval in this version and are instead bar based.
Volatility adjusted moving multi-day VWAP zones
Directionality, trend and support/resistance levels at a glance
Useful for trading practically all kinds of stocks and futures .
Works well with many timeframes.
More updates to come, stay tuned
Cerca negli script per "zone"
MA ZonesThis simple indicator paints the zone between up to 3 different Moving Averages and Exponential Moving Averages.
For example:
The green zone is the price between the 50 EMA and the 50 MA .
The orange zone is the price between the 100 EMA and the 100 MA .
The red zone is the price between the 200 EMA and the 200 MA .

Exhaustion Zone [by rukich]🟠 OVERVIEW
The indicator shows asset exhaustion — an area of interest where potential buying opportunities can be considered.
🟠 COMPONENTS
The indicator is based on a combination of fundamental tools designed to properly react to price movement and volatility.
It is displayed on the chart as a green line. When the price touches the indicator line, the candle lights up and is highlighted in green.
🟠 HOW TO USE
The best timeframes for using the indicator: 1D and 3D.
Since the indicator is used on higher timeframes, the price rarely reaches the indicator line, but it often shows a strong reaction when it does, which suggests that the indicator can be used for investment purposes.
Since the zone suggests potential buying opportunities, it’s best to act from the zone only when a reaction is confirmed. Confirmation may include a candle close beyond nearby fractals or the invalidation of the nearest resistance zone.
🟠 CONCLUSION
The indicator highlights an area of interest where, upon confirmation of a reaction, buying opportunities may be considered.

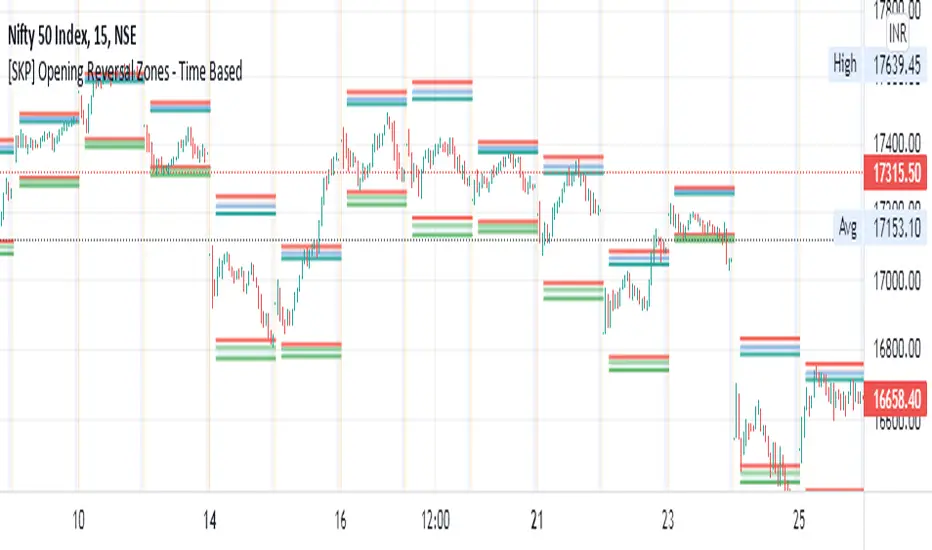
[SKP] Opening Range Reversals with FIBO zonesopening range reversal zones with fibo .50, .618, .786, 1 levels
opening range time can set as you like, 15M, 30M etc
entry at .50 and .618 levels with stop loss .786 and 1 levels.
do backtest and practice..
idea from author colejustice
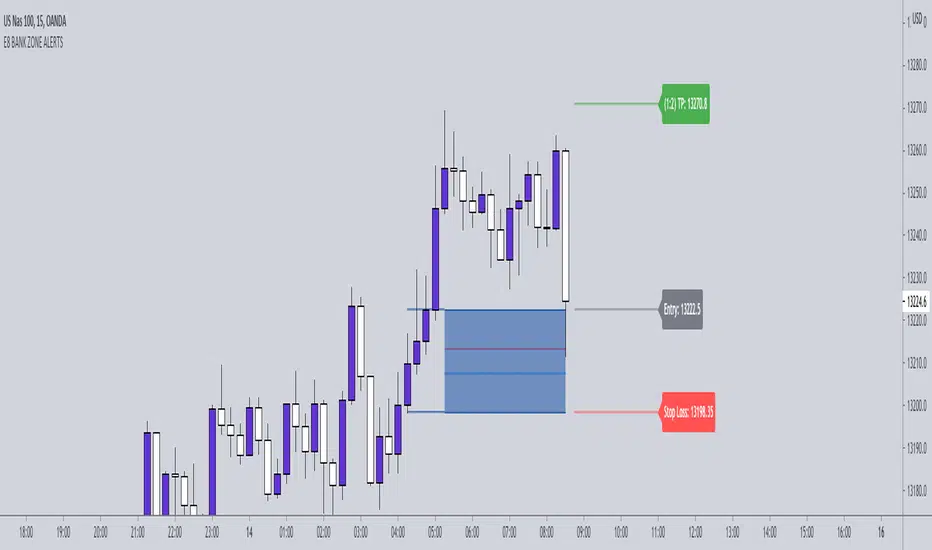
E8-BANK ZONES 4.0 THE E8- BANK ZONES will highlight the most accurate zones the market has to offer.
SETTINGS:
Remove uncheck CHARS - this feature simply places a star on high momentum candles to help identify strong momentum bullish and bearish candles.
INPUT:
You have the ability to choose which zones to display. Our recommendation is to activate continuation zones when price is trending and reversal zones when price is at key level/ strong support and resistance areas.
CONTINUATION ZONES
REVERSAL ZONES
FLIP ZONES
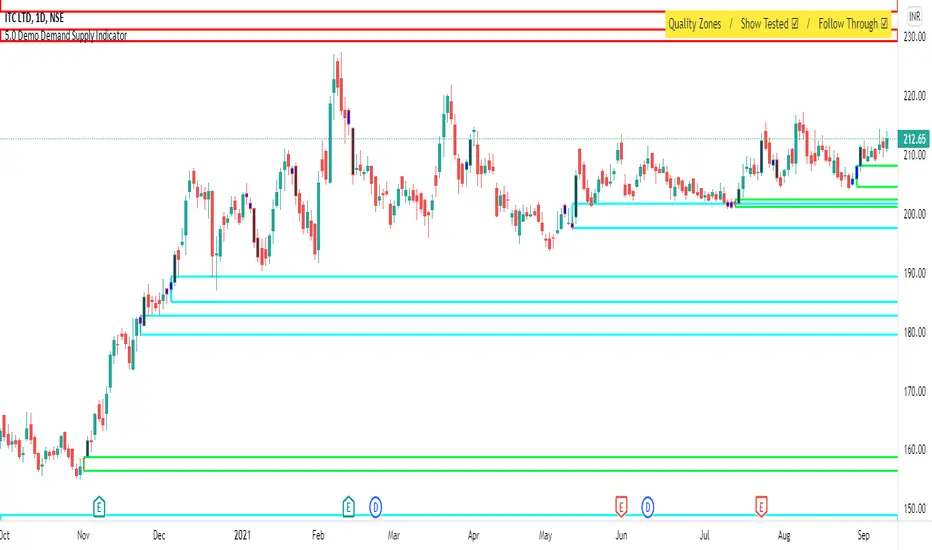
Demo - Demand Supply Zone IndicatorDemand Supply Zone indicator automatically pin points the demand and supply zone on the charts. The demo version will only identify zones on daily timeframe.
MMDVZ 1.0 - Moving Multi-Day VWAP ZonesVolatility adjusted moving multi-day VWAP zones
Directionality, trend and support/resistance levels at a glance
Useful for trading practically all kinds of stocks and futures.
Works well with many timeframes.
More updates to come, stay tuned

Smooth Moving Average Zones @PuppyTherapyThis script is basically a showcase of what you can graphically do to a moving average.
You have access to
2 sets of 4 moving averages each of those can use HA Candles as a source ( calculated in the script will not repaint if you are concerned with that )
additional smoothing to each set
a multitude of moving average types I am too lazy to type out ( please give me a thumbs up for honesty )
each moving average has a shade + zone
If you happen to like it and use just a few of those I would suggest you remove smoothing as it eats a lot of performance of making your own script of what you actually use to really bost with the performance. I am fully okay with you copying and sharing this idea. Just remember to share the colors!
PS: I would like to thank pinescripters RicardoSantos / LucF / everget !

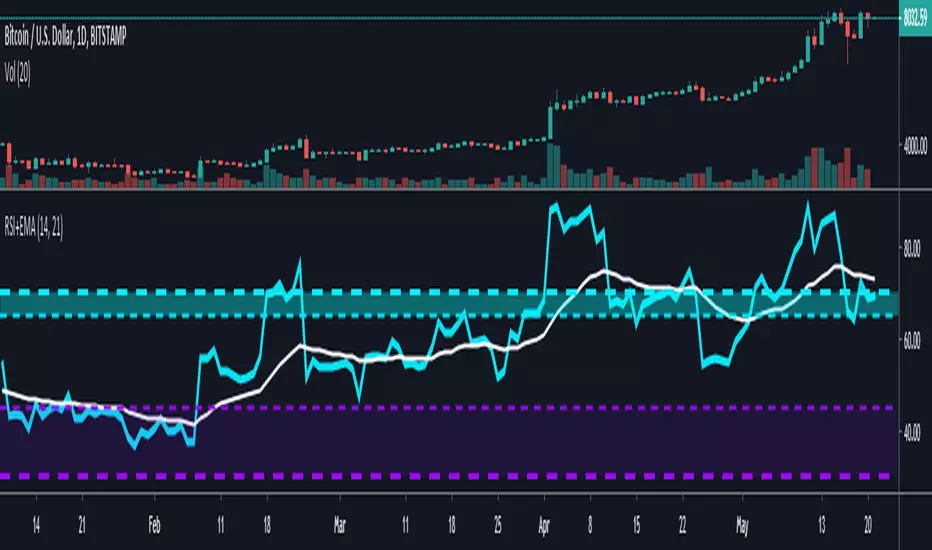
RSI + EMA with Multiple ZonesThis is your traditional RSI chart but with a few modifications
I added an extra zone parameter that you can specify with its own color and line customization.
There is an EMA that tracks the RSI as well.
Volume Zone OscillatorCopy Pasta from Investopedia
Interpretation
The VZO points to a positive trend when it rises above and maintains the 5% level, and a negative trend when it falls below the 5% level and fails to turn higher. Oscillations between the 5% and 40% levels mark a bullish trend zone, while oscillations between -40% and 5% mark a bearish trend zone. Meanwhile, readings above 40% signal an overbought condition, while readings above 60% signal an extremely overbought condition. Alternatively, readings below -40% indicate an oversold condition, which becomes extremely oversold below -60%.
The indicator panel shows horizontal lines that correspond with relative percentage levels that trigger buy and sell signals when crossed:
BUY OR COVER SIGNAL - cross from below to above the -40% line.
SELL OR SELL SHORT SIGNAL - cross from above to below the 40% line.
LESSER BUY OR COVER SIGNAL – cross from below to above the 5% line, but any subsequent violation adds a 7.5% buffer zone before the next buy signal.
A 14-period average directional index (ADX) can be used with the VZO, with values greater than 18 pointing to a trending market. A 60-period exponential moving average (EMA) is examined when ADX signals a trend, with price crossing above the moving average denoting a positive trend, while a downward crossover points to a bearish trend. These values should be tweaked and optimized by backtesting specific securities.
Price pattern and other indicators can be examined to confirm VZO buy or sell signals. Volume bars common on most price charts provides useful information in this regard, adding to signal reliability when bullish and bearish crosses align with two times or greater average volume. In addition, look for OBV to tick higher when the VZO has pushed above 50% and lower when it falls below that level. (For more, see: How to Use Volume to Improve Your Trading.)
And there are better uses for this Indicator than the above description ;)
happy trading

SMART4TRADER-Margin ZONEIndicator based on marginal zones (according to Mityukov Sergey). In open source.
Formula for calculating the margin:
Margin size / cost tick * minimum price change
Example:
EURUSD = 2100 $ / 6.25 $ * 0.00005 points = 0.01680 points
....
For currency pairs where USD is in the first place it is necessary to write so that the indicator is taken away from zero
Iff (ticker == "USDCAD", (0- (950/5 * 0.00005)),
//////////////////////////////////////////////////////////////////////////////////////////////////
Индикатор на основе маржинальных зон (по Митюкову Сергею). В открытом исходном коде.
Формула рассчета маржи:
размер маржи / стоимость тика * минимальное ценовое изменение
Пример:
EURUSD = 2100 $ / 6.25 $ * 0.00005 points = 0.01680 points
....
Для валютных пар где USD стоит на первом месте нужно писать так, чтобы показатель отнимался от нуля
iff (ticker=="USDCAD", (0-(950/5*0.00005)),
//////////////////////////////////////////////////////////////////////////////////////////////////

Zones Monitor V2Zones Monitor is a lightweight, reliable tool for tracking custom price zones on a single active symbol, with optional auto-mapping of zones to the current chart symbol. It focuses on stability and ease-of-use: minimal settings, clear visuals, and simple event logic (Touch & Breakout) that works smoothly without hitting TradingView’s object limits.

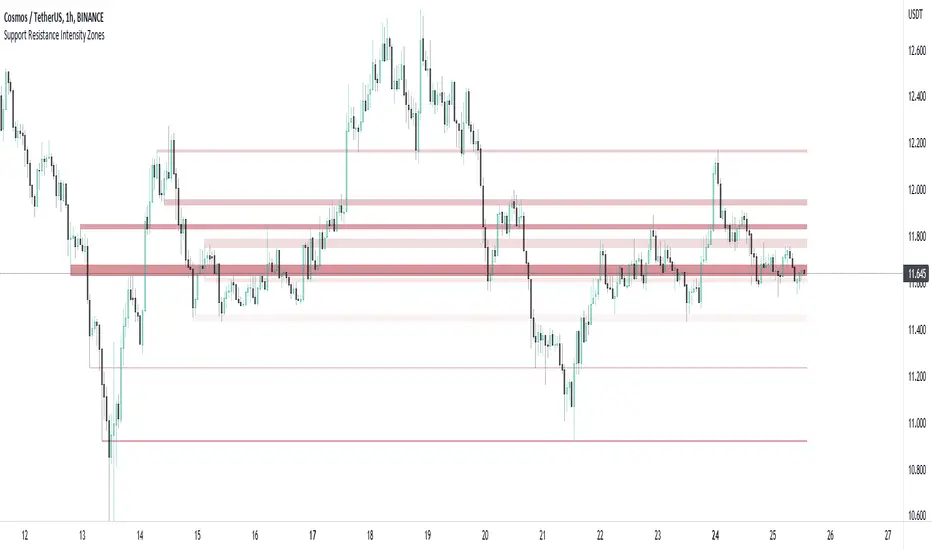
Support and Resistance Intensity ZonesSupport and resistance are often drawn using lines. This is too simple and doesn't give a clear idea of the market sentiment at these particular levels. What is strong support and resistance? What is weak support and resistance. How can either be defined by a single price point?
Using a simple, clean and configurable solution, this indicator not only shows these support and resistance levels as zones, it also gives them a colour gradient based on their intensity.
It does this by letting you choose the pivot highs and lows within a chosen range back. Then you choose one of two options to display how these multiple pivots at the same levels look. You can either group these pivots together into 'zones', where grouped pivots are all separated by a chosen price percentage, choosing how many zones to display, the most grouped pivots being the most intense colour.
Alternatively you display the pivots by 'gradient', where the closer the pivots are together in price the more intense the colour. As pivots diverge apart, the colour weakens.
Both of these options have to be seen to realise how much more there is to support and resistance than a single line.
MyAlgo ZULU ZONESPLEASE READ THE ENTIRE POST BEFORE PURCHASING & USING THE MyAlgo Tool. Saves you and me some time in emails and messages. :)
This is the official version of MyAlgo ZULU ZONES
PLEASE UNDERSTAND THAT THIS IS A DIFFERENT AND SEPARATE PRODUCT AND SCRIPT FROM "MyAlgo SLIM" FROM THE MyAlgo TRADING TOOL SERIES
Description
ZULU Zones is a rework of a long-gone development from the early stages of MyAlgo.
It is an oscillator, which indicates the best timing for reversal zones, yet also in the settings allows the user to adjust itself to the given asset and its usual retraces/reversals, so it is easier to spot the next incoming reversal.
Side Notes
MyAlgo is being updated and upgraded very frequently to suit the requests of our customers.
This is not financial advice. Please read our disclaimer before using it.
Please refer to the signature field if you are interested in gaining access to this script.
Anything below this sentence will be Updates regarding MyAlgo

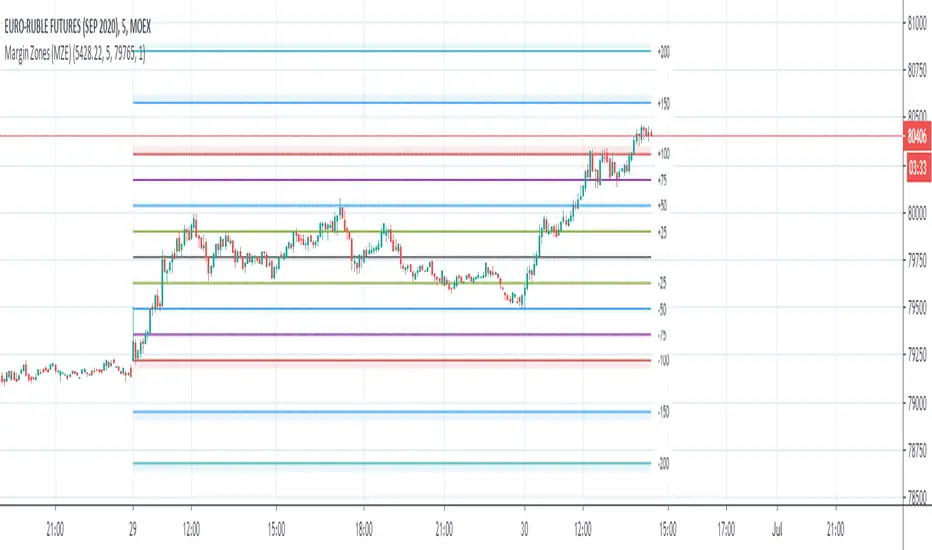
Margin Zones (MZE)Upgraded indicator Margin Zones with various number of options:
- Number of Days Ago to limit days when Zones are visible
- Price, margin and ticks can be set with decimal point
- Zones can be switched off separately
- all line are editable
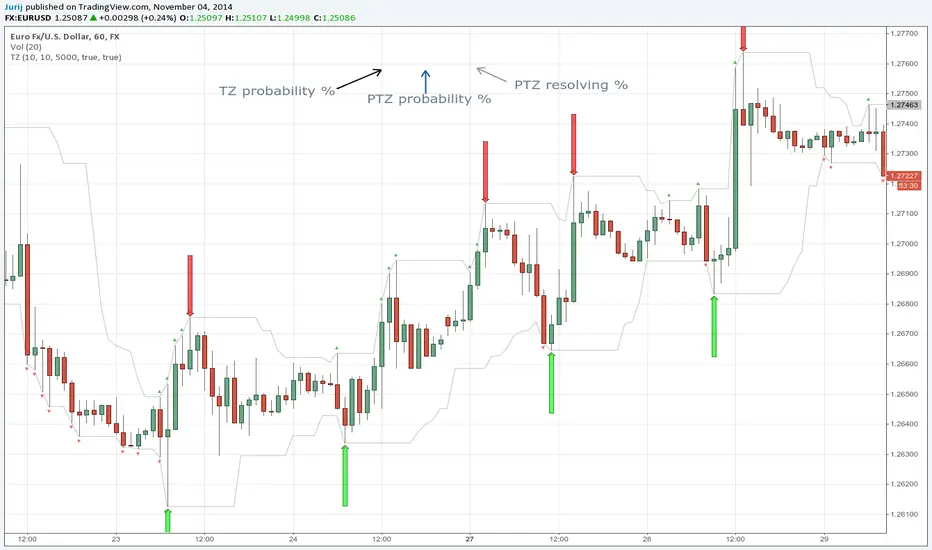
Transient Zones v1.1Simple indicator to visualize Transient Zones (TZ) and Potential Transient Zones (PTZ).
The last 3 numbers in the header represent: probability of true TZ (black), probability of PTZ (navy) and probability of PTZ resolving (gray).
Original ForexFactory thread by EURUSDD www.forexfactory.com
Version 1.1:
- Added TZ/PTZ occurrence probability thanks to SPYderCrusher
Todo:
- Mid bar transient zones detection
- Draw rectangles for zones (once rectangle drawing gets implemented in pine script) or use dot/circle lines
- Mark forming PTZs more clearly
Previous version 1.0:
Transient ZonesUpdated version 1.1:
Simple indicator to visualize Transient Zones (TZ) and Potential Transient Zones (PTZ).
Original ForexFactory thread by EURUSDD www.forexfactory.com
Todo:
- Mid bar transient zones detection
- Draw rectangles for zones (once rectangle drawing gets implemented in pine script)
- Mark forming PTZs more clearly

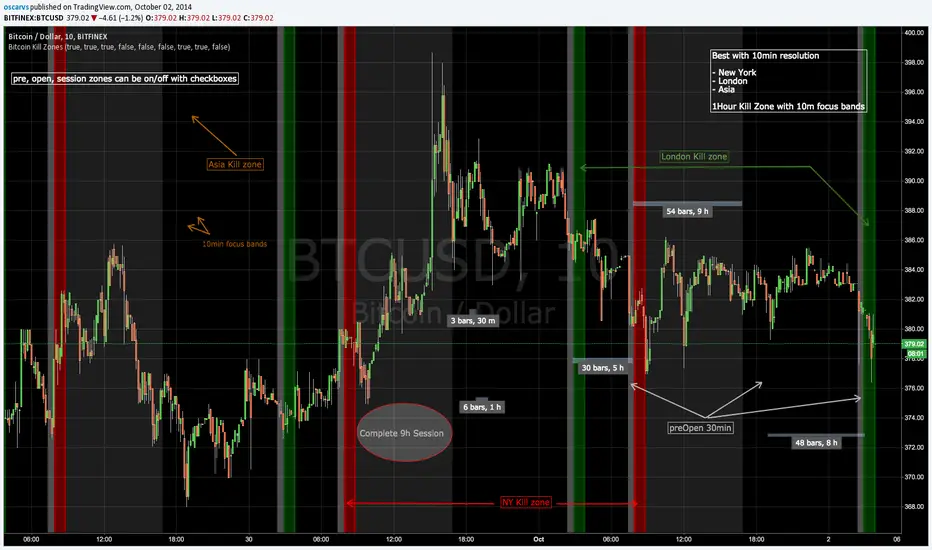
Bitcoin Kill ZonesGRAB THE LASTEST VERSION HERE:
*********************
This indicator shows when the candle is entering New York, London or Asia Kill Zone (open market).
gray: 30min before market opens.
red, green, orange: First 1 hour with 10min focus bands.
silver: complete 30min session market until close.
FIX NOTE:
Set this hours for Asia to fix the 1 hour difference:
2330-0000
0000-0010
0010-0050
0050-0100
0100-0900
* this is beta, in planning to mark dynamically ranges before/after open/close session and use some Fibs to have some ripple effect indicator
Updated code: github.com
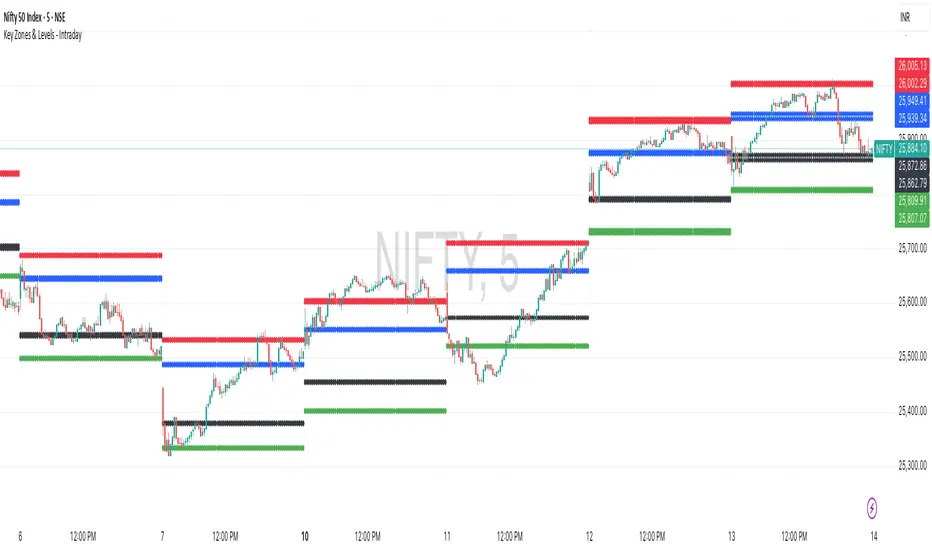
Key Zones & Levels - IntradayThis indicator provides key zones and levels for the day.
The levels are constant for the day and no re-painting.
The levels are plotted at 9:15pm IST for Indian stock market trading.
Use these levels with RSI for a perfect reversal setup with small stop loss.
Work perfectly for all types of market - Indices, stocks, commodity, futures.
Join my channel to support me - whatsapp.com
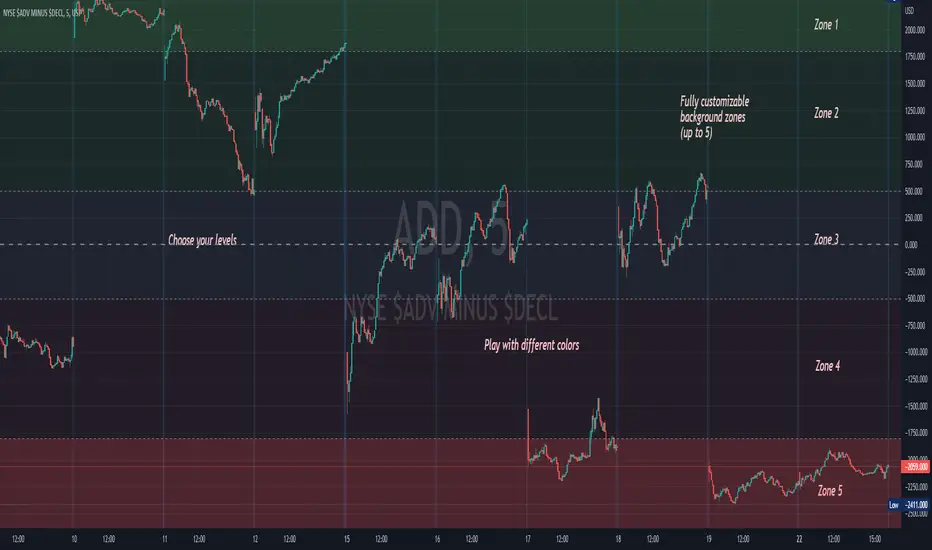
Background ZonesThis script provides up to 5 zones to apply background colors. This is especially useful for applying to indices such as USI:TICK , USI:ADD , and USI:VOLD , where certain levels provides significant meaning to market sentiment and directions. This script will give you the visual cue to help with your trading.
All levels and colors are fully customizable.
Enjoy~!!
Example:
NSDT Pivot ZonesThis is a new take on Traditional Pivot Points. By modifying the calculations, we were able to create "pivot zones" with a decent degree of accuracy.

(VIP) Contrarian Reversal Zones Script is showing potential reversal zones on chart, based on calculations of High/Low of selected period, smoothing it with selected type of Moving Average and applying Standard Deviation. Preferred to be used for contrarian traders. Another alternative usage would be to lock profit from open positions as this is very often early warning before reversal ahead.
If you're interested with access to indicator, please contact me via DM (private message) on Tradingview.com ;)

Bitcoin Logarithmic Growth Curves & ZonesI found this awesome script from @quantadelic and edited it to be a bit more legible for regular use, including coloured zones and removing the intercept / slope values as variables, to leave space for the fib levels in the indicator display. I hope you all like it.
