Trend CandlesThis indicator uses simple moving average and exponential moving average to calculate the trend of the symbols.
If the trend is BULL, the bars' color will be lime(green).
If the trend is BEAR, the bars' color will be black.
Otherwise, the bars' color will be gray.
Enjoy it!
Media mobile semplice (SMA)

Optimizer ~ Beta 0.1 | Belfort TradersOptimizer
The Optimizer backtests the maximum amount of moving averages which can be possible created ((max amount of bars / 2)-1) and compares them all with one another to then plot the most profitable strategy.
Current Achievement:
-> Get it to work, make it work with 106 different moving averages. ==> Beta 0.1
Roadmap:
0.15 Basic Comparison of 5k moving averages <= 07.06.22
0.2 Risk Management Basics <= 07.06.22
0.3 Finding the most profitable timeframe <= 07.06.22
0.4 Testing the limits of Tradingview <= 14.06.22
0.5 Complex array sorting list, comparing 1k moving averages, taking the most profitable out, going to the next list ==> Bypassing calculation limit by doing that. <= 14.06.22
0.6 Volatility adjusted moving averages <= 14.06.22
==> Find more likely profitable moving averages, run those first -> Increase efficiency
0.7 Add second filter (Either most profitable strategy or most reliable strategy) ==> Order Frequency Ratio <= 14.06.22
0.8 Complex Risk Management <= 14.06.22
0.9 Reliability Ratio weekly volatility average filter used as a protective filter if current weekly volume is drastically different from the past's weekly volatility average with fractal patterns
<= 21.06.22
1.0 Finished Optimizer
Portfolio Management for this Performance:
Initial Capital: 20000 USD
Risk per Trade: 10% of capital
Commission: 0.01%
Slippage: 4 ticks

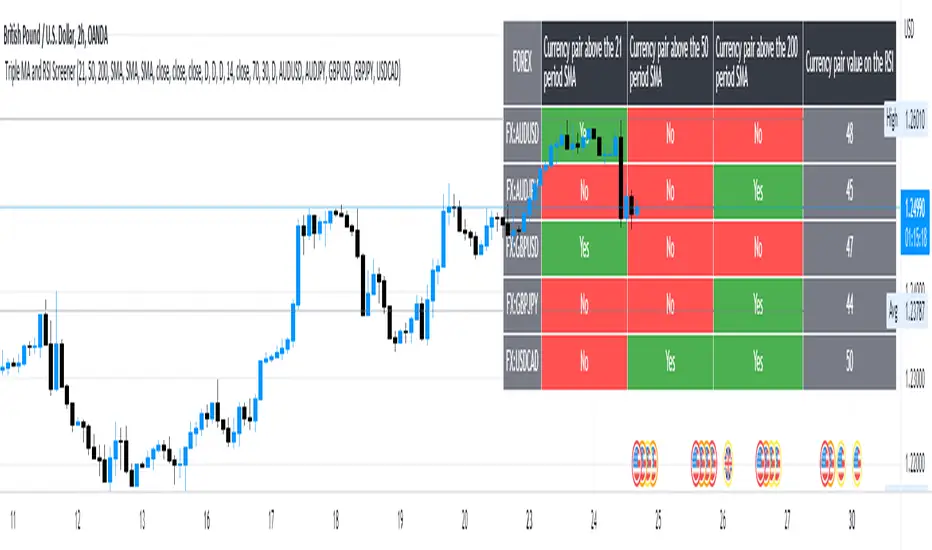
5 Symbol screener with triple MA and RSIBelow is a simple screener script fitted with 5 different symbols in the first column and in the other 4 columns the screener displays the respective moving averages and the RSI, the user has the ability to change between timeframes and different moving averages such as the SMA, EMA, RMA and WMA .
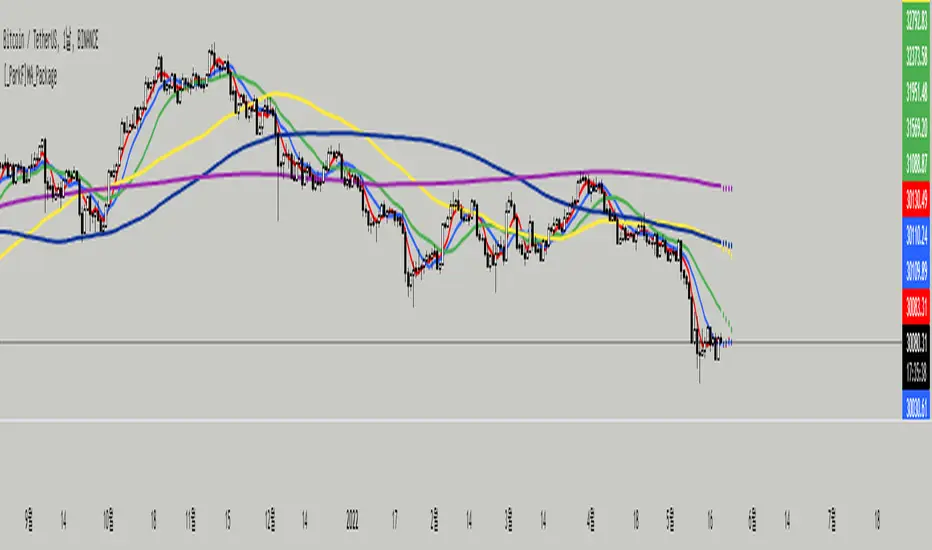
[_ParkF]MA_PackageThis indicator is a comprehensive set of moving averages.
All settings are handled in the input menu.
1. 6 moving averages are included.
2. You can edit the source of 6 moving averages.
3. You can change the type of each moving average line.
4. You can change the period value of each moving average line.
5. You can change the color of each moving average line.
6. You can change the thickness of each moving average line.
7. The predictive value of each moving average line will be displayed as a dot, and this value will be changed according to the type of the moving average line.
--------------------------------------------------------------------------------------------------------------------------------------------------------------------------------------------------------
이 지표는 이동평균선의 종합선물세트 입니다.
모든 설정은 input 메뉴에서 다뤄집니다.
1. 6개의 이동평균선이 포함 되어 있습니다.
2. 6개의 이동평균선의 소스를 수정할 수 있습니다.
3. 각각의 이동평균선의 타입을 변경할 수 있습니다.
4. 각각의 이동평균선의 기간값을 변경할 수 있습니다.
5. 각각의 이동평균선의 색상을 변경할 수 있습니다.
6. 각각의 이동평균선의 두께를 변경할 수 있습니다.
7. 각각의 이동평균선의 예측값이 점으로 표시될 것이고 이 값은 해당 이동평균선의 타입에 맞춰 변경됩니다.
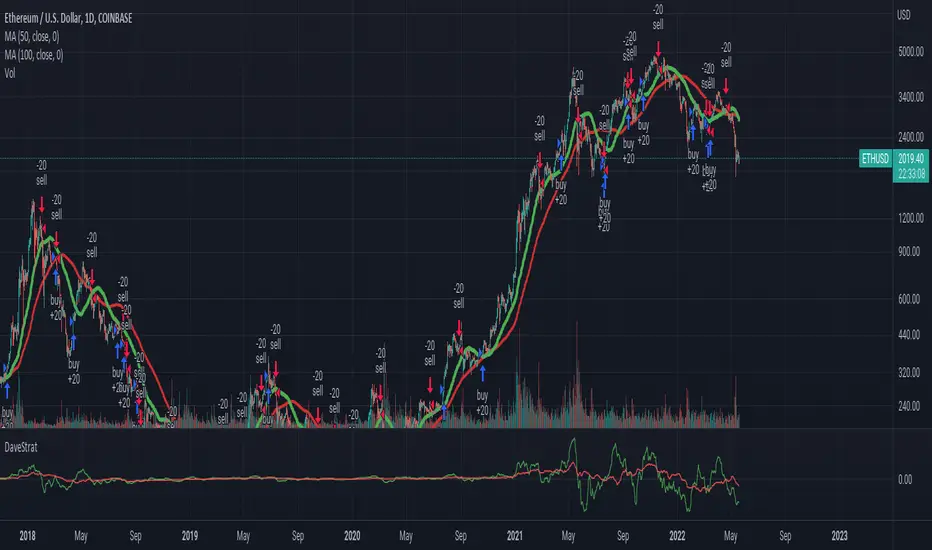
DaveStratThis script attempts to guess inflection points in cryptocurrency asset prices using change in two simple moving averages on the daily timescale.
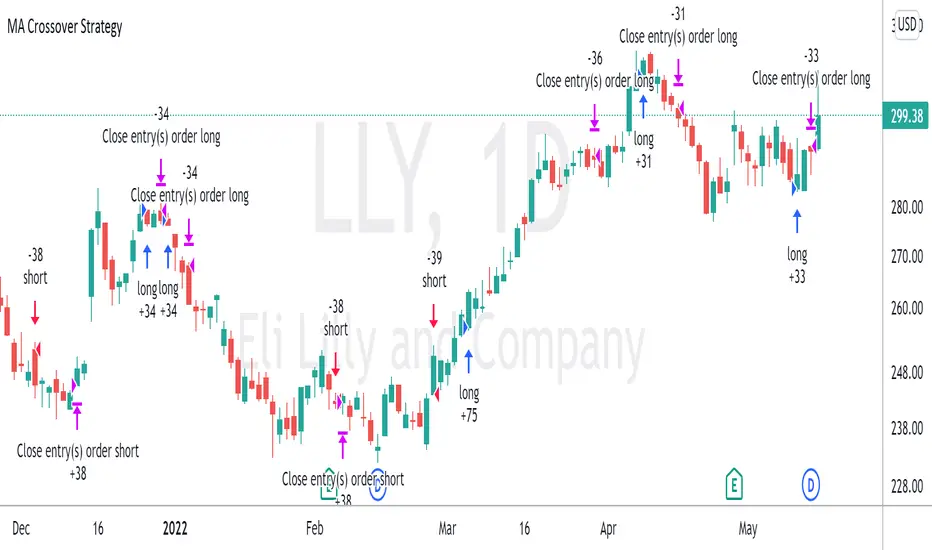
Moving Average Crossover StrategyThe Moving Average Crossover indicator uses 3 moving averages (2 simple moving averages and 1 exponential moving average ) to signal long and short opportunities based on moving average crossovers. This strategy serves as a backtest to that indicator. By taking entry and exit positions based on moving average crossovers, we are able to project profit with this script. You are given the option to select which moving average crossings trigger entry and exit signals. Fast refers to an EMA which should be your shortest MA. Slow refers to the first SMA which will serve as a signal line. Trend refers to a long SMA which will help determine if you should take long positions or short. You can also filter by extra conditions such as minimum volume or RSI. For example, you may have the script trigger a buy signal if the 5ema crosses the 20 sma while RSI reads 60 and sell if it crosses again.
This strategy starts with $100,000 and uses 10% of the account per trade.
Distance to 200 SMAThis indicator shows the relative distance (in %) from the closing price to the 200 SMA.

Vegas+200+Big Vol by RSU1. Vegas channel
The Vegas channel indicator is very effective as a short, medium and long-term trend observation indicator, and it has obvious support and resistance functions.
2. EMA200+MA200
Usually ema200 or ma200 is used as a watershed for fund institutions to evaluate the long-short trend of a stock trend.
3. Big volume box
Big volume is often used as a signal of a market trend turning,if it is greater than 4 times standard deviation it is marked as a Big volume in yellow box. There will be support and resistance at this price range.

Midas Mk. II - Ultimate Crypto Swing>> This scrip is only meant to be used in 4hour crypto chart <<
How It Works - To swing trade in a 4 hr candles, which has a much larger range than shorter timeframe candles, the script utilizes a longer timeframe ema, sma and MACDs to account for such. When the ema and sma crosses and the rate of change of the MACD histogram is in favor of the direction, then the system provides a long/short signal.
How To Use - The script works the best when the signal is in par with other analyses (trend, harmonic patterns, etc.) This script does not provide any exit signals , so I recommend exiting when the candle breaks out of the structure, or other strategies.
Updates or revisions will be recorded in the comments. Good luck with this script!

Estrategia Larry Connors [JoseMetal]============
ENGLISH
============
- Description:
This strategy is based on the original Larry Connors strategy, using 2 SMAs and RSI.
The strategy has been optimized for better total profit and works better on 4H (tested on BTCUSDT).
LONG:
Price must be ABOVE the slow SMA.
When a candle closes in RSI oversold area, the next candle closes out of the oversold area and the closing price is BELOW the fast SMA = open LONG.
LONG is closed when a candle closes ABOVE the fast SMA.
SHORT:
Price must be BELOW the slow SMA.
When a candle closes in RSI overbought area, the next candle closes out of the overbought area and the closing price is ABOVE the fast SMA = open SHORT.
SHORT is closed when a candle closes BELOW the fast SMA.
*Larry Connor's strategy does NOT use a fixed Stop Loss or Take Profit, as he said, that reduces performance significantly.
- Visual:
Both SMAs (fast and slow) are shown in the chart.
By default, the fast SMA is aqua color, the slow changes between green and red depending on the "trend" (price over slow SMA = bullish, below = bearish).
RSI can't be shown because TradingView doesn't allow to show both overlay and panel indicators, so candles get a RED color when RSI is in OVERBOUGHT area and GREEN when they're on OVERSOLD area to help with that.
Background is colored when conditions are met and a position is going to be open, green for LONGs red for SHORTs.
- Usage and recommendations:
As this is a coded strategy, you don't even have to check for indicators, just open and close trades as the strategy shows.
The original strategy uses a 5 period SMA instead of the 10, and 10/90 for oversold/overbought levels, this has been optimized after the testings and results but feel free to change settings and test by yourself.
Also, the original strategy was developed for daily, but seems to work better en 4H.
- Customization:
As usual I like to make as many aspects of my indicators/strategies customizable, indicators, colors etc., feel free to ask if you feel that something that should be configurable is missing or if you have any ideas to optimize the strategy.
============
ESPAÑOL
============
- Descripción:
Esta estrategia está basada en la estrategia original de Larry Connors, utilizando 2 SMAs y RSI.
La estrategia ha sido optimizada para un mejor beneficio total y funciona mejor en 4H (probado en BTCUSDT).
LONG:
El precio debe estar por encima de la SMA lenta.
Cuando una vela cierra en la zona de sobreventa del RSI, la siguiente vela cierra fuera de la zona de sobreventa y el precio de cierre está POR DEBAJO de la SMA rápida = abre LONG.
Se cierra cuando una vela cierra POR ENCIMA de la SMA rápida.
SHORT:
El precio debe estar POR DEBAJO de la SMA lenta.
Cuando una vela cierra en la zona de sobrecompra del RSI, la siguiente vela cierra fuera de la zona de sobrecompra y el precio de cierre está POR ENCIMA de la SMA rápida = abre SHORT.
Se cierra cuando una vela cierra POR DEBAJO de la SMA rápida.
*La estrategia de Larry Connor NO utiliza un Stop Loss o Take Profit fijo, como él dijo, eso reduce el rendimiento significativamente.
- Visual:
Ambas SMAs (rápida y lenta) se muestran en el gráfico.
Por defecto, la SMA rápida es de color aqua, la lenta cambia entre verde y rojo dependiendo de la "tendencia" (precio por encima de la SMA lenta = alcista, por debajo = bajista).
El RSI no puede mostrarse porque TradingView no permite mostrar tanto los indicadores superpuestos como los del panel, así que las velas obtienen un color ROJO cuando el RSI está en el área de SOBRECOMPRA y VERDE cuando están en el área de VENTA para ayudar a ello.
El fondo se colorea cuando se cumplen las condiciones y se va a abrir una posición, verde para LONGs rojo para SHORTs.
- Uso y recomendaciones:
Como se trata de una estrategia ya programada, ni siquiera hay que comprobar los indicadores, sólo hay que abrir y cerrar las operaciones tal y como muestra la estrategia en el gráfico.
La estrategia original utiliza una SMA de 5 periodos en lugar de 10, y 10/90 para los niveles de sobreventa/sobrecompra, esto ha sido optimizado después de las pruebas y los resultados, pero sé libre de cambiar la configuración y probarla por sí mismo.
Además, la estrategia original fue desarrollada para diario, pero parece funcionar mejor en 4H.
- Personalización:
Como siempre me gusta hacer personalizables todos los aspectos de mis indicadores/estrategias, indicadores, colores, etc., preguntar si notas que falta algo que debería ser configurable o si tienes alguna idea para optimizar la estrategia.

Dashed Line Moving AveragesHere's a simple script which i concocted using ideas from various authors with the goal of creating a slightly better Moving Average dashed line script imo...I think i managed to do just that and a bit more.. =)
Features:
- Contains one of each VWMA SMA EMA. You can set the input length.
- Ability to set spacing between characters of the plotted moving average line
- Horizontal offset of the moving average lines (just in case)
- Can add any fancy characters that suits your taste e.g ( . , _ , -, !, *, rocket, lava, etc) to the moving average
- If you duplicate the script and modify the "Size" parameter of the plotchar() function's variables with the choices provided in the commented-out code; you can have some fun!
This script is for entertainment & educational purposes only.

HEX Risk Metric (v0.2)This indicator plots a "risk metric" based on the % increases of the following averages:
ema21, sma50, sma100, sma200, sma300, sma600.
Depending on the rolling 7-day percentage increase of this moving average, a value is assigned to each data point, then normalized to a common range.
This set of metrics attempts to represent data similar to that of a heat map.
Users can adjust filter top, filter bottom, and toggle on/off the different metrics within the set.
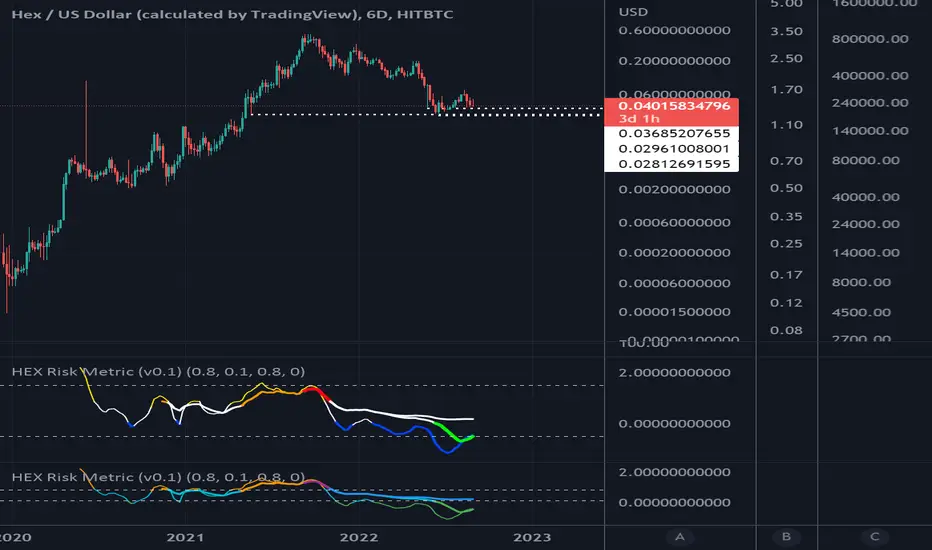
HEX Risk Metric (v0.1)This indicator plots a "risk metric" based on the % increases of the following averages:
ema21, sma50, sma100, sma200, sma300, sma600.
Depending on the rolling 7-day percentage increase of this moving average, a value is assigned to each data point, then normalized to a common range.
This set of metrics attempts to represent data similar to that of a heat map.
Users can adjust filter top, filter bottom, and toggle on/off the different metrics within the set.

Moving Averages With Cross AlertsA simple way to add up to 5 moving averages with optional crossover/crossunder alerts.
Available options for Moving Average Type are:
SMA
EMA (default)
HMA
RMA
WMA
VWMA
VWAP
ALMA
By default, 5 moving averages are enabled and set to the following:
MA1 set to 5
MA2 set to 13
MA3 set to 50
MA4 set to 200
MA5 set to 800
Each moving average has the following options:
Enable/Disable
Source (default is close)
Length
Color
Any 8 Moving Averages - Alerts, Clouds & PercentagesANY 8 MOVING AVERAGES WITH ALERTS, COLOR CHANGING CLOUDS AND PERCENTAGE GAPS
This is a fully customizable moving average cloud with alerts. It has 8 moving averages that can be individually set to any type such as: EMA, SMA, HMA, WMA, VWMA & RMA. Each moving average paints green when price is above it and paints red when price is below it. They include colored clouds between the price and each moving average as well.
You can individually change the length, colors, type of moving average and turn them off for those of you that only want a few moving averages on your chart at once.
There is also a percentage gap table that tells you how far away the price is from each moving average which are labeled accordingly.
You can also set alerts for when price crosses each moving average.
***HOW TO USE***
When all the moving averages are green, buy dips down to the next lower moving average. When all the moving averages are red, short the tops up to the next moving average.
Trade in the direction of the trend and wait for all lines to turn one color before taking trades in that direction.
Make sure there is a big enough percentage gap to the next moving average before taking a trade.
***MARKETS***
This indicator can be used as a signal on all markets, including stocks, crypto, futures and forex.
***TIMEFRAMES***
This moving average can be used on all timeframes.
***TIPS***
Try using numerous indicators of ours on your chart so you can instantly see the bullish or bearish trend of multiple indicators in real time without having to analyze the data. Some of our favorites are our Auto Fibonacci, Directional Movement Index + Fisher Price Action, Volume Profile With Buy & Sell Pressure, Auto Support And Resistance and Money Flow Index in combination with this moving average cloud. They all have unique features to help you make better and faster trading decisions.

SMA - XfactorUsing 2 minutes chart with these indicators.
When the 20 crossed up 200 SMA, it's a buy signal for calls and vice versa. Also, Using 9 sma and 50 sma as indicators to cut or take profit. When the candle close under 9 sma, it's time to cut. or you can let it run until 50 sma as an absolute profit taking/cutting loss.

Simple Moving Averages - XfactorUsing this script in 2 minutes chart. When 20 SMA crosses over 200 sma, it's a buy signal. Also, using 9 and 50 sma as a signal to take profit and cut loss.
For example 20 SMA crosses up 200 SMA it's a buy then if the candle closes under 9 SMA we can cut.

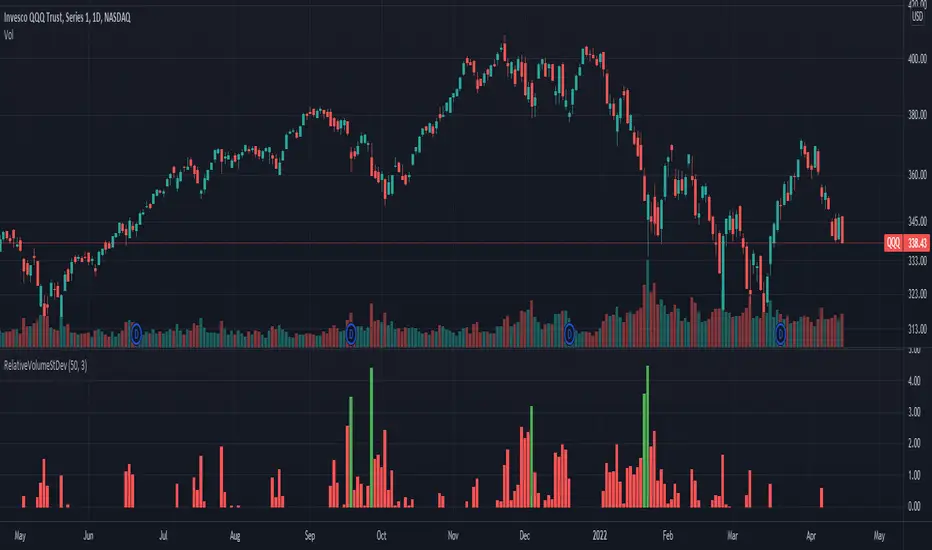
Relative Volume Standard DeviationThis indicator, developed by Melvin E. Dickover, calculates the difference between the volume and its simple moving average, but expressed as a ratio in standard deviations.
The plotted bars become green when the volume is unusually large (configurable).
Mikolaj Zakrzowski - Adjusted Mayer MultipleAuthor - Publication: Mikołaj Zakrzowski, Marek Zatwarnicki
Author - Algorithm: Mikołaj Zakrzowski
Author - Code: Marek Zatwarnicki, Derek Gruening
Inspired by: Mayer Multiple by Trace Mayer
Category: Technical Analysis
Type: Indicator
Timeframe: 1D Only
Index: INDEX:BTCUSD Only
About:
According to Willy Woo Mayer Multiple is "A way to gauge the current price of Bitcoin against its long range historical price movements (200 day moving average), the Mayer Multiple highlights when Bitcoin is overbought or oversold in the context of longer time frames".
My friend, Mikolaj Zakrzowski, decided to modify and adjust this indicator so that it could be normalized. This procedure allows for easier interpretation, and clear signals of the end of the ups and downs of a given Bitcoin cycle.
How to use:
BUY - Buy some Bitcoin , when label on last candle shows "Buy".
SELL- Sell some Bitcoin , when label on last candle shows "Sell".
Formula:
- Mayer Multiple - Close / ta. sma (close, 200)
- Formula for normalization is an intellectual property of Mikolaj Zakrzowski.
Overfitting: The presented algorithm is characterized by log regresion determined as of 01/01/2022. Tests with historical data show that the algorithm is very likely to work equally well the following years.
Disclaimer: Past good results do not guarantee future trading success. Please use the algorithm with caution and support it with your knowledge. Published algorithm decisions are not financial advice.

4 EMA & 2 SMA Gen6Indicador hecho con mucho cariño para la comunidad de CRIPTO BUZZ.
Espero les sirva Mucho y puedan ahorrarse espacios de indicadores. Luis S. G6

Staple MAsThis is a useful indicator which allows you to plot multiple common predefined Moving Averages (Ema and Sma). Here are some of its features:
Ability to quickly display many common EMAs and SMAs.
Multiple timeframes.
Descriptive labels to avoid misreading.
Simple and well-organized Input Tab.

RinarBottombuyRSI, VWMA, MA.
Altcon bottom signals.
buy
White background - bottom point
Yellow - Buy zone
White triangles - a signal to place orders
Sell
Red - sale
RU
RSI , VWMA , MA.
Сигналы дна альтконов.
Buy
Белый фон -точка дна
Желтый - Зона покупки
Белые треугольники - сигнал выставить ордера
Sell
Красный - продажа

Bogdan Ciocoiu - CoordinatorDescription
The Coordinator is an indicator developed on the back of the RSI algorithm, modified substantially to form a cloud. In addition, the Coordinator uses EMA/SMA to compare the location of the RSI cloud with the chosen moving averages (EMA vs SMA).
This indicator is helpful as it confirms when a trader should enter a position or exit based on the proximity of the RSI cloud to the relevant MA.
Uniqueness
The Coordinator provides unique benefits, including:
It shows the strength of the RSI in the shape of the RSI cloud, using two sets of dimensions (one more long term and one more short-term oriented).
It indicates the positioning of the RSI cloud in conjunction with the relevant moving averages to help traders remain in positions for longer.
It shows the RSI 14 (useful when spotting divergences aligned with the price action).
Open-source
The Coordinator uses the following open-source scripts:
www.tradingview.com
