MA OrderlinessMA Orderliness measures how well a series of simple moving averages (SMAs) are stacked in the expected order for a trending market and turns that measurement into a normalized oscillator. You choose how many MAs to include and the shortest and longest lengths. The script generates a family of evenly spaced SMAs between those lengths, then compares each pair: shorter MAs should lie above longer ones in an uptrend and below in a downtrend. When any pair is out of order, a “violation” score is accumulated, but violations between nearby MAs count more heavily than those between MAs that are far apart. All weights are summed, and the total weighted violations are converted into a score from –1 (completely reversed) to +1 (perfectly ordered).
This orderliness score is plotted as a line oscillator. A fixed horizontal line at +1 marks perfect order, and another at –1 marks perfect reversal. To smooth the raw oscillator and generate trading signals, the script also plots a simple moving average of the orderliness score over a user-defined period. When the unsmoothed score crosses above its moving average, a bullish crossover alert fires. When it crosses below, a bearish crossover alert fires.
Everything is calculated on each bar so you can see the oscillator evolve in real time. You can customize the number of MAs, their minimum and maximum lengths, and the length of the signal-line SMA to suit different timeframes or markets.
Media mobile semplice (SMA)

DECODE Moving Average ToolkitDECODE Moving Average Toolkit: Your All-in-One MA Analysis Powerhouse!
This versatile indicator is designed to be your go-to solution for analysing trends, identifying potential entry/exit points, and staying ahead of market movements using the power of Moving Averages (MAs).
Whether you're a seasoned trader or just starting out, the Decode MAT offers a comprehensive suite of features in a user-friendly package.
Key Features:
Multiple Moving Averages: Visualize up to 10 Moving Averages simultaneously on your chart.
Includes 5 Exponential Moving Averages (EMAs) and 5 Simple Moving Averages (SMAs).
Easily toggle the visibility of each MA and customize its length to suit your trading style and the asset you're analyzing.
Dynamic MA Ribbons: Gain a clearer perspective on trend direction and strength with 5 configurable MA Ribbons.
Each ribbon is formed between a corresponding EMA and SMA (e.g., EMA 20 / SMA 20).
The ribbon color changes to indicate bullish (e.g., green) or bearish (e.g., red) sentiment, providing an intuitive visual cue.
Toggle ribbon visibility with a single click.
Powerful Crossover Alerts: Never miss a potential trading opportunity with up to 5 customizable MA Crossover Alerts.
Define your own fast and slow MAs for each alert from any of the 10 available MAs.
Receive notifications directly through TradingView when your specified MAs cross over or cross under.
Optionally display visual symbols (e.g., triangles ▲▼) directly on your chart at the exact crossover points for quick identification.
Highly Customizable:
Adjust the source price (close, open, etc.) for all MA calculations.
Fine-tune the appearance (colors, line thickness) of every MA line, ribbon, and alert symbol to match your charting preferences.
User-Friendly Interface: All settings are neatly organized in the indicator's input menu, making configuration straightforward and intuitive.
How Can You Use the Decode MAT in Your Trading?
This toolkit is incredibly versatile and can be adapted to various trading strategies:
Trend Identification:
Use longer-term MAs (e.g., 50, 100, 200 period) to identify the prevailing market trend. When prices are consistently above these MAs, it suggests an uptrend, and vice-versa.
Observe the MA ribbons: A consistently green ribbon can indicate a strong uptrend, while a red ribbon can signal a downtrend. The widening or narrowing of the ribbon can also suggest changes in trend momentum.
Dynamic Support & Resistance:
Shorter-term MAs (e.g., 10, 20 period EMAs) can act as dynamic levels of support in an uptrend or resistance in a downtrend. Look for price pullbacks to these MAs as potential entry opportunities.
Crossover Signals (Entries & Exits):
Golden Cross / Death Cross: Configure alerts for classic crossover signals. For example, a 50-period MA crossing above a 200-period MA (Golden Cross) is often seen as a long-term bullish signal. Conversely, a 50-period MA crossing below a 200-period MA (Death Cross) can be a bearish signal.
Shorter-Term Signals: Use crossovers of shorter-term MAs (e.g., EMA 10 crossing EMA 20) for more frequent, shorter-term trading signals. A fast MA crossing above a slow MA can signal a buy, while a cross below can signal a sell.
Use the on-chart symbols for quick visual confirmation of these crossover events.
Confirmation Tool:
Combine the Decode MAT with other indicators (like RSI, MACD, or volume analysis) to confirm signals and increase the probability of successful trades. For instance, a bullish MA crossover combined with an oversold RSI reading could strengthen a buy signal.
Multi-Timeframe Analysis:
Apply the toolkit across different timeframes to get a broader market perspective. A long-term uptrend on the daily chart, confirmed by a short-term bullish crossover on the 1-hour chart, can provide a higher-confidence entry.
The DECODE Moving Average Toolkit empowers you to tailor your MA analysis precisely to your needs.

SMA Backtest Optimizer [Mr_Rakun]The SMA Backtest Optimizer is a powerful Pine Script tool designed to systematically analyze and compare various Simple Moving Average (SMA) periods to identify the most profitable configuration for trading strategies. This indicator tests multiple SMA periods (from 10 to 100) using a crossover strategy where buys occur when price crosses above the SMA and sells when price crosses below it.
Key Features:
Tests 10 different SMA periods to determine optimal settings
Calculates profit/loss based on a defined starting capital
Tracks total profit and number of trades for each period
Visually highlights the best performing SMA on your chart
Displays comprehensive results in an easy-to-read table
Labels the chart with key performance metrics
This code serves as a core framework that traders can customize for their specific needs. You can easily modify the strategy parameters, test different technical indicators, adjust capital settings, or implement more complex entry/exit rules. The optimization methodology can be applied to virtually any trading approach you wish to evaluate.
Feel free to adapt this framework to test your own trading ideas and discover which parameters work best in different market conditions.

Dskyz (DAFE) GENESIS Dskyz (DAFE) GENESIS: Adaptive Quant, Real Regime Power
Let’s be honest: Most published strategies on TradingView look nearly identical—copy-paste “open-source quant,” generic “adaptive” buzzwords, the same shallow explanations. I’ve even fallen into this trap with my own previously posted strategies. Not this time.
What Makes This Unique
GENESIS is not a black-box mashup or a pre-built template. It’s the culmination of DAFE’s own adaptive, multi-factor, regime-aware quant engine—built to outperform, survive, and visualize live edge in anything from NQ/MNQ to stocks and crypto.
True multi-factor core: Volume/price imbalances, trend shifts, volatility compression/expansion, and RSI all interlock for signal creation.
Adaptive regime logic: Trades only in healthy, actionable conditions—no “one-size-fits-all” signals.
Momentum normalization: Uses rolling, percentile-based fast/slow EMA differentials, ALWAYS normalized, ALWAYS relevant—no “is it working?” ambiguity.
Position sizing that adapts: Not fixed-lot, not naive—not a loophole for revenge trading.
No hidden DCA or pyramiding—what you see is what you trade.
Dashboard and visual system: Directly connected to internal logic. If it’s shown, it’s used—and nothing cosmetic is presented on your chart that isn’t quantifiable.
📊 Inputs and What They Mean (Read Carefully)
Maximum Raw Score: How many distinct factors can contribute to regime/trade confidence (default 4). If you extend the quant logic, increase this.
RSI Length / Min RSI for Shorts / Max RSI for Longs: Fine-tunes how “overbought/oversold” matters; increase the length for smoother swings, tighten floors/ceilings for more extreme signals.
⚡ Regime & Momentum Gates
Min Normed Momentum/Score (Conf): Raise to demand only the strongest trends—your filter to avoid algorithmic chop.
🕒 Volatility & Session
ATR Lookback, ATR Low/High Percentile: These control your system’s awareness of when the market is dead or ultra-volatile. All sizing and filter logic adapts in real time.
Trading Session (hours): Easy filter for when entries are allowed; default is regular trading hours—no surprise overnight fills.
📊 Sizing & Risk
Max Dollar Risk / Base-Max Contracts: All sizing is adaptive, based on live regime and volatility state—never static or “just 1 contract.” Control your max exposures and real $ risk. ATR will effect losses in high volatility times.
🔄 Exits & Scaling
Stop/Trail/Scale multipliers: You choose how dynamic/flexible risk controls and profit-taking need to be. ATR-based, so everything auto-adjusts to the current market mode.
Visuals That Actually Matter
Dashboard (Top Right): Shows only live, relevant stats: scoring, status, position size, win %, win streak, total wins—all from actual trade engine state (not “simulated”).
Watermark (Bottom Right): Momentum bar visual is always-on, regime-aware, reflecting live regime confidence and momentum normalization. If the bar is empty, you’re truly in no-momentum. If it glows lime, you’re riding the strongest possible edge.
*No cosmetics, no hidden code distractions.
Backtest Settings
Initial capital: $10,000
Commission: Conservative, realistic roundtrip cost:
15–20 per contract (including slippage per side) I set this to $25
Slippage: 3 ticks per trade
Symbol: CME_MINI:NQ1!
Timeframe: 1 min (but works on all timeframes)
Order size: Adaptive, 1–3 contracts
No pyramiding, no hidden DCA
Why these settings?
These settings are intentionally strict and realistic, reflecting the true costs and risks of live trading. The 10,000 account size is accessible for most retail traders. 25/contract including 3 ticks of slippage are on the high side for NQ, ensuring the strategy is not curve-fit to perfect fills. If it works here, it will work in real conditions.
Why It Wins
While others put out “AI-powered” strategies with little logic or soul, GENESIS is ruthlessly practical. It is built around what keeps traders alive:
- Context-aware signals, not just patterns
- Tight, transparent risk
- Inputs that adapt, not confuse
- Visuals that clarify, not distract
- Code that runs clean, efficient, and with minimal overfitting risk (try it on QQQ, AMD, SOL, etc. out of the box)
Disclaimer (for TradingView compliance):
Trading is risky. Futures, stocks, and crypto can result in significant losses. Do not trade with funds you cannot afford to lose. This is for educational and informational purposes only. Use in simulation/backtest mode before live trading. No past performance is indicative of future results. Always understand your risk and ownership of your trades.
This will not be my last—my goal is to keep raising the bar until DAFE is a brand or I’m forced to take this private.
Use with discipline, use with clarity, and always trade smarter.
— Dskyz , powered by DAFE Trading Systems.

Market SurferOverview
If you're ready to surf the charts, Market Surfer is your perfect board 🏄♂️
This is my personal go-to indicator, designed to be a true Swiss Army knife for technical analysis - packed with powerful tools that deliver clear signals straight out of the box.
Market Surfer is heavily inspired by Market Cipher and Traders Reality .
Key Features
Market Waves : Visual representation of cyclical price movements to identify trend strength and potential reversals.
Money Flow : Highlights periods of buying and selling pressure, signaling shifts in market sentiment.
Trend Tracker : Real-time trend detection powered by EMA-based analysis, with color-coded signals for bullish and bearish phases.
Vector Candles : Enhanced candle coloring that indicates when market makers and high-frequency traders join the game, helping to identify significant market moves.
Dynamic Alerts : Configurable alerts for key market events, including trend changes, money flow transitions, and vector candle formations.
How It Works
Wave Theory Analysis : Detects cyclical market movements to highlight potential trend continuations or reversals.
PVSRA Analysis : Identifies vector candles when volume surges significantly relative to historical averages, indicating the presence of large institutional players.
EMA Trend Tracking : Tracks the 50-period EMA to determine overall market momentum and colorizes bars accordingly.
Money Flow Indexing : Uses Heikin-Ashi candle structures to measure buying and selling intensity over time.
Recommendations
Although Market Surfer is versatile and works across all markets and timeframes, I recommend:
Use it on 1H timeframe for mid-term trades and 1D timeframe for long-term ones.
Buy when green and sell when red - keep it simple.
Study vector candles before relying on them - they reveal institutional footprints.
Do not use leverage - trade with clarity and peace of mind.
And most importantly - sleep well.

Best SMA FinderThis script, Best SMA Finder, is a tool designed to identify the most robust simple moving average (SMA) length for a given chart, based on historical backtest performance. It evaluates hundreds of SMA values (from 10 to 1000) and selects the one that provides the best balance between profitability, consistency, and trade frequency.
What it does:
The script performs individual backtests for each SMA length using either "Long Only" or "Buy & Sell" logic, as selected by the user. For each tested SMA, it computes:
- Total number of trades
- Profit Factor (total profits / total losses)
- Win Rate
- A composite Robustness Score, which integrates Profit Factor, number of trades (log-scaled), and win rate.
Only SMA configurations that meet the user-defined minimum trade count are considered valid. Among all valid candidates, the script selects the SMA length with the highest robustness score and plots it on the chart.
How to use it:
- Choose the strategy type: "Long Only" or "Buy & Sell"
- Set the minimum trade count to filter out statistically irrelevant results
- Enable or disable the summary stats table (default: enabled)
The selected optimal SMA is plotted on the chart in blue. The optional table in the top-right corner shows the corresponding SMA length, trade count, Profit Factor, Win Rate, and Robustness Score for transparency.
Key Features:
- Exhaustive SMA optimization across 991 values
- Customizable trade direction and minimum trade filters
- In-chart visualization of results via table and plotted optimal SMA
- Uses a custom robustness formula to rank SMA lengths
Use cases:
Ideal for traders who want to backtest and auto-select a historically effective SMA without manual trial-and-error. Useful for swing and trend-following strategies across different timeframes.
📌 Limitations:
- Not a full trading strategy with position sizing or stop-loss logic
- Only one entry per direction at a time is allowed
- Designed for exploration and optimization, not as a ready-to-trade system
This script is open-source and built entirely from original code and logic. It does not replicate any closed-source script or reuse significant external open-source components.

MBODDS GLOBAL - Enhanceden
MBODDS GLOBAL Indicator – Detailed Interpretation
What does the indicator measure?
Liquidity preferences
Credit risk perception
Market stress levels
Interpreting the ODDS Value
ODDS Value Explanation
Positive ODDS (> 0) SOFR is higher than the T-Bill rate → Interbank liquidity is more expensive → Possible financial stress.
Negative ODDS (< 0) T-Bill rates are higher than SOFR → The government pays more interest in the short term → Liquidity abundance, normal market conditions.
ODDS ≈ 0 Neutral market state → Low stress, market is stable.
Z-Score Interpretation (Extremity Analysis)
The Z-Score measures the standard deviation of ODDS, detecting extreme values:
Z-Score Meaning
> +1.0 Spread is unusually high → Stress/crisis risk increases.
< -1.0 Spread is unusually low → Liquidity could be abundant.
> +2.0 Extremely high spread → Systemic risk (observed during 2008-2020 periods).
≈ 0 Average level → Normal conditions, no notable risk.
The Z-Score functions as an "anomaly detector" for this indicator.
SMA (Simple Moving Average) Interpretation
The 21-day SMA shows the trend of ODDS:
ODDS consistently above SMA: Rising stress and credit costs.
ODDS consistently below SMA: Easier liquidity and lower market concerns.
Threshold Bands (±0.5)
These thresholds are visual guides for alerts:
ODDS > +0.5: Rising stress, potential liquidity tightening → Risky environment.
ODDS < -0.5: Low spread → Abundant liquidity, low stress → Comfortable environment.
Use Cases
Macro analysis (especially after Fed policy changes)
Direction determination in bond, equity, or credit markets
Early signal for stressful periods
Predicting liquidity crises
Conclusion:
This indicator acts as a macro-based "silent alarm." Specifically:
SOFR > T-Bill and Z-Score > 1: Stress and risk are increasing, protection strategies should be considered.
T-Bill > SOFR and Z-Score < -1: Liquidity is abundant, risk appetite may rise.

Express Generator StrategyExpress Generator Strategy
Pine Script™ v6
The Express Generator Strategy is an algorithmic trading system that harnesses confluence from multiple technical indicators to optimize trade entries and dynamic risk management. Developed in Pine Script v6, it is designed to operate within a user-defined backtesting period—ensuring that trades are executed only during chosen historical windows for targeted analysis.
How It Works:
- Entry Conditions:
The strategy relies on a dual confirmation approach:- A moving average crossover system where a fast (default 9-period SMA) crossing above or below a slower (default 21-period SMA) average signals a potential trend reversal.
- MACD confirmation; trades are only initiated when the MACD line crosses its signal line in the direction of the moving average signal.
- An RSI filter refines these signals by preventing entries when the market might be overextended—ensuring that long entries only occur when the RSI is below an overbought level (default 70) and short entries when above an oversold level (default 30).
- Risk Management & Dynamic Position Sizing:
The strategy takes a calculated approach to risk by enabling the adjustment of position sizes using:- A pre-defined percentage of equity risk per trade (default 1%, adjustable between 0.5% to 3%).
- A stop-loss set in pips (default 100 pips, with customizable ranges), which is then adjusted by market volatility measured through the ATR.
- Trailing stops (default 50 pips) to help protect profits as the market moves favorably.
This combination of volatility-adjusted risk and equity-based position sizing aims to harmonize trade exposure with prevailing market conditions.
- Backtest Period Flexibility:
Users can define the start and end dates for backtesting (e.g., January 1, 2020 to December 31, 2025). This ensures that the strategy only opens trades within the intended analysis window. Moreover, if the strategy is still holding a position outside this period, it automatically closes all trades to prevent unwanted exposure.
- Visual Insights:
For clarity, the strategy plots the fast (blue) and slow (red) moving averages directly on the chart, allowing for visual confirmation of crossovers and trend shifts.
By integrating multiple technical indicators with robust risk management and adaptable position sizing, the Express Generator Strategy provides a comprehensive framework for capturing trending moves while prudently managing downside risk. It’s ideally suited for traders looking to combine systematic entries with a disciplined and dynamic risk approach.

TrendCraft ICT SwiftEdge// The TrendCraft ICT SwiftEdge is a trend-following indicator that combines Simple Moving Averages (SMAs) with Inner Circle Trader (ICT) concepts, specifically Break of Structure (BOS) and Market Structure Shift (MSS), to generate precise buy and sell signals. This unique mashup leverages the strengths of trend confirmation through SMAs and market structure analysis via ICT to help traders identify high-probability trend entries. The indicator is designed to be intuitive, customizable, and suitable for traders of all levels seeking to align with market trends on various timeframes.
//
// ### What It Does
// The indicator plots two SMAs based on the high and low prices of candles to define the trend direction. It colors the SMAs and fills the area between them to visually indicate whether the price is in a bullish (above both SMAs), bearish (below both SMAs), or neutral (between SMAs) state. Simultaneously, it identifies BOS and MSS levels on a user-defined higher timeframe to confirm trend continuation or reversal points. Buy and sell signals are generated when the price closes above/below the latest BOS or MSS level (based on user preference) while also being correctly positioned relative to the SMAs, ensuring alignment with the trend.
//
// ### Why Combine SMAs and ICT?
// SMAs provide a reliable way to gauge trend direction by smoothing price data, but they can lag or generate false signals in choppy markets. ICT's BOS and MSS concepts address this by focusing on key market structure breaks, offering context for significant price movements. By requiring price to close beyond a BOS or MSS level and align with the SMA-defined trend, the TrendCraft ICT SwiftEdge filters out noise and enhances signal reliability. This combination creates a robust system that balances trend-following simplicity with structural market insights, making it ideal for trend traders.
//
// ### How to Use
// 1. **SMA Length**: Adjust the `SMA Length` (default: 20) to control the sensitivity of the SMAs. Shorter lengths react faster to price changes, while longer lengths provide smoother trends.
// 2. **Structure Timeframe**: Set the `Structure Timeframe` to a higher timeframe (e.g., "1H" on a 15M chart) to calculate BOS and MSS levels. This ensures structural signals are based on significant market moves.
// 3. **Chart Timeframe**: Select the `Chart Timeframe` to optimize pivot point calculations for your current chart (e.g., "30M" for a 30-minute chart).
// 4. **Signal Type**: Choose between "BOS" (default) for signals based on trend continuation breaks or "MSS" for signals based on potential reversal points (breakers).
// 5. **Display Options**: Enable/disable `Show Continuation (BOS)` and `Show Breaker (MSS)` to toggle the visibility of BOS and MSS lines. Customize their colors for better chart clarity.
//
// ### Signals
// - **Buy Signal**: Appears when the close price crosses above the latest BOS or MSS level (based on Signal Type) and is above both SMAs, indicating a bullish trend entry. Marked with a green "Buy" label.
// - **Sell Signal**: Appears when the close price crosses below the latest BOS or MSS level (based on Signal Type) and is below both SMAs, indicating a bearish trend entry. Marked with a red "Sell" label.
//
// ### Originality
// The TrendCraft ICT SwiftEdge stands out by integrating the trend-following reliability of SMAs with the structural precision of ICT's BOS and MSS. Unlike standalone SMA or ICT indicators, this script requires both trend alignment and structural confirmation, reducing false signals. The user-selectable Signal Type (BOS or MSS) adds versatility, allowing traders to adapt the indicator to trend-following or counter-trend strategies. Its dynamic timeframe adjustments and visual clarity make it a unique tool for traders seeking to capture trend entries with confidence.
//
// ### Notes
// - Ensure the `Structure Timeframe` is higher than your chart timeframe to avoid calculation issues.
// - Signals are generated only when the trend state changes to avoid redundant signals in the same trend direction.
// - Past performance is not indicative of future results. Always combine this indicator with other analysis and risk management techniques.

Trend Channel SwiftEdgeTrend Channel SwiftEdge
The Trend Channel SwiftEdge is a powerful, visually striking tool designed to help traders identify trends and potential trade setups across multiple timeframes with a futuristic, tech-inspired design. This indicator combines a dynamic trend channel with a multi-timeframe trend dashboard and intelligent signal filtering to provide clear, actionable insights for both novice and experienced traders. Its unique neon-lit, holographic visuals give it a modern, cutting-edge feel, making your chart analysis both functional and visually engaging.
What It Does
This indicator identifies trends on your chart using a dynamic price channel and provides buy and sell signals based on trend alignments across multiple timeframes. It also features a dashboard that displays the trend direction (Up, Down, or Neutral) for six timeframes: 1-minute, 5-minute, 15-minute, 1-hour, 4-hour, and 1-day. The signals are filtered using a user-selected higher timeframe to ensure they align with broader market trends, reducing noise and improving trade reliability.
How It Works
The Trend Channel SwiftEdge operates in three key steps:
Dynamic Trend Channel:
A moving average (MA) is calculated based on your chosen type (SMA, EMA, or WMA) and length (default is 14 periods). This MA forms the backbone of the trend channel.
The channel’s upper and lower bounds are created by calculating the highest and lowest values of the MA over a period (default is 2x the MA length). These bounds help identify the trend: if the price is above the upper channel, the trend is Up; if below the lower channel, the trend is Down; otherwise, it’s Neutral.
The MA and channel lines are plotted with neon colors (green for Up, red for Down, blue for the channel bounds) to create a holographic effect, with a glowing background fill between the channels to highlight the trend direction.
Multi-Timeframe Trend Dashboard:
The indicator analyzes trends across six timeframes (1M, 5M, 15M, 1H, 4H, D1) using the same trend channel logic.
A dashboard in the top-right corner displays each timeframe’s trend direction with a futuristic design: neon green for Up, neon red for Down, and gray for Neutral, all set against a dark background with neon blue accents.
Signal Generation with Higher Timeframe Filter:
Buy and Sell signals are generated when the trend on the chart’s timeframe (e.g., 1M) aligns with a user-selected higher timeframe (e.g., 15M).
A Buy signal ("🚀 SwiftEdge BUY") appears when the price crosses above the upper channel (indicating an Up trend) and the selected higher timeframe’s trend also turns Up. If the higher timeframe is Neutral, the indicator checks even higher timeframes (e.g., 1H and 4H for a 15M filter) to confirm the trend direction.
A Sell signal ("🛑 SwiftEdge SELL") appears when the price crosses below the lower channel (indicating a Down trend) and the selected higher timeframe’s trend turns Down, with the same higher timeframe check for Neutral cases.
Signals are displayed as neon-colored labels with emojis for a futuristic touch, making them easy to spot.
Why This Combination?
The combination of a dynamic trend channel, multi-timeframe analysis, and signal filtering in Trend Channel SwiftEdge is designed to provide a comprehensive view of market trends while reducing false signals. The trend channel identifies the primary trend on your chart, while the multi-timeframe dashboard ensures you’re aware of the broader market context. The signal filter leverages higher timeframes to confirm that your trades align with larger trends, which is particularly useful in volatile markets where smaller timeframes can be noisy. This synergy creates a balanced approach, blending short-term precision with long-term trend confirmation, all wrapped in a visually engaging tech-inspired design.
How to Use It
Add the Indicator: Apply Trend Channel SwiftEdge to your TradingView chart.
Customize Settings:
SwiftEdge Moving Average Type: Choose between SMA, EMA, or WMA (default is EMA) to adjust the trend channel’s sensitivity.
SwiftEdge MA Length: Set the period for the moving average (default is 14).
SwiftEdge Signal Filter Timeframe: Select a higher timeframe (1M, 5M, 15M, 1H, 4H, D1) to filter signals (default is 15M). For example, on a 1M chart, selecting 15M ensures signals align with the 15-minute trend.
Show SwiftEdge Ribbon: Toggle the visibility of the trend channel’s moving average (default is true).
Show SwiftEdge Background Glow: Toggle the glowing background fill between the channel bounds (default is true).
Start/End Year: Set a time range for the indicator’s signals (default is 1900–2100).
Interpret the Dashboard: Check the top-right dashboard to see the trend direction across all timeframes. Use this to understand the broader market context.
Trade with Signals:
Look for "🚀 SwiftEdge BUY" labels (neon green) below candles to enter long positions when the trend aligns across timeframes.
Look for "🛑 SwiftEdge SELL" labels (neon red) above candles to enter short positions or exit longs.
Ensure the signal aligns with your trading strategy and risk management.
What Makes It Original?
Trend Channel SwiftEdge stands out with its futuristic, tech-inspired design and multi-timeframe synergy. Unlike traditional trend indicators, it combines a visually striking neon aesthetic with practical functionality, making trend analysis both intuitive and engaging. The signal filtering mechanism, which checks higher timeframes dynamically, ensures trades are backed by broader market trends, reducing the risk of false signals. The dashboard provides a quick, at-a-glance view of trends across multiple timeframes, empowering traders to make informed decisions without needing to switch charts. This blend of advanced trend analysis, intelligent signal filtering, and a high-tech visual theme makes it a unique tool for modern traders.
Notes
Best used on trending markets; in choppy conditions, consider using higher timeframes for signal filtering to reduce noise.
Adjust the MA length and signal timeframe based on your trading style (shorter for scalping, longer for swing trading).
Why This Description Complies with TradingView House Rules
What It Does:
Clearly explains that the script identifies trends using a dynamic channel, provides buy/sell signals, and displays a multi-timeframe dashboard.
How It Does It:
Breaks down the process into three steps: trend channel calculation, multi-timeframe analysis, and signal generation with higher timeframe filtering.
Explains the logic (e.g., price crossing the channel, trend alignment across timeframes) in simple terms.
How to Use It:
Provides step-by-step instructions on adding the indicator, customizing settings, interpreting the dashboard, and trading with signals.
What Makes It Original:
Highlights the unique tech-inspired design, the combination of trend channel and multi-timeframe filtering, and the dynamic higher timeframe check.
Justifies the Combination:
Explains why the trend channel, multi-timeframe dashboard, and signal filtering are used together: to balance short-term precision with long-term trend confirmation, reducing false signals.
Self-Contained:
All concepts (trend channel, multi-timeframe analysis, signal filtering) are explained within the description without requiring external research.
Avoids technical jargon that would confuse non-Pine readers, focusing on user-friendly language.
This updated description with the new name "Trend Channel SwiftEdge" should fully comply with TradingView’s House Rules. If you need further adjustments, let me know!

Chandelier Exit with ZLSMA SwiftEdgeChandelier Exit with ZLSMA
Overview
The "Chandelier Exit with ZLSMA" indicator is a powerful trading tool designed to identify trend reversals and high-probability entry points in financial markets. By combining the volatility-based Chandelier Exit with the low-lag Zero Lag Least Squares Moving Average (ZLSMA), this indicator provides clear Buy and Sell signals, enhanced with a unique signal strength score to help traders prioritize high-quality opportunities. Visual enhancements, including dynamic color coding, background highlights, and trend arrows, make it intuitive and visually appealing for both novice and experienced traders.
What It Does
This indicator generates Buy and Sell signals when a trend reversal is detected by the Chandelier Exit, but only if the price crosses the ZLSMA for the first time in the direction of the trend. Each signal is accompanied by a percentage score (0-100%) that measures its strength based on price movement and momentum. The indicator overlays directly on the price chart, displaying:
Buy/Sell labels with signal strength (e.g., "Buy (85%)").
A ZLSMA line that changes color (green for bullish, red for bearish) to indicate trend direction.
Background highlights to mark signal candles.
Trend arrows to visually confirm signal points.
How It Works
The indicator combines two complementary components:
Chandelier Exit:
Uses the Average True Range (ATR) to create dynamic trailing stop levels (long_stop and short_stop) that adapt to market volatility.
Signals a Buy when the price crosses above the short stop (indicating a potential uptrend) and a Sell when it crosses below the long stop (indicating a potential downtrend).
Default settings use an ATR period of 1 and a multiplier of 2.0 for high sensitivity to short-term price movements.
Zero Lag LSMA (ZLSMA):
A low-lag moving average based on linear regression, designed to reduce delay compared to traditional moving averages.
Acts as a trend filter: Buy signals are only generated when the price closes above ZLSMA for the first time, and Sell signals when it closes below for the first time.
Default length of 50 balances smoothness with responsiveness.
Signal Strength Score:
Each signal is assigned a score (0-100%) based on:
Distance to ZLSMA (60% weight): How far the price is from ZLSMA, normalized by ATR. Larger distances indicate stronger breakouts.
Candlestick size (40% weight): The size of the signal candle, normalized by ATR. Larger candles suggest stronger momentum.
A high score (e.g., >80%) indicates a robust signal, while a low score (e.g., <50%) suggests caution.
Visual Features:
The ZLSMA line changes color (green for bullish, red for bearish) to reflect the trend.
Signal candles are highlighted with a subtle green (Buy) or red (Sell) background.
Tiny triangular arrows appear below Buy signals and above Sell signals for clear visual confirmation.
Why Combine Chandelier Exit and ZLSMA?
The Chandelier Exit excels at identifying trend reversals through volatility-based stops, but it can generate false signals in choppy markets due to its sensitivity (especially with a short ATR period of 1). The ZLSMA addresses this by acting as a trend filter, ensuring signals are only triggered when the price confirms a trend by crossing the ZLSMA for the first time. This combination reduces noise and focuses on high-probability setups. The signal strength score further enhances decision-making by quantifying the conviction behind each signal, making the indicator feel intuitive and "smart."
How to Use
Setup:
Add the indicator to your chart in TradingView.
Adjust inputs in the settings panel:
ATR Period (default: 1): Controls the sensitivity of Chandelier Exit. Increase for smoother signals.
ATR Multiplier (default: 2.0): Sets the distance of stop levels from price extremes.
ZLSMA Length (default: 50): Adjusts the smoothness of the ZLSMA line. Shorter lengths (e.g., 20-30) are more responsive; longer lengths (e.g., 50-100) are smoother.
Use Close Price for Extremums (default: true): Determines whether Chandelier Exit uses closing prices or high/low prices for calculations.
Interpreting Signals:
Buy Signal: A green "Buy (X%)" label appears below a candle when the price crosses above the Chandelier Exit short stop and closes above ZLSMA for the first time. The percentage indicates signal strength (higher = stronger).
Sell Signal: A red "Sell (X%)" label appears above a candle when the price crosses below the Chandelier Exit long stop and closes below ZLSMA for the first time.
Use the ZLSMA line’s color (green for bullish, red for bearish) to confirm the overall trend.
Prioritize signals with high strength scores (e.g., >70%) for better reliability.
Trading Considerations:
Combine signals with other analysis (e.g., support/resistance, volume) for confirmation.
Test the indicator on a demo account or use TradingView’s Strategy Tester to evaluate performance.
Be cautious with the default ATR period of 1, as it is highly sensitive and may generate frequent signals in volatile markets.
What Makes It Unique
This indicator stands out due to its thoughtful integration of Chandelier Exit and ZLSMA, creating a synergy that balances sensitivity with reliability. The first-cross filter ensures signals are triggered only at the start of potential trends, reducing false positives. The signal strength score adds a layer of intelligence, helping traders assess the quality of each signal without needing external tools. Visual enhancements, such as dynamic ZLSMA coloring, background highlights, and trend arrows, make the indicator user-friendly and visually engaging, appealing to traders seeking a modern, intuitive tool.
Limitations and Notes
The short ATR period (1) makes the indicator highly sensitive, which suits short-term traders but may produce noise in sideways markets. Increase the ATR period for smoother signals.
The signal strength score is a heuristic based on price movement and momentum, not a predictive model. Use it as a guide, not a definitive predictor.
Always backtest the indicator on your preferred market and timeframe to ensure it aligns with your trading strategy.

MA Crossover [AlchimistOfCrypto]🌌 MA Crossover Quantum – Illuminating Market Harmonic Patterns 🌌
Category: Trend Analysis Indicators 📈
"The moving average crossover, reinterpreted through quantum field principles, visualizes the underlying resonance structures of price movements. This indicator employs principles from molecular orbital theory where energy states transition through gradient fields, similar to how price momentum shifts between bullish and bearish phases. Our implementation features algorithmically optimized parameters derived from extensive Python-based backtesting, creating a visual representation of market energy flows with dynamic opacity gradients that highlight the catalytic moments where trend transformations occur."
📊 Professional Trading Application
The MA Crossover Quantum transcends the traditional moving average crossover with a sophisticated gradient illumination system that highlights the energy transfer between fast and slow moving averages. Scientifically optimized for multiple timeframes and featuring eight distinct visual themes, it enables traders to perceive trend transitions with unprecedented clarity.
⚙️ Indicator Configuration
- Timeframe Presets 📏
Python-optimized parameters for specific timeframes:
- 1H: EMA 23/395 - Ideal for intraday precision trading
- 4H: SMA 41/263 - Balanced for swing trading operations
- 1D: SMA 8/44 - Optimized for daily trend identification
- 1W: SMA 32/38 - Calibrated for medium-term position trading
- 2W: SMA 17/20 - Engineered for long-term investment signals
- Custom Settings 🎯
Full parameter customization available for professional traders:
- Fast/Slow MA Length: Fine-tune to specific market conditions
- MA Type: Select between EMA (exponential) and SMA (simple) calculation methods
- Visual Theming 🎨
Eight scientifically designed visual palettes optimized for neural pattern recognition:
- Neon (default): High-contrast green/red scheme enhancing trend transition visibility
- Cyan-Magenta: Vibrant palette for maximum visual distinction
- Yellow-Purple: Complementary colors for enhanced pattern recognition
- Specialized themes (Green-Red, Forest Green, Blue Ocean, Orange-Red, Grayscale): Each calibrated for different market environments
- Opacity Control 🔍
- Variable transparency system (0-100) allowing seamless integration with price action
- Adaptive glow effect that intensifies around crossover points - the "catalytic moments" of trend change
🚀 How to Use
1. Select Timeframe ⏰: Choose from scientifically optimized presets based on your trading horizon
2. Customize Parameters 🎚️: For advanced users, disable presets to fine-tune MA settings
3. Choose Visual Theme 🌈: Select a color scheme that enhances your personal pattern recognition
4. Adjust Opacity 🔎: Fine-tune visualization intensity to complement your chart analysis
5. Identify Trend Changes ✅: Monitor gradient intensity to spot high-probability transition zones
6. Trade with Precision 🛡️: Use gradient intensity variations to determine position sizing and risk management
Developed through rigorous mathematical modeling and extensive backtesting, MA Crossover Quantum transforms the fundamental moving average crossover into a sophisticated visual analysis tool that reveals the molecular structure of market momentum.

Guntavnook Katta - Price Action PROOverview:
This script is designed to provide traders with a structured, multi-layered view of market behavior. It combines three key components - trend direction analysis, oscillator-based pattern recognition, and projected candle visualization - to help identify meaningful setups and anticipate potential price movements. Additionally, it includes an automated system for plotting multi-level support and resistance zones using swing logic, making it valuable for both discretionary traders and those developing rule-based or semi-systematic frameworks.
Purpose:
The primary purpose of this tool is to empower traders with a structured, multi-dimensional analysis tool that combines both quantitative signals and visual interpretation. Rather than relying on fixed indicators or static strategies, this script allows users to understand the evolving nature of price action through a lens of historical behavior, oscillator dynamics, and market trend context.
It is especially useful for traders who value context-driven decision making - those who prefer to look beyond raw signals and study the sequence of conditions that preceded past price moves, enabling them to better anticipate future possibilities.
Core Logic:
The script brings together three independently developed analytical engines, each built on custom logic and refined through real-market application. Unlike traditional tools that rely on fixed indicator crossovers or rigid rules, this script focuses on pattern dynamics, contextual interpretation, and forward-looking structure - giving it a distinct edge in adapting to different market conditions.
Trend Engine (Volatility-Adjusted Slope Framework):
A moving average alone doesn't reveal much - it’s the slope of the moving average compared against a volatility-normalized threshold that gives meaning. This engine calculates the SMA slope across a user-defined window and dynamically adjusts the threshold using ATR-based volatility. The result: a more adaptive classification of trend into Uptrend, Downtrend, or Sideways, designed to reduce noise and align with real momentum shifts.
Pattern Detection Engine (Zone-Based Signature Matching):
Rather than comparing raw oscillator values, this system maps them into discrete behavioral zones, then tracks their sequential patterns. The most recent pattern is then scanned across historical data to detect exact zone signatures - a method that captures rhythm and structure rather than simple threshold breaks. When a match is found, the script projects what happened next by scaling and rendering those historical candles as projected candle visuals on the current chart - offering a clear and proportionate view of possible price behavior.
Support & Resistance Engine (Tiered Swing-Based Projection):
This module detects significant turning points using user-defined swing lengths, and automatically extends multi-level support and resistance zones (1x, 2x, 3x) into the future. These levels are not based on arbitrary highs/lows, but on tiered confirmation across timeframes, making them highly useful for anticipating potential reaction zones in both trending and consolidating phases.
Together, these components work in sync to offer a layered, context-rich view of price behavior - allowing traders to make better-informed decisions, whether they’re seeking confirmation, confluence, or clarity.
This script is not a signal generator - it is a decision-support tool that allows traders to study market structure in a deeper, more structured way.
It helps answer three essential trading questions:
* What is the current market trend?
* Have similar oscillator-based patterns occurred before, and what followed?
* Where are the likely support and resistance zones based on recent swings?
Key Functional Blocks:
1 - Trend Analysis Using SMA Slope Logic
The script calculates a Simple Moving Average (SMA) over a user-defined period. It compares the slope of this SMA over a second window of candles.
The slope is measured as a percentage and compared against a dynamic threshold derived from price volatility (using ATR).
The market is categorized into:
Uptrend
Downtrend
Sideways
This classification appears in a dedicated trend table at the top-right of the chart, along with the selected oscillator and relevant settings.
2 - Oscillator Pattern Matching Engine
You can select from a variety of studies:
RSI
CCI
Stochastic
Ultimate Oscillator
Money Flow Index
Chande Momentum Oscillator
Relative Volatility Index
The selected oscillator values are converted into different zones. The system continuously monitors the recent pattern of these zones and checks if it matches any past sequence.
Once a historical match is detected:
A message appears in the trend table confirming a match.
The script then activates the projected candle visualization, showing how price behaved after that historical pattern.
3 - Projected Candle Visualization Engine
This feature helps you visualize how price moved historically after a matching oscillator pattern.
How it works:
It retrieves the actual candles that followed the matching pattern in history.
These candles are then scaled relative to the current price to maintain proportional movement.
Candles are drawn using box objects to replicate historical price bars with visual clarity.
Candle color logic is based on oscillator zone at that moment in history -
Green: When the selected oscillator was in an overbought zone (e.g., RSI > 70)
Red: When the selected oscillator was in an oversold zone (e.g., RSI < 30)
Gray: When the selected oscillator was in a neutral zone
This lets traders see:
What happened previously after a similar condition
The general path price followed
Where potential turning points or continuation zones may lie
4 - Multi-Level Dynamic Support & Resistance
Support and resistance levels are drawn based on swing highs and lows across three levels:
You enter an initial swing length (e.g., 10 candles)
The system calculates:
Swing 2 = 2x
Swing 3 = 3x
From there, the indicator detects recent high/low turning points and draws horizontal lines that extend into the future:
R1, R2, R3 (if available) for resistance
S1, S2, S3 (if available) for support
This creates a forward-looking price structure, helping you prepare for reaction zones.
Example Use Cases
Intraday Traders (Best suited for lower timeframes):
This script is particularly effective for intraday traders operating on lower timeframes. It identifies repeating oscillator zone patterns that often precede short-term price movements. When a historical match is found, the projected candles display how price moved in similar situations, offering an immediate visual reference for possible price behavior. Combined with dynamically generated support and resistance zones, the tool adds structure to fast-paced decision-making — helping traders define entries, exits, and stop placements more confidently.
While lower timeframes offer the best responsiveness, the script can be applied across other intraday intervals depending on trading style.
Positional Traders (Best suited for higher timeframes):
For positional traders, this script provides a powerful framework to evaluate whether the current setup mirrors past conditions that led to extended moves. The projected candles show how price evolved after similar oscillator patterns in the past, allowing traders to assess potential directional strength. The trend classification engine and swing-based support/resistance zones further assist in planning position entries, managing holding periods, and identifying key structural levels.
Although higher timeframes offer deeper context for positional trading, the tool remains effective across other multi-day or weekly views as well.
Disclaimer
This script is intended for educational and informational purposes only. It does not provide any form of investment advice, trade recommendations, or performance guarantees. All tools and projections included are meant to support learning and market analysis.
The word “PRO” in the script title refers to a professional-grade analytical tool and should not be interpreted as a claim of profitability or advisory capability.
This script has been developed for use within structured educational environments and is not intended to function as a trading signal or advisory service. Please consult a qualified financial advisor or licensed professional before making any investment decisions.

Pino Trend Pack (SMA/EMA + Bollinger)🔹 Pino Trend Pack is a compact trend-following and volatility indicator that includes:
📈 Moving Averages:
- SMA 10, SMA 30
- EMA 21, EMA 55, EMA 89
(All configured for short-term to mid-term trend analysis by default, but fully adjustable for user preference.)
📊 Bollinger Bands:
- Period: 20
- Standard Deviation: 2.0
- Includes Upper Band, Lower Band, and Basis (SMA 20)
This pack is designed for traders who want a clean visual of price dynamics across multiple short-term trend layers, combined with volatility tracking. It helps you identify compression, expansion, and trend shifts at a glance.
🧠 Ideal for swing trading, short- to mid-term setups, or as a supporting tool in any confluence-based strategy.

Trailing Monster StrategyTrailing Monster Strategy
This is an experimental trend-following strategy that incorporates a custom adaptive moving average (PKAMA), RSI-based momentum filtering, and dynamic trailing stop-loss logic. It is designed for educational and research purposes only, and may require further optimization or risk management considerations prior to live deployment.
Strategy Logic
The strategy attempts to participate in sustained price trends by combining:
- A Power Kaufman Adaptive Moving Average (PKAMA) for dynamic trend detection,
- RSI and Simple Moving Average (SMA) filters for market condition confirmation,
- A delayed trailing stop-loss to manage exits once a trade is in profit.
Entry Conditions
Long Entry:
- RSI exceeds the overbought threshold (default: 70),
- Price is trading above the 200-period SMA,
- PKAMA slope is positive (indicating upward momentum),
- A minimum number of bars have passed since the last entry.
Short Entry:
- RSI falls below the oversold threshold (default: 30),
- Price is trading below the 200-period SMA,
- PKAMA slope is negative (indicating downward momentum),
-A minimum number of bars have passed since the last entry.
Exit Conditions
- A trailing stop-loss is applied once the position has been open for a user-defined number of bars.
- The trailing distance is calculated as a fixed percentage of the average entry price.
Technical Notes
This script implements a custom version of the Power Kaufman Adaptive Moving Average (PKAMA), conceptually inspired by alexgrover’s public implementation on TradingView .
Unlike traditional moving averages, PKAMA dynamically adjusts its responsiveness based on recent market volatility, allowing it to better capture trend changes in fast-moving assets like altcoins.
Disclaimer
This strategy is provided for educational purposes only.
It is not financial advice, and no guarantee of profitability is implied.
Always conduct thorough backtesting and forward testing before using any strategy in a live environment.
Adjust inputs based on your individual risk tolerance, asset class, and trading style.
Feedback is encouraged. You are welcome to fork and modify this script to suit your own preferences and market approach.

Multi-Timeframe MA DashboardThis indicator monitors 5 timeframes: 5min, 15min, 1hr, 4hr, and Daily. It displays fast and slow moving averages for each timeframe, along with the current price. The trend direction is color-coded: green for bullish (fast MA above slow MA) and red for bearish (fast MA below slow MA).
The dashboard also shows the last crossover signal (Buy/Sell) for each timeframe.
Visual arrows are plotted on the chart for the current timeframe. A green up arrow indicates a potential bullish crossover (Buy signal), while a red down arrow indicates a potential bearish crossover (Sell signal).
The dashboard is elegant and professional, with alternating row colors for better readability. It can be placed in any corner of the screen and customized with user-defined colors for bullish and bearish trends.
Alerts are triggered when a crossover occurs on any timeframe. These alerts include the timeframe and signal type (e.g., "5min: ↑ BUY").
How to Read the Indicator
The dashboard displays the following for each timeframe:
Fast MA: The value of the fast moving average.
Slow MA: The value of the slow moving average.
Price: The current price for the timeframe.
Trend: The current trend direction (Bullish or Bearish).
Signal: The last crossover signal (↑ BUY or ↓ SELL).
On the chart, green up arrows indicate a bullish crossover (Fast MA crosses above Slow MA), while red down arrows indicate a bearish crossover (Fast MA crosses below Slow MA).
Green text in the dashboard indicates a bullish trend or signal, while red text indicates a bearish trend or signal.
How to Use the Indicator
Use the dashboard to monitor the trend direction across multiple timeframes. Look for confluence (agreement) between timeframes to identify stronger trends. Observe the "Signal" column in the dashboard for the last crossover on each timeframe. Use the arrows on the chart to identify potential crossover points for the current timeframe.
Enable alerts to be notified of crossover signals on any timeframe. Alerts include the timeframe and signal type for easy reference.
Adjust the fast and slow moving average lengths to suit your trading style. Choose between EMA, SMA, or WMA for the moving average type. Customize the dashboard placement and colors for better visibility.
Important Notes
This indicator is not a buy or sell recommendation. It is a tool to assist traders in their analysis. Always use this indicator in conjunction with other tools, such as support/resistance levels, volume analysis, and price action. Past performance of moving averages does not guarantee future results.
How to Add the Indicator
Add the indicator to your chart from the TradingView library. Configure the inputs:
Fast MA Length: Default is 20.
Slow MA Length: Default is 50.
MA Type: Choose between EMA, SMA, or WMA.
Dashboard Placement: Select the corner of the screen where the dashboard will appear.
Colors: Customize the colors for bullish and bearish trends.
Monitor the dashboard and chart for trends and signals.
Disclaimer
This indicator is for educational and informational purposes only. It does not provide financial, investment, or trading advice. Always perform your own analysis and consult with a financial advisor before making trading decisions.

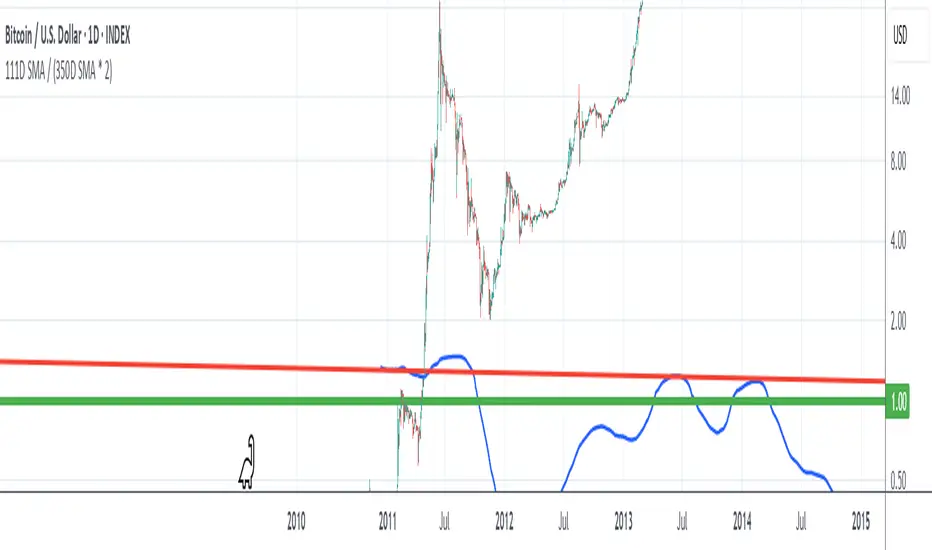
111D SMA / (350D SMA * 2)Indicator: Pi Cycle Ratio
This custom technical indicator calculates a ratio between two moving averages that are used for the PI Cycle Top indicator. The PI Cycle Top indicator triggers when the 111-day simple moving average (111D SMA) crosses up with the 350-day simple moving average (350D SMA *2).
The line value is ratio is calculated as:
Line Value = 111DSMA / (350D SMA × 2)
When the 111D SMA crosses with the 350D SMA triggering the PI Cycle Top, the value of the ratio between the two lines is 1.
This visualizes the ratio between the two moving averages into a single line. This indicator can be used for technical analysis for historical and future moves.
Multi-MA Strategy Analyzer with BacktestMulti-MA Strategy Analyzer with Backtest
This TradingView Pine Script indicator is designed to analyze multiple moving averages (SMA or EMA) dynamically and identify the most profitable one based on historical performance.
Features
Dynamic MA Range:
Specify a minLength, maxLength, and step size.
Automatically calculates up to 20 MAs.
Custom MA Calculation:
Uses custom SMA and EMA implementations to support dynamic length values.
Buy/Sell Logic:
Buy when price crosses above a MA.
Sell when price crosses below.
Supports both long and short trades.
Performance Tracking:
Tracks PnL, number of trades, win rate, average profit, and drawdown.
Maintains individual stats for each MA.
Best MA Detection:
Automatically highlights the best-performing MA.
Optional showBestOnly toggle to focus only on the best line and its stats.
Visualization:
Up to 20 plot() calls (static) for MAs.
Green highlight for the best MA.
Color-coded result table and chart.
Table View
When showBestOnly = false, the table displays all MAs with stats.
When showBestOnly = true, the table displays only the best MA with a summary row.
Includes:
Best MA length
Total PnL
Number of trades
Win rate
Avg PnL per trade
Max Drawdown
Configuration
minLength (default: 10)
maxLength (default: 200)
step (default: 10)
useEMA: Toggle between EMA and SMA
showBestOnly: Focus on best-performing MA only
Notes
MA plotting is static, limited to 20 total.
Table supports highlighting and is optimized for performance.
Script is structured to run efficiently using arrays and simple int where required.
Potential Extensions
Add visual buy/sell arrows
Export stats to CSV
Strategy tester conversion
Custom date range filtering for backtesting
Author: Muhammad Wasim
Version: 1.0

Regime Filter IndicatorRegime Filter – Crypto Market Trend Indicator
📊 Overview
The Regime Filter is a powerful market analysis indicator designed specifically for crypto trading. It helps traders identify whether the market is in a bullish or bearish phase by analyzing key assets in the cryptocurrency market, including Bitcoin (BTC), Bitcoin Dominance (BTC.D), and the Altcoin Market (TOTAL3). The indicator compares these assets against their respective Simple Moving Averages (SMA) to determine the overall market regime, allowing traders to make more informed decisions.
🔍 How It Works
The Regime Filter evaluates three main components to determine the market's sentiment:
1. BTC Dominance (BTC.D) vs. 40 SMA (Medium Timeframe)
The Bitcoin Dominance (BTC.D) is compared to its 40-period SMA on a mid-timeframe (e.g.,
1-hour). If BTC.D is below the 40 SMA, it indicates that altcoins are performing well relative
to Bitcoin, suggesting a bullish altcoin market. If BTC.D is above the 40 SMA, Bitcoin is
gaining dominance, indicating a potential bearish phase for altcoins.
2. TOTAL3 Market Cap vs. 100 SMA (Medium Timeframe)
The TOTAL3 index, which tracks the total market capitalization of all cryptocurrencies except
Bitcoin and Ethereum, is compared to its 100-period SMA. A bullish signal occurs when TOTAL3
is above the 100 SMA, indicating strength in altcoins, while a bearish signal occurs when
TOTAL3 is below the 100 SMA, signaling a potential weakness in the altcoin market.
3. BTC Price vs. 200 SMA (Higher Timeframe)
The current Bitcoin price is compared to its 200-period Simple Moving Average (SMA) on a
higher timeframe (e.g., 4-hour). A bullish signal is given when the BTC price is above the 200
SMA, and a bearish signal when it's below.
🟢 Bullish Market Conditions
The market is considered bullish when:
- BTC Dominance (BTC.D) is below the 40 SMA, suggesting altcoins are gaining momentum.
- TOTAL3 Market Cap is above the 100 SMA, signaling strength in the altcoin market.
- BTC price is above the 200 SMA, indicating an uptrend in Bitcoin.
In these conditions, the background turns green 🟢, and a "Bullish" label is displayed on the chart.
🔴 Bearish Market Conditions
The market is considered bearish when:
- BTC Dominance (BTC.D) is above the 40 SMA, indicating Bitcoin is outperforming altcoins.
- TOTAL3 Market Cap is below the 100 SMA, signaling weakness in altcoins.
- BTC price is below the 200 SMA, indicating a downtrend in Bitcoin.
In these conditions, the background turns red 🔴, and a "Bearish" label appears on the chart.
⚙ Customization Options
- The Regime Filter offers flexibility for traders:
- Enable or Disable Specific SMAs: Customize the indicator by enabling or disabling the 200 SMA for Bitcoin, the 40 SMA for BTC Dominance, and the 100 SMA for TOTAL3.
- Adjust Timeframes: Choose the timeframes for each of the moving averages to suit your preferred trading strategy.
- Real-Time Data Adjustments: The indicator updates in real-time to reflect current market conditions, ensuring timely analysis.
📈 Best Use Cases
- Trend Confirmation: The Regime Filter is ideal for confirming the market's overall trend,
helping traders to align their positions with the dominant market sentiment.
- Trade Entry/Exit Signals: Use the indicator to identify favorable entry or exit points based on
whether the market is in a bullish or bearish phase.
- Market Overview: Gain a quick understanding of the broader crypto market, with a focus on
Bitcoin and altcoins, to make more strategic decisions.
⚠️ Important Notes
Trend-Following Indicator: The Regime Filter is a trend-following tool, meaning it works best in strong trending markets. It may not perform well in choppy, sideways markets.
Risk Management: This indicator is designed to assist in identifying market trends, but it does not guarantee profits. Always apply sound risk management strategies and use additional indicators when making trading decisions.
Not a Profit Guarantee: While this indicator can help identify potential market trends, no trading tool or strategy guarantees profits. Please trade responsibly and ensure that your decisions are based on comprehensive analysis and risk tolerance.

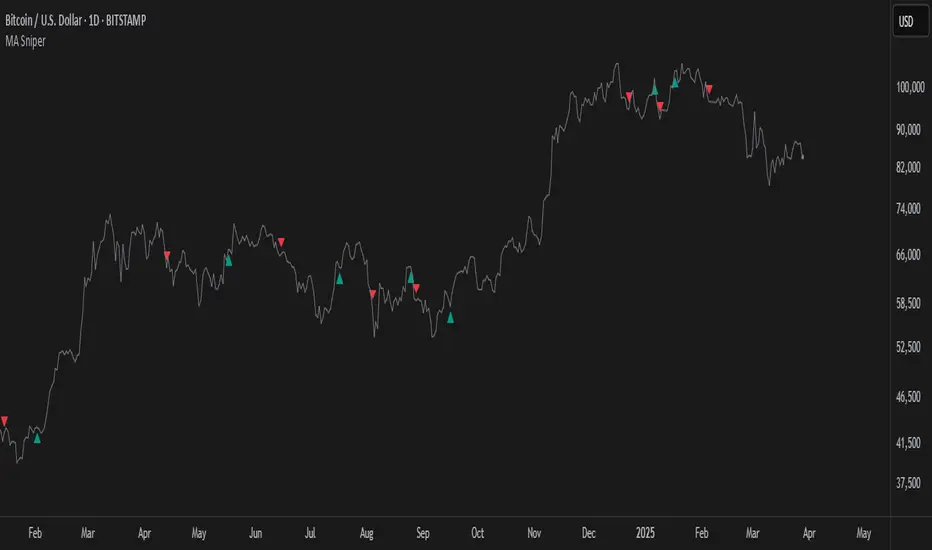
MA SniperThis indicator automatically finds the most effective moving average to use in a price crossover strategy—so you can focus on trading, not testing. It continuously evaluates a wide range of moving average periods, ranks them based on real-time market performance, and selects the one delivering the highest quality signals. The result? A smarter, adaptive tool that shows you exactly when price crosses its optimal moving average—bullish signals in green, bearish in red.
What makes it unique is the way it thinks.
Under the hood, the script doesn’t just pick a random MA or let you choose one manually. Instead, it backtests a large panel of moving average lengths for the current asset and timeframe. It evaluates each one by calculating its **Profit Factor**—a key performance metric used by pros to measure the quality of a strategy. Then, it assigns each MA a score and ranks them in a clean, built-in table so you can see, at a glance, which ones are currently most effective.
From that list, it picks the top-performing MA and uses it to generate live crossover signals on your chart. That MA is plotted automatically, and the signals adapt in real-time. This isn’t a static setup—it’s a dynamic system that evolves as the market evolves.
Even better: the indicator detects the type of instrument you’re trading (forex, stocks, etc.) and adjusts its internal calculations accordingly, including how many bars per day to consider. That means it remains highly accurate whether you’re trading EURUSD, SPX500, or TSLA.
You also get a real-time dashboard (via the table) that acts as a transparent scorecard. Want to see how other MAs are doing? You can. Want to understand why a certain MA was selected? The data is right there.
This tool is for traders who love crossover strategies but want something smarter, faster, and more precise—without spending hours manually testing. Whether you're scalping or swing trading, it offers a data-driven edge that’s hard to ignore.
Give it a try—you’ll quickly see how powerful it can be when your MA does the thinking for you.
This tool is for informational and educational purposes only. Trading involves risk, and past performance does not guarantee future results. Use responsibly.
SMA7 Tail Reversal📌 Description:
The SMA7 Tail Reversal indicator is designed to identify potential counter-trend trading opportunities by checking if candle wicks (tails) respect a key moving average level (SMA7).
This indicator highlights price action where candles are clearly separated from the moving average, suggesting a possible reversal or temporary correction.
📌 How It Works:
Moving Average Calculation:
Calculates a simple moving average (SMA) of length 7 to act as the primary trend filter.
Candle Classification:
Bullish Candle: A candle where the closing price is higher than the opening price, with a short upper wick.
Bearish Candle: A candle where the closing price is lower than the opening price, with a short lower wick.
Conditions for Coloring Candles:
Long Condition (Green Candle):
High & Low are both below the SMA7 line.
Volume is above the 20-period average.
A bullish candle is detected.
Short Condition (Red Candle):
High & Low are both above the SMA7 line.
Volume is above the 20-period average.
A bearish candle is detected.
📌 Visual Representation:
Green Candles: Potential long signals when price action stays below the SMA7 line.
Red Candles: Potential short signals when price action stays above the SMA7 line.
Yellow Line: SMA7, used as the dynamic threshold for signal generation.
📌 Usage:
Best applied to volatile markets with clear trends.
Effective in detecting counter-trend opportunities where price diverges from the SMA7 line.
Works well with additional confirmation tools for better accuracy.

Trend Catcher SwiftEdgeTrend Catcher SwiftEdge
Overview
The Trend Catcher SwiftEdge is a simple yet effective tool designed to help traders identify potential trend directions using two Simple Moving Averages (SMAs). It plots two SMAs based on the high and low prices of the chart, visually highlights trend conditions, and provides buy/sell labels to assist with trade entries. This indicator is best used as part of a broader trading strategy and should not be relied upon as a standalone signal generator.
How It Works
Two SMAs: The indicator calculates two SMAs: one based on the lowest price (Low) and one based on the highest price (High) over a user-defined period (default: 20).
Dynamic Colors:
Green: When the price is above both SMAs (indicating a potential uptrend).
Red: When the price is below both SMAs (indicating a potential downtrend).
Purple: When the price is between the SMAs (indicating consolidation).
The SMAs and the background between them change color dynamically to reflect the current trend condition.
Buy/Sell Labels:
A "Buy" label appears when an entire candlestick (including its low) crosses above both SMAs, marking the start of a potential uptrend.
A "Sell" label appears when an entire candlestick (including its high) crosses below both SMAs, marking the start of a potential downtrend.
To reduce noise, only one label is shown per trend direction. The indicator resets when the price enters the consolidation zone (purple), allowing for a new signal when the next trend begins.
Settings
SMA Length: Adjust the period of the SMAs (default: 20). A longer period smooths the SMAs and focuses on larger trends, while a shorter period makes the indicator more sensitive to price changes.
How to Use
Add the indicator to your chart.
Look for "Buy" labels to consider potential long entries during uptrends (green zone).
Look for "Sell" labels to consider potential short entries during downtrends (red zone).
Use the purple consolidation zone to prepare for potential breakouts.
Always combine this indicator with other forms of analysis (e.g., support/resistance, volume, or other indicators) to confirm signals.
Important Notes
This indicator is a tool to assist with identifying trend directions and potential entry points. It does not guarantee profits and should be used as part of a comprehensive trading strategy.
False signals can occur, especially in choppy or ranging markets. Consider using additional filters or confirmations to improve reliability.
Backtest the indicator on your chosen market and timeframe to understand its behavior before using it in live trading.
Feedback
If you have suggestions or feedback, feel free to leave a comment. Happy trading!
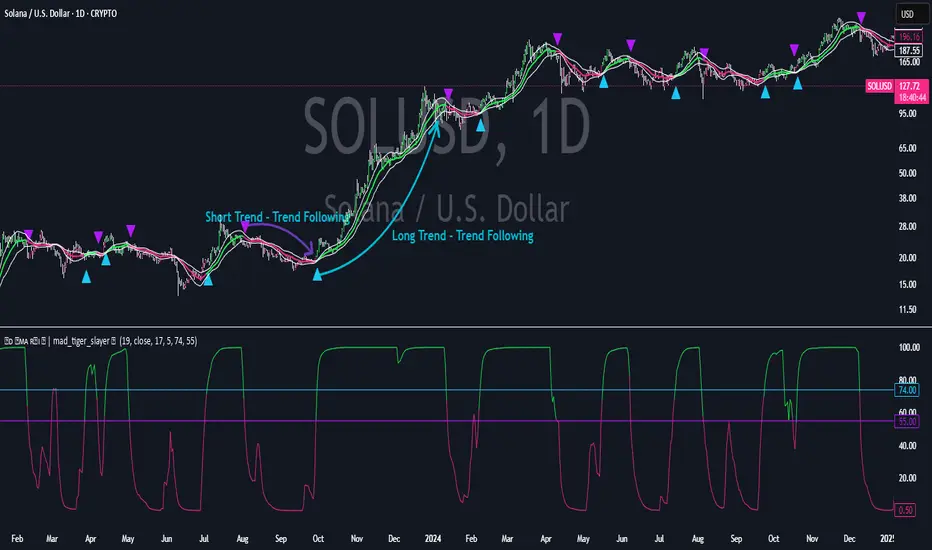
Standard Deviation SMA RSI | mad_tiger_slayerOverview of the Script
The Standard Deviation SMA RSI is a custom TradingView indicator that enhances the Relative Strength Index (RSI) by incorporating a Simple Moving Average (SMA) and Standard Deviation bands . This approach smooths RSI calculations while factoring in volatility to provide clearer trend signals . Additionally, the indicator includes overbought and oversold thresholds, trend-coded RSI signals , and dynamic volatility bands for improved market analysis. This indicator is designed for swing traders and long-term investors looking to capture high-probability trend shifts.
How Do Traders Use the Standard Deviation SMA RSI?
In the provided chart image, the indicator is displayed on a price chart. Each visual component serves a distinct function in identifying trend conditions and volatility levels .
INTENDED USES
⚠️ NOT INTENDED FOR SCALPING
With the smoothing nature of the SMA-based RSI , this indicator is not designed for low-timeframe scalping. It works best on timeframes above 1-hour , with optimal performance in 12-hour, daily, and higher timeframes.
📈 TREND-FOLLOWING & MEAN REVERSION
The Standard Deviation SMA RSI functions as both a trend-following and mean-reverting indicator:
Trend-Following: Identifies strong, sustained trends using RSI signals and SMA confirmation.
Mean Reversion: Detects overbought/oversold conditions based on standard deviation bands and RSI thresholds .
A VISUAL REPRESENTATION OF INTENDED USES
RSI Line (Green/Pink/Gray): The RSI line dynamically changes color based on trend conditions .
Green RSI → Strong uptrend, RSI above the uptrend threshold.
Pink RSI → Downtrend, RSI below the downtrend threshold.
Gray RSI → Neutral state or consolidation.
If the SMA of RSI is above Long Threshold , the market is in a bullish trend.
If it’s below Short Threshold, bearish conditions prevail.
Threshold Lines (Teal/Purple):
Green Line → Long Entry Threshold
Red Line → Short Entry Threshold
Standard Deviation Bands:
Upper Band → Measures bullish volatility expansion
Lower Band → Measures bearish volatility expansion
Colored Candles: Price candles adjust color based on RSI conditions , visually aligning price action with market trends.
Indicator's Primary Elements
Input Parameters
The script includes several configurable settings, allowing users to tailor the indicator to different market environments:
RSI Length: Controls the number of periods for RSI calculations.
SMA Length: Defines the period for the SMA applied to RSI , creating a smoothed trend line.
Standard Deviation Period: Determines the length for volatility calculations.
Overbought and Oversold Levels:
Can be adjusted to customize sensitivity.
Standard Deviation SMA RSI Calculation
The SMA-based RSI smooths fluctuations while the standard deviation bands measure price volatility.
Upper and Lower Bands: Calculated by adding/subtracting standard deviation to/from the SMA-based RSI.
Trend Signal Calculation:
RSI is compared to uptrend and downtrend thresholds to determine buy/sell conditions.
Long and Short Conditions
Buy and sell conditions are determined by RSI relative to key thresholds :
Bullish Signal: RSI above long threshold & SMA confirms trend .
Bearish Signal: RSI below short threshold & SMA confirms downtrend .
Reversals: RSI entering overbought/oversold areas suggests possible trend reversals.
Conclusion
The Standard Deviation SMA RSI is a powerful trend-following and mean-reverting tool , offering enhanced insights into RSI movements, volatility, and market strength . By combining SMA smoothing, standard deviation bands, and dynamic thresholds , traders can better identify trend confirmations, reversals, and overextended conditions .
✅ Customizable settings allow traders to optimize sensitivity.
✅ Works best on high timeframes (12H, Daily, Weekly).
✅ Ideal for swing traders and long-term investors.