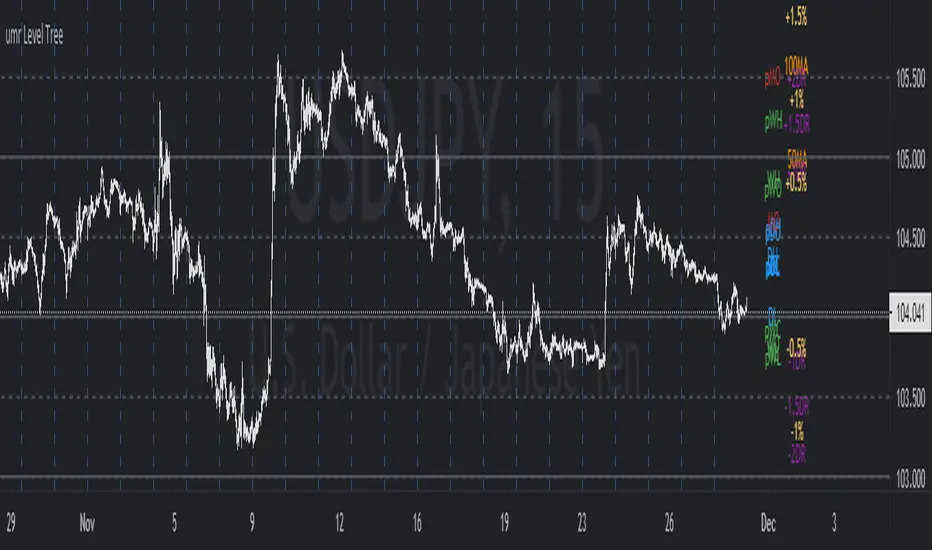
umr Level TreeShows following levels and labels (which can be individually controlled):
OHLC levels of Today, Yesterday, This week, Last week, This Month, Last Month
Daily Simple Moving Averages (50, 100, 200)
Horizontal Grid on 50, 100 pips for FX instruments.
(to do) Add ATR or Std Deviation
(to do) Add Daily Change levels % i.e. 0.5%, 1%, 2%
(to do) Add Daily change in pips levels (for fx) i.e. 50 pips, 100 pips etc
Media mobile semplice (SMA)
Displaced Moving Average Channel (DMA)What is This?
The Displaced Moving Average Channel (DMA) indicator is a combination of two moving averages calculated on the high and low of a set time period back which are displaced forward or backward with the center highlighted as a central channel.
What Information Can I Get Out of It?
This indicator can be used as a support or resistance as some moving averages are typically used as well as a tiny measure of recent volatility by looking at the spread between the top and bottom moving averages.
Where Did This Idea Come From?
I did not come up with the concept of this indicator since I was inspired to use this as a setup/trigger indicator in a potential trading strategy as seen in this whitepaper .

Golden & Death CrossThis indicator allows you to see Golden Cross and Death Cross.
Each Sma line can be hidden.
It is for educational purposes only.
Enjoy it.
Best Regards,
Bilgin , Kaptanin Seyir Defteri

Higher High / Lower Low StrategyThis is a very simple trend following strategy for Day Trading. The premise is to follow the Moving Average for the trend direction and buy/sell the dips and blips in the trend.
1. In an uptrend, when the candle action offers a "dip", or a lower high, the strategy will then buy on the close of the candle that breaks the high of the previous candle.
2. In a downtrend, when the candle action offers a"blip", or a higher low, the strategy will then sell on the close of the candle that breaks the low of the previous candle.
3. The strategy will go Long only or Short only, not both. It must be manually reversed in the settings when a new trend is established.
4. The start month and year allow you to backtest from then until now. It's not one month at a time.
5. The strategy uses a reversal of the Stochastic %K variable as the exist. The setting for Period K controls the exit for backtesting purposes.
6. The strategy uses a moving average to determine the trend. The setting for the Period MA controls the SMA.
7. The strategy has the option of filtering the number of trades based on the direction of the MACD and/or the Signal line. This can either reduce or increase the probability, and is highly dependent on the price action of the instrument.
WARNING: I am not a licensed financial advisor. This script is intended for entertainment purposes only. I highly recommend you manually enter and exit positions per your own Trading Rules, and do not blindly follow any software or recommendation. Use of this script is elective and at your own discretion, and risk.
If you like this script, please give it a Thumb's Up, and leave a comment. If you would like any custom scripts developed, contact me to discuss it. All of my work here is open and available, free of charge. It can be copied and edited to suit your needs.

Ratio Between Two SymbolsThis scripts displays the ratio of any two symbols. The ratio is shown on a second chart.
A multiplier may be added to the ratio, and moving average is calculated.

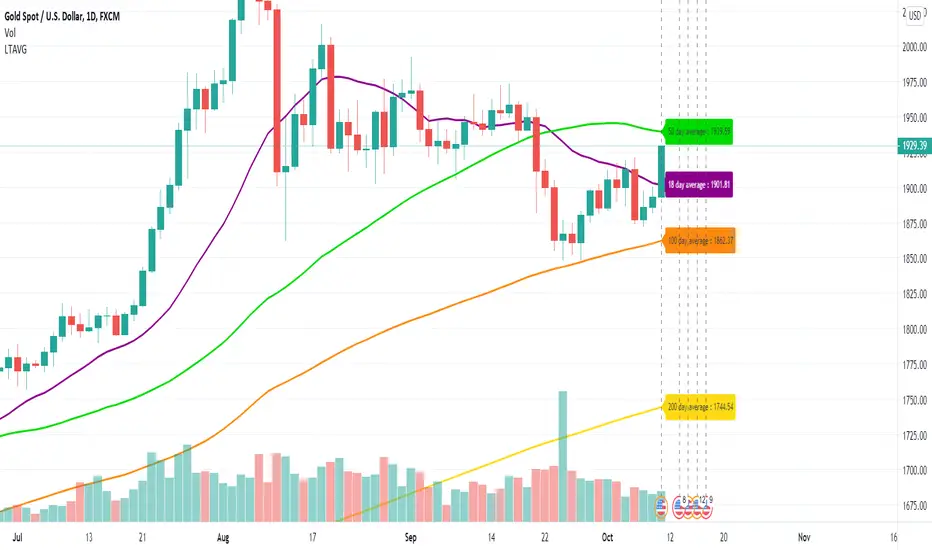
Long Term Moving AverageThis scripts plots the long term moving average calculated daily for 4 sets.
The default averages are:
18 day
50 day
100 day
200 day
The settings can be used to flexibly change this and to hide / show labels
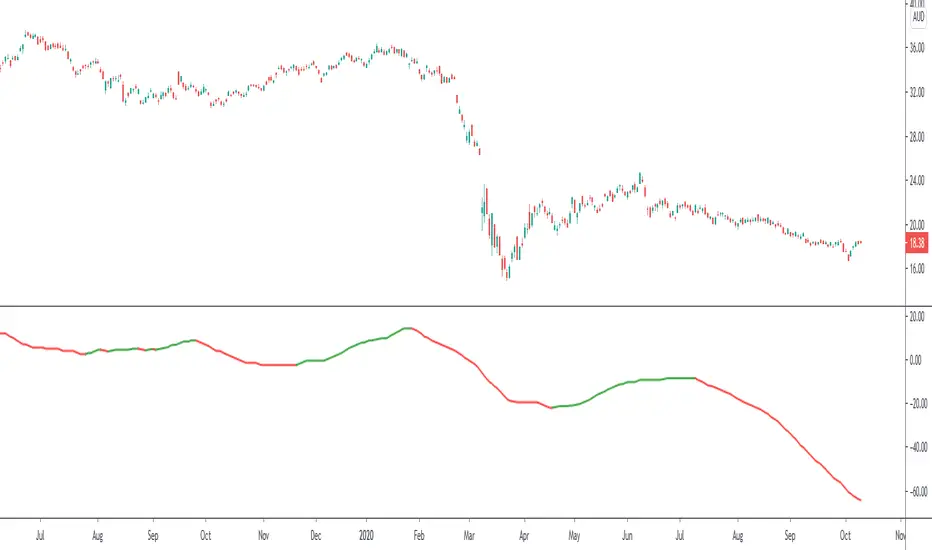
Aligned Moving Average IndexMoving averages are considered as aligned when either all faster moving averages are placed above their next slower moving averages or all faster moving averages are placed below their next slower moving averages. In this script, we are considering moving averages of 5, 10, 20, 30, 50, 100 and 200. User can select different moving average types from input : sma, ema, hma, rma, vwma, wma.
Moving average is considered as positively aligned when close > ma5 > ma10 > ma20 > ma30 > ma50 > ma100 > ma200
Moving average is considered as negatively aligned when close < ma5 < ma10 < ma20 < ma30 < ma50 < ma100 < ma200
Whenever there is positively aligned moving average, alignment value is considered as +1 and whenever there is negatively aligned moving average, alignment value is considered as -1. Aligned moving average index is sum of n periods of alignment value.
We can optionally apply another moving average on this index to see the overall direction.
positivebarPlease read description before purchase and use this indicator. If you have a question please feel free to send PM to us.
This indicator has 4 different strategies, which are:
- Early Buy / Sell
- Buy / Sell
- Pump / Dump
- Strong Buy / Sell
These 4 different strategies are based on multiple moving averages (EMA, WMA, SMA). It combines many different algorithms and we recommend that scan at least 2 different strategy together before make decision.
As you know, this indicator is not financial advice
You can use these strategies on All Time Frames but you need to check before use. We are using
Early Buy/sell strategy mostly on 1H chart
P/D on 8H chart
Buy/Sell and Strong Buy/Sell on 1D chart
but also using these strategies on LTF such as 5m-15m .
You can show/hide strategies on indicator settings/style menu.
Early Buy/Sell strategy has "take profit points" and "stop loss" point which you can adjust on settings panel (percent %)
Colored bars shows us the direction of trends by indicating local tops and dips. You can show/hide and adjust color on indicator settings/style menu
It has custom alerts for all signals. Signals appear/disappear on the chart during the current candle but you can set alerts at the end of the current candle. Set Alarms:
- click "create alarms" on top toolbar
- Conditions: select as PosBar
- Choose one condition: Buy, Sell, Early Buy, Early Sell, Pump, Dump, Strong Buy, Strong Sell, Take Profit or Stop Loss
- once per bar / once per bar closed (If you don't want to see disappeared signals on alarm list please select once per bar closed. So you can get alerts after bar closed.)
- set expiration time, alert actions, messages
- click create.
These indicator is not just about cryptocurrencies so you can set buy/sell/take profit/stop alerts on all tickers.
PM us to obtain access this indicator.

Simple and efficient MACD crypto strategy with risk managementToday I am glad to bring you another great creation suited for crypto markets.
MARKET
Its a simple and efficient strategy, designed for crypto markets( btcusd , btcusdt and so on), and suited for for higher time charts : like 1hour, 4hours, 1 day and so on.
Preferably to use 1h time charts.
COMPONENTS
MACD with simple moving average
ENTRY DESCRIPTION
For entries we have :
We check the direction with MACD . Depending if its an uptrend and positive level on histogram of MACD we go long, otherwise we go short.
RISK MANAGEMENT
In this strategy we use a stop loss based on our equity. For this example I choosed a 2% risk .That means if our account has 100.000 eur, it will automatically close the trade if we lose 2.000.
We dont use a take profit level.
In this example also we use a 100.000 capital account, risking 5% on each trade, but since its underleveraged, we only use 5000 of that ammount on every trade. With leveraged it can be achieved better profits and of course at the same time we will encounter bigger losses.
The comission applied is 5$ and a slippage of 5 points aswell added.
For any questions or suggestions regarding the script , please let me know.

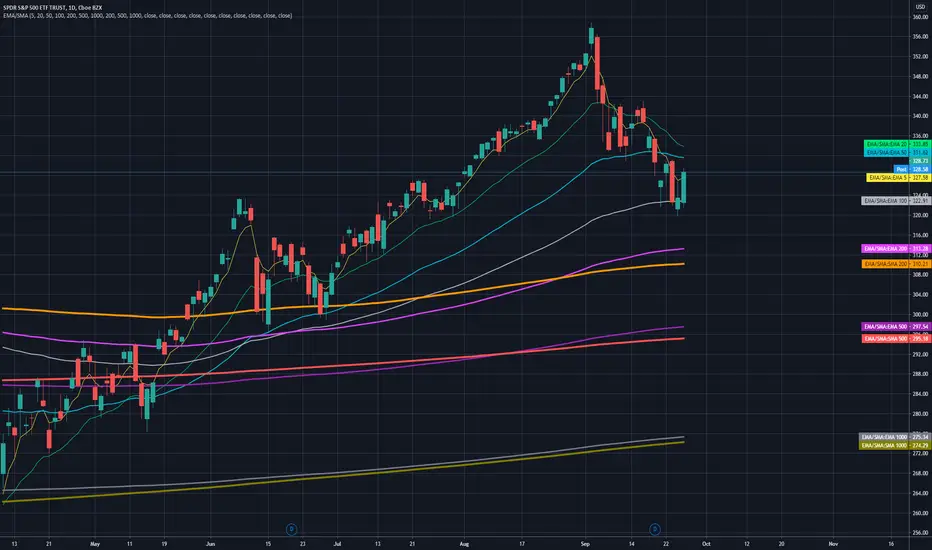
All LinesThe objective of this script is to try to display as many overlay indicators as possible simultaneously while keeping the clutter to a minimum.
--Included are Indicators are--
sma 20 50 100 200
ema 20 50 100 200
High/Low
Bollinger bands upper/lower
Pivot points PP R1 R2 R3 S1 S2 S3
-- For Time periods --
Hour,Day,Week
--- How To Use --
Switch it on when looking for likely support or resistance areas to plot your trade.
The more lines that overlay each other indicate even greater support/resistance at that point
meaning if the price is going down it may bounce up at this area or if the price is going up it may bounce down.
Also the more visible the line the more strength it has to effect the price. This value can be edited in settings by adjusting the power value for each indicator as it can often depend on what you are trading.
--Tips--
If you want to know what the line represents hover your cursor over the dot at the end of the line and a tool tip will appear.
If there are to many circles zoom in the price more to separate them and try to hover again.

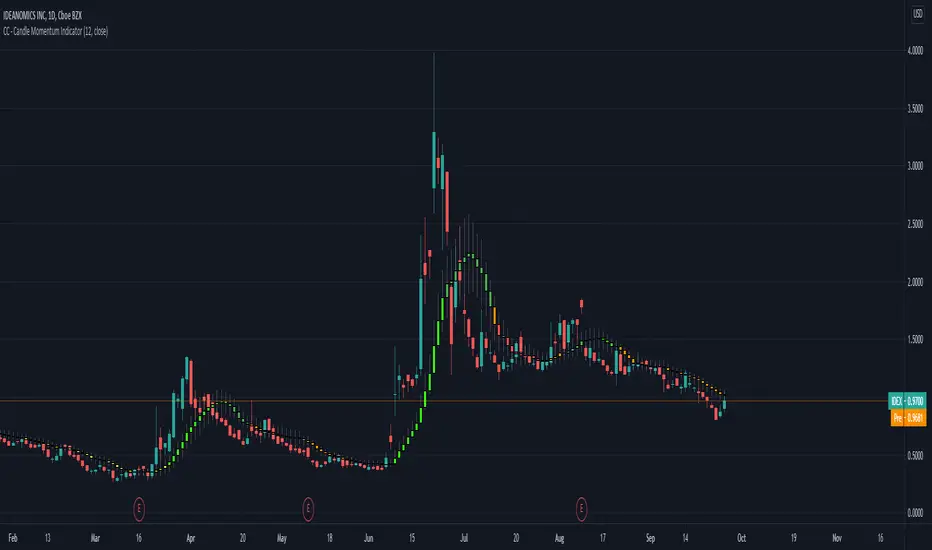
CC - Candle Momentum IndicatorA simple VWAP and SMA smoothing on the candles along with some momentum coloring. Basically, if the "slider" is slid all the way up and it turns red, moving down or losing volume t's probably going down. If it's all the way down and starts turning green, getting bigger and seeing volume, it's probably going up. this is a prototype indicator that I plan to extend using arrays and averages if it is seen as something useful.
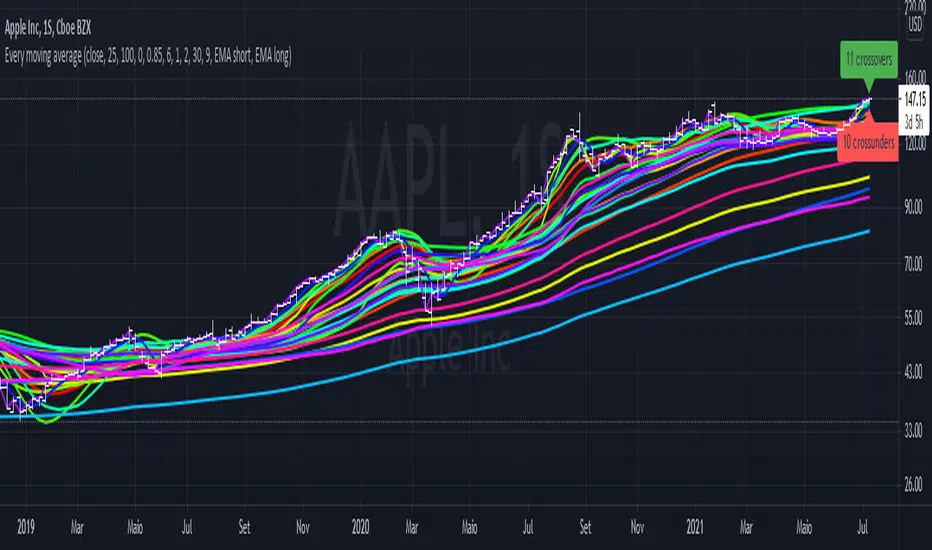
Every single moving average (ALMA, EMA, HMA, KAMA, RMA, SMA...)So you may be looking at the graph and thinking "this is a mess", and I agree.
The purpose of this script is to plot in the same graph every single type of moving average that I could think of, so you can find the ones that are better for your timeframe and for your asset. Once you add it, disable those types that doesn't seem to serve your purpose, until you can select one you like.
The average types are: ALMA, EMA, HMA, KAMA, RMA, SMA, SWMA, VIDYA, VWAP, VWMA, and WMA. Each one is ploted two times (except SWMA and VWAP), one with a short period, and another with a long, both of which you can configure.
7 EMA 3 SMA with nameplatesScript provides 7 EMA (5 20 50 100 200 500 1000), 3 SMA (200 500 1000) with built-in nameplates for easier navigation. Different colors and widths from the start just to make your initial tuning a bit easier.
Based on Bubsan and Silkheat multicombo, heavily modified, but still huge kudos to guys for the base code.
Modifications: lengths adjusted, on-chart nameplates added, 2 EMA's added, SMA's reduced, static SMA's deleted.
DCA LinesThis is an indicator which shows your position's average price of you started dollar cost averaging 30, 60, 90, 120, 150 and 180 bars ago.
Dollar Cost Averaging (DCA) means buying into a position by investing a fixed sum every bar (for example every day or every week). This way, when the coin of stock goes down, you buy more of the stock.
Some exchanges such as Coinbase, Revolut or River Financial offer this option of entering a position using automatic DCA. It's a kind of "set it and forget it" investment (but you still have to be careful to sell your position into profit).
There are people who DCA into an ETF every week for many years, and so build a position at a very advantageous average price.

CC - Array-meta Consolidated Interval Display (ACID)This script extends my other two Array examples (which I've also provided to you open source):
The Ticker-centric 5m,15m,45m,1h,4h,1d resolution labels using arrays:
And the more Macro VIX,GLD,TLT,QQQ,SPY,IWM 1d resolution labels using arrays:
This script aims to show how to use min/max/avg with Arrays easily. My next example after this will be exploring the usage of variance versus covariance ratios over different periodic interval resolutions. Currently, this is using the following intervals: 5m,15m,45m,1h,4h,1d. It takes these intervals, calculates the values at those resolutions and puts the absolute min and max from the 5 minute to the 1 day resolutions.
It's more of an example of the power that arrays can hold, as all this truly is right now is a min/max bound calculator. The real gem lies in the avg calculators for multiple resoltuions tied into a single label with readable data. Check out the code and let me know what you think. If you need more examples, the other two scripts I mentioned before are also open source.
Using this on intervals of less than 1D sometimes times out, the way I wrote it is memory intensive, may not work for non-pro users.
Thanks!
NONE OF THIS IS FOREWARD LOOKING STATEMENTS, THIS IS NOT A PREDECTIVE ANALYSIS TOOL. THIS IS A RESEARCH ATTEMPT AT A NOVEL INDICATOR. I am not responsible for outcomes using it.
Please use and give criticisms freely. I am experimenting with combining resolutions and comparing covariance values at different levels right now, so let me know your thoughts! The last indicator will likely not be open source, but may be depending on how complex I get.

Multi timeframes 4 SMA'sThis script gives you the possibility to fastly plot 4 SMA's (défault 20, 50, 100 and 200 periods) in the actual TimeFrame and for 4 others timeframes.
In fact, when you're in lower timeframes, you may want to see where highers TF SMA's are without always changing the TF of the chart. This script was created for that.
It's really simply to use, by default only 4 SMA's of the present timeframe are ploted. If you want to check the higher TF SMA's, just tick the lines in the script parameters.
No strategy here, only trying to faster the use of indicators by changing parameters on multiple MA in the same time.
Don't hesitate to leave a comment if you have ideas to improve the script.
Enjoy !

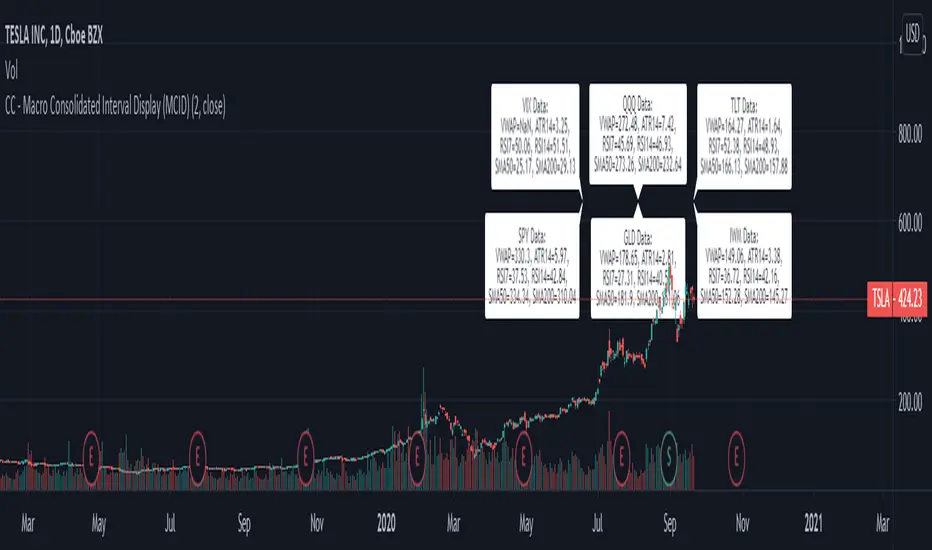
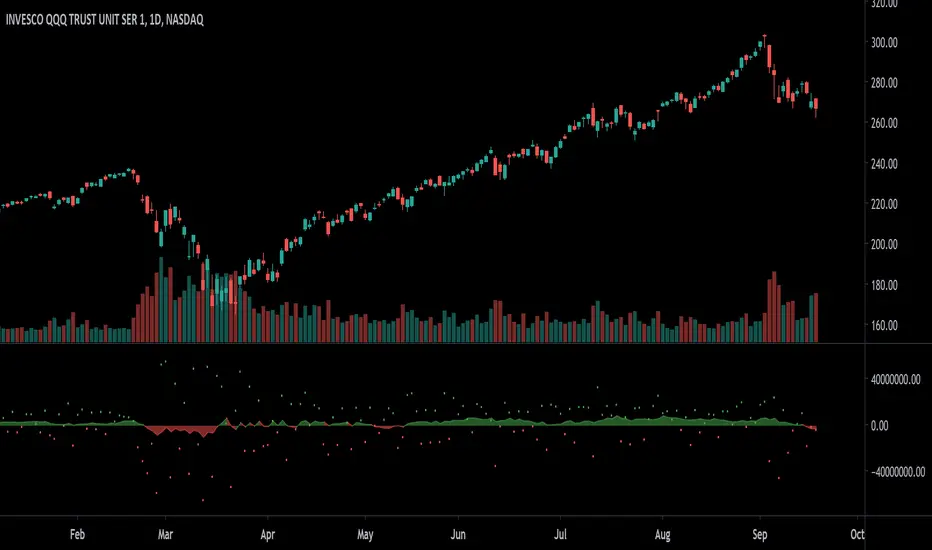
CC - Macro Consolidated Interval Display (MCID)Ever wish you didn't have to rapidly flip between 6 different tickers to get the full picture?
Yeah, me too. Do you also wish that you kind of understood how the shift / unshift function works for arrays?
Yeah, I did too. Both of those birds are taken care of with one stone!
The Macro Consolidated Interval Display uses the new Array structure and security to display data for VIX, GLD, TLT, QQQ, SPY and IWM (at a 1D interval) SIMUTANEOUSLY! Regardless of which ticker you're looking at you can get the full picture of macro futures data without flipping around to get it.
This is my first script trying to use arrays. It basically shows the following a 1d interval:
ATR14, RSI7, RSI14, SMA50, SMA200 and VWAP for VIX.
ATR14, RSI7, RSI14, SMA50, SMA200 and VWAP for GLD.
ATR14, RSI7, RSI14, SMA50, SMA200 and VWAP for TLT.
ATR14, RSI7, RSI14, SMA50, SMA200 and VWAP for QQQ.
ATR14, RSI7, RSI14, SMA50, SMA200 and VWAP for SPY.
ATR14, RSI7, RSI14, SMA50, SMA200 and VWAP for IWM
To make it more or less busy, I've allowed you to toggle off any of the levels you wish. I've also chosen to leave this as open source, as it's nothing too experimental, and I hope that it can gain some traction as an Array example that the public can use! If you don't like the different values that are shown, use this source code example as a spring-board to put values that you do care about onto the labels.
If this code has helped you at all please drop me a like or some constructive criticism if you do not think it's worth a like.
Good luck and happy trading friends. This should be compatible with my CID as well:
If this gets traction, I will post something similar for a dynamic combination of tickers and intervals that you can set yourself.
WR Robo Level 1FCPO trading robot alert is based on one of the popular WR Level 1 Technique strategy.
This alert is suitable to used by personal who are understand WR Level 1 Technique.
The script will identify candle that is touch SMA line and trend candle (in direction of Long or Short) to determine either to go with Long or Short entry.
Once entry is confirm, script will popup one label with detail of Long Entry Condition or Short Entry Condition.
This is an example of Long Entry Condition :
This is an example of Short Entry Condition :
Recommended Chart Settings:
Asset Class: FCPO Active Contract
Time Frame: 15 Minute
Long Entry Conditions:
a) Green Label with information of Buy Stop value, Take Profit Value and Stop Loss Value
b) Buy Stop value will be plot with Black Circle symbol on the chart
b) Take Profit value will be plot with Orange Cross symbol on the chart
b) Stop Loss value will be plot with Red Cross symbol on the chart
Short Entry Conditions:
a) Red Label with information of Sell Stop value, Take Profit Value and Stop Loss Value
b) Sell Stop value will be plot with Black Circle symbol on the chart
b) Take Profit value will be plot with Orange Cross symbol on the chart
b) Stop Loss value will be plot with Red Cross symbol on the chart
The entry label will appear once WR Level 1 Technique is valid.
Exit Conditions:
a) Stop loss level is hit
b) Take profit level is hit
c) Last candle at the end of the day (at 17:59:45 or earlier)
Default Robot Settings:
Simple Moving Average ( SMA ) : 50
Disclaimer:
This is a FCPO trading strategy that involves high risk of equity loss, You agree to use this script at your own risk.
If you have any suggestions, comments or interested to use this script, kindly PM us to obtain an access.

JBravo SwingThis follows Johnny Bravo Dominate Stocks strategy. When full price bar closes above SMA 9, this indicates a buy. When price bar closes below EMA20, this indicates a sell. If the MAs are all sloping up and aligned in order 9,20,180, then this indicates a Strong Buy. If the MAs are all sloping down and aligned in order 180,20,9, then this indicates a Strong Sell.

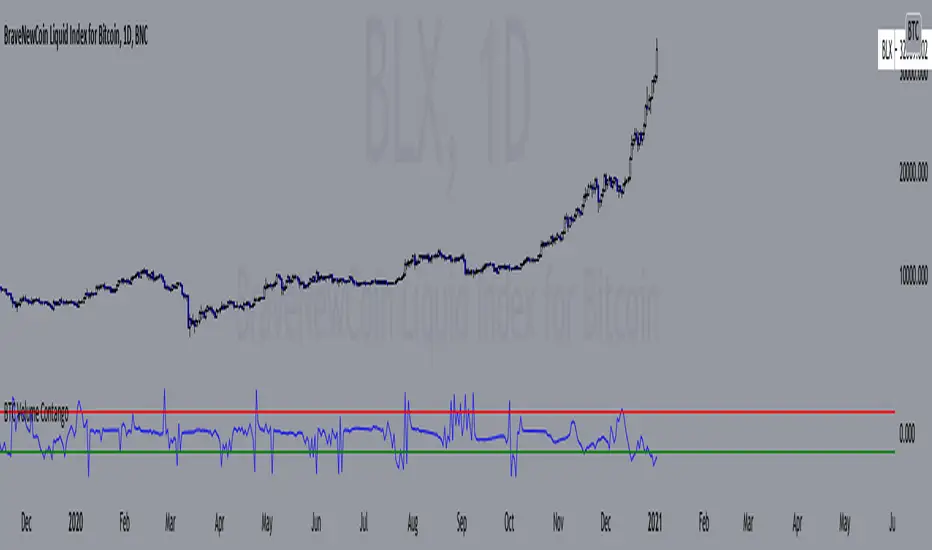
BTC Volume Contango IndexBased on my previous script "BTC Contango Index" which was inspired by a Twitter post by Byzantine General:
This is a script that shows the contango between spot and futures volumes of Bitcoin to identify overbought and oversold conditions. When a market is in contango, the volume of a futures contract is higher than the spot volume. Conversely, when a market is in backwardation, the volume of the futures contract is lower than the spot volume.
The aggregate daily volumes on top exchanges are taken to obtain Total Spot Volume and Total Futures Volume. The script then plots (Total Futures Volume/Total Spot Volume) - 1 to illustrate the percent difference (contango) between spot and futures volumes of Bitcoin. This data by itself is useful, but because aggregate futures volumes are so much larger than spot volumes, no negative values are produced. To correct for this, the Z-score of contango is taken. The Z-score (z) of a data item x measures the distance (in standard deviations StdDev) and direction of the item from its mean (U):
Z-score = (x - U) / StDev
A value of zero indicates that the data item x is equal to the mean U, while positive or negative values show that the data item is above or below the mean (x Values of +2 and -2 show that the data item is two standard deviations above or below the chosen mean, respectively, and over 95.5% of all data items are contained within these two horizontal references). We substitute x with volume contango C, the mean U with simple moving average ( SMA ) of n periods (50), and StdDev with the standard deviation of closing contango for n periods (50), so the above formula becomes: Z-score = (C - SMA (50)) / StdDev(C,50).
When in contango, Bitcoin may be overbought.
When in backwardation, Bitcoin may be oversold.
The current bar calculation will always look incorrect due to TV plotting the Z-score before the bar closes.
Closing RangeIndicator shows the closing range of each bar. Closing range is where the bar closes (high - close) relative to the length of the wick (high - low). A close at the top of the wick would be 100%, middle 50%, bottom 0%.
In addition, the indicator multiplies closing range by volume to weight toward high volume days.
A simple moving average is applied to visualize trend in volume-weighted closing range over time.
Options include changing the threshold of bullish closes. The default is 50%, but you can view a close above 40% as a bullish.
Simple moving average can be enabled/disabled as well as the length adjusted.
Vervoort SmoothingThis script has both the Triple Exponential Moving Average (TEMA) and zero lag sma written as functions. Both from Capturing Profit with Technical Analysis (24-25) by Sylvain Vervoort.
Best regards,
capam

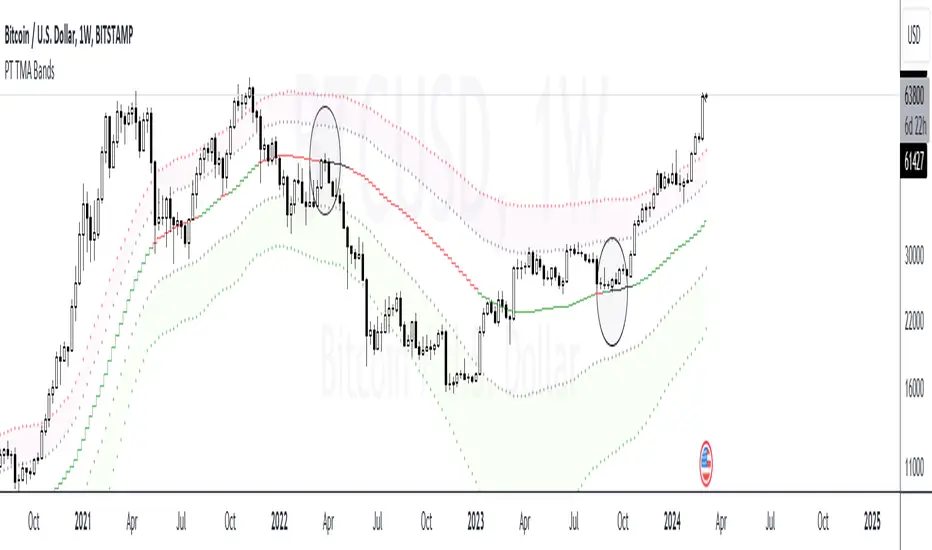
PT TMA BandsVersion 1.0 of our TMA Bands is a visual of areas of interest. The purpose of this indicator is to determine where the price will likely bounce or reject. When an asset is ranging, it very well respects the neutral (middle) zone. The highest RR trade setups are when the price goes from one end of the bands to another.
The bands included are of an ATR multiplier based on multiple moving averages. Each moving average has a unique feature that offers a high probability reaction when price gravitates towards it. We have color-coordinated the bands into three zones. The Main zone being the middle area where the asset tends to play ping pong & range, Top zone, which offers the best RR for shorts & the bottom zone, which provides the best RR for longs.
Strategy:
When scalping or swinging, always look for shorts close to the red zone as possible with a stop loss above the red band. When longing, always look for longs close to the green zone area with a stop loss below the green band. Anything in orange is a neutral zone, which will confirm the asset is more than likely ranging. I don’t advise taking trades in that zone unless you have solid risk management. When playing the macros, H12+ always look for price to find support at the orange (middle) band before deciding on a shift in trend. If the asset breaks down from the orange (middle) band, you usually get a retest of that band before further downside. Also, something to consider, if you punt longs at the green zone, you want to target the orange (middle) band. If you punt shorts at the red zone, you want to target the orange (middle) band. I usually take 70% off at the middle band & let the rest run if ultimately end up in the opposite zone.
This Oscillator is best with the buy/sell signals we provide. It offers extra confluence with stop loss & targets. I enjoy using it on all time frames for swinging & scalping. It is included as part of the library. Just message us for access!