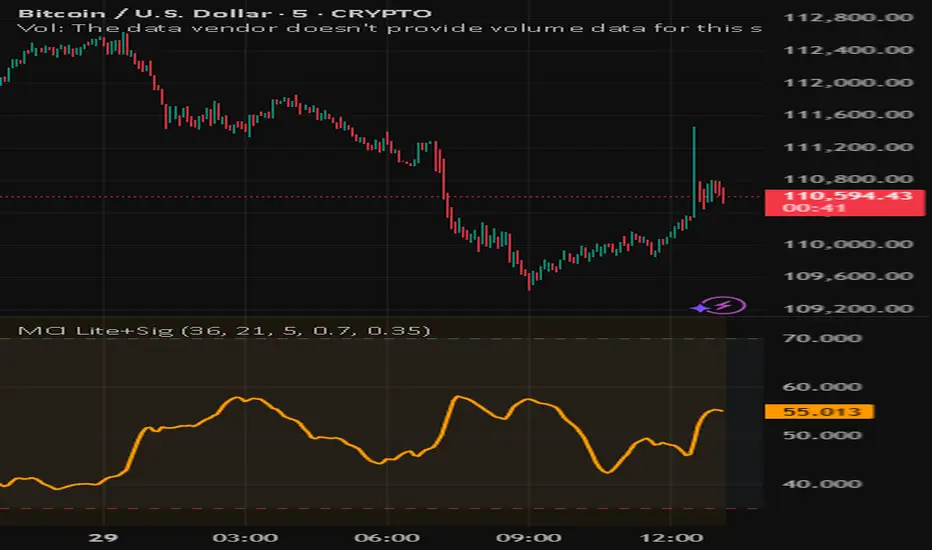
Snapfront Market Clarity Index (MCI) — LiteMarket Clarity Index (MCI) — Lite + Signals
The Market Clarity Index (MCI) measures trend clarity vs. noise using returns, drift, and volume shock dynamics. Values are normalized through a φ²-based sigmoid for smooth, interpretable signals.
Features:
Clear 0–100 scale (Lite version)
Heatmap background for clarity regimes
Bull/Bear signal arrows with EMA filter
High/Low threshold lines for easy context
Trading Logic:
✅ Bull signal when MCI crosses into the high zone with price above EMA
❌ Bear signal when MCI crosses into the low zone with price below EMA
Use MCI as a trend filter, entry trigger, or market condition gauge across any timeframe or asset.
Trend
Dual Channel System [Alpha Extract]A sophisticated trend-following and reversal detection system that constructs dynamic support and resistance channels using volatility-adjusted ATR calculations and EMA smoothing for optimal market structure analysis. Utilizing advanced dual-zone methodology with step-like boundary evolution, this indicator delivers institutional-grade channel analysis that adapts to varying volatility conditions while providing high-probability entry and exit signals through breakthrough and rejection detection with comprehensive visual mapping and alert integration.
🔶 Advanced Channel Construction
Implements dual-zone architecture using recent price extremes as foundation points, applying EMA smoothing to reduce noise and ATR multipliers for volatility-responsive channel widths. The system creates resistance channels from highest highs and support channels from lowest lows with asymmetric multiplier ratios for optimal market reaction zones.
// Core Channel Calculation Framework
ATR = ta.atr(14)
// Resistance Channel Construction
Resistance_Basis = ta.ema(ta.highest(high, lookback), lookback)
Resistance_Upper = Resistance_Basis + (ATR * resistance_mult)
Resistance_Lower = Resistance_Basis - (ATR * resistance_mult * 0.3)
// Support Channel Construction
Support_Basis = ta.ema(ta.lowest(low, lookback), lookback)
Support_Upper = Support_Basis + (ATR * support_mult * 0.4)
Support_Lower = Support_Basis - (ATR * support_mult)
// Smoothing Application
Smoothed_Resistance_Upper = ta.ema(Resistance_Upper, smooth_periods)
Smoothed_Support_Lower = ta.ema(Support_Lower, smooth_periods)
🔶 Volatility-Adaptive Zone Framework
Features dynamic ATR-based width adjustment that expands channels during high-volatility periods and contracts during consolidation phases, preventing false signals while maintaining sensitivity to genuine breakouts. The asymmetric multiplier system optimizes zone boundaries for realistic market behavior patterns.
// Dynamic Volatility Adjustment
Channel_Width_Resistance = ATR * resistance_mult
Channel_Width_Support = ATR * support_mult
// Asymmetric Zone Optimization
Resistance_Zone = Resistance_Basis ± (ATR_Multiplied * )
Support_Zone = Support_Basis ± (ATR_Multiplied * )
🔶 Step-Like Boundary Evolution
Creates horizontal step boundaries that update on smoothed bound changes, providing visual history of evolving support and resistance levels with performance-optimized array management limited to 50 historical levels for clean chart presentation and efficient processing.
🔶 Comprehensive Signal Detection
Generates break and bounce signals through sophisticated crossover analysis, monitoring price interaction with smoothed channel boundaries for high-probability entry and exit identification. The system distinguishes between breakthrough continuation and rejection reversal patterns with precision timing.
🔶 Enhanced Visual Architecture
Provides translucent zone fills with gradient intensity scaling, step-like historical boundaries, and dynamic background highlighting that activates upon zone entry. The visual system uses institutional color coding with red resistance zones and green support zones for intuitive
market structure interpretation.
🔶 Intelligent Zone Management
Implements automatic zone relevance filtering, displaying channels only when price proximity warrants analysis attention. The system maintains optimal performance through smart array management and historical level tracking with configurable lookback periods for various market conditions.
🔶 Multi-Dimensional Analysis Framework
Combines trend continuation analysis through breakthrough patterns with reversal detection via rejection signals, providing comprehensive market structure assessment suitable for both trending and ranging market conditions with volatility-normalized accuracy.
🔶 Advanced Alert Integration
Features comprehensive notification system covering breakouts, breakdowns, rejections, and bounces with customizable alert conditions. The system enables precise position management through real-time notifications of critical channel interaction events and zone boundary violations.
🔶 Performance Optimization
Utilizes efficient EMA smoothing algorithms with configurable periods for noise reduction while maintaining responsiveness to genuine market structure changes. The system includes automatic historical level cleanup and performance-optimized visual rendering for smooth operation across all timeframes.
Why Choose Dual Channel System ?
This indicator delivers sophisticated channel-based market analysis through volatility-adaptive ATR calculations and intelligent zone construction methodology. By combining dynamic support and resistance detection with advanced signal generation and comprehensive visual mapping, it provides institutional-grade channel analysis suitable for cryptocurrency, forex, and equity markets. The system's ability to adapt to varying volatility conditions while maintaining signal accuracy makes it essential for traders seeking systematic approaches to breakout trading, zone reversals, and trend continuation analysis with clearly defined risk parameters and comprehensive alert integration. Also to note, this indicator is best suited for the 1D timeframe.

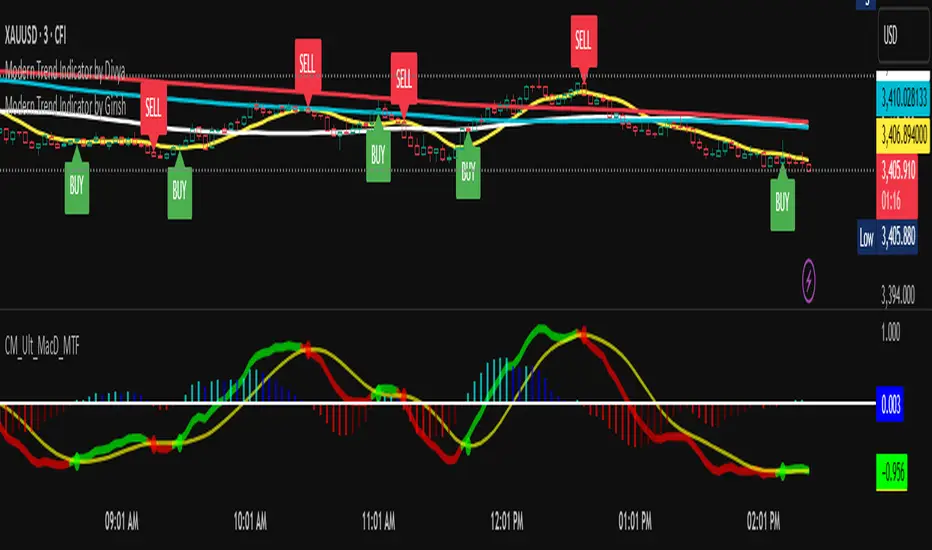
Modern Trend Indicator_GirishThis Indicator is a Powerful Buy and Sell Indicator to catch the Trend in all time frame.
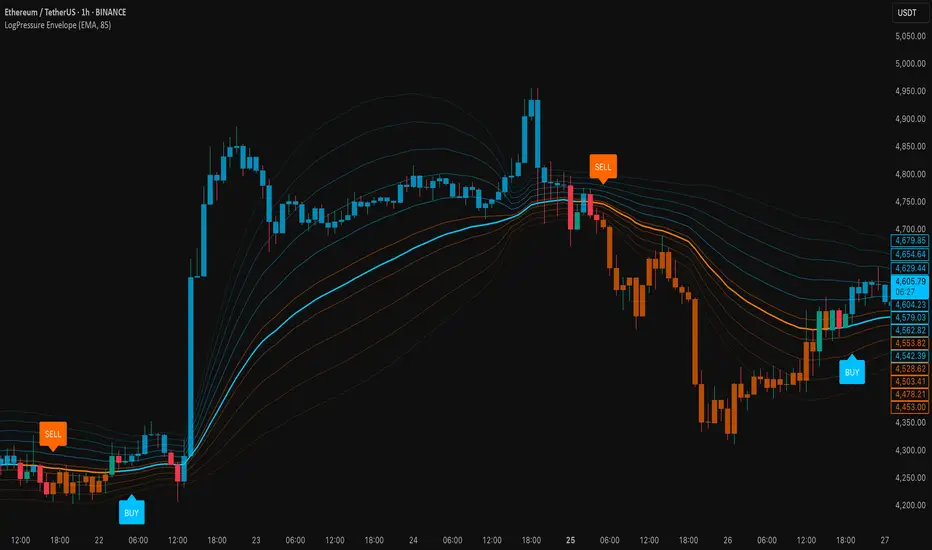
LogPressure Envelope [BOSWaves]LogPressure Envelope – Adaptive Volatility & Trend Visualizer
Overview
LogPressure Envelope is a specialized trading tool designed to normalize market behavior using logarithmic price scaling while providing an adaptive framework for volatility and trend detection. The indicator calculates a log-based moving average midline, surrounds it with asymmetric volatility envelopes, and replaces the conventional cloud with progressive fan lines to present price action in a more interpretable form.
By integrating rate-of-change midline coloring, fading trend strength, and structured buy/sell markers, LogPressure Envelope simplifies the reading of complex market dynamics. Its design makes it suitable for multiple trading approaches, including scalping, intraday, and swing trading, where volatility behavior and trend shifts must be understood quickly and objectively.
Unlike static envelope indicators, LogPressure Envelope adapts continuously to price scale and volatility conditions. It evaluates log-transformed prices, applies configurable moving average methods (EMA, SMA, WMA), and derives asymmetric standard-deviation bands for both upside and downside moves. These envelopes are projected as fan lines with adjustable opacity, producing a layered volatility map that evolves with the market.
This system ensures each visual element—midline shading, candle coloring, fan structure, and signal markers—reflects real-time market conditions, allowing traders to interpret volatility expansion, contraction, and directional bias with clarity.
How It Works
The foundation of LogPressure Envelope is the logarithmic transformation of price. By operating in log space, the indicator removes distortions caused by large nominal price differences across assets, enabling consistent analysis of both low-priced and high-priced instruments.
A moving average of log prices is calculated (EMA, SMA, or WMA depending on user input) and then re-converted to normal price scale, forming the log midline. Standard deviation of log prices is then measured over a separate period, with independent multipliers for upside and downside deviations. This asymmetry captures the fact that markets often expand differently in bullish versus bearish phases.
Instead of plotting a filled cloud, the envelope is expressed as ten equidistant fan lines stretching from the lower to upper boundary. Each line is shaded progressively to visualize volatility clustering and directional strength without overloading the chart.
Trend determination is smoothed using a fade mechanism: shifts in bias do not flip instantly but gradually move toward the new state, producing fewer false transitions. Buy and sell markers are generated when trend strength crosses confirmation thresholds, ensuring signals are event-driven and contextually meaningful.
Signals and Visuals
LogPressure Envelope provides multiple layers of structured signals:
Midline Bias – Central moving average colored by rate-of-change, reflecting directional acceleration or deceleration.
Volatility Fan – Ten progressive lines forming a gradient between lower and upper bands, visually encoding volatility spread.
Buy Signals – Labels below bars when upward trend strength is confirmed.
Sell Signals – Labels above bars when downward trend strength is confirmed.
Candle Coloring – Optional shading of candles based on trend alignment with the log midline, highlighting bullish, bearish, or neutral conditions.
These signals remain clear even during high-volatility phases, with visual hierarchy maintained through progressive opacity control.
Interpretation
Trend Analysis : Midline direction and candle coloring provide continuous feedback on prevailing bias. Upward-sloping midlines with blue shading indicate bullish phases, while downward slopes with orange shading confirm bearish conditions.
Volatility and Risk Assessment : Expansion of fan lines indicates rising volatility and potential breakout conditions; contraction indicates consolidation and possible mean reversion.
Signal Confirmation : Buy and sell markers validate transitions when trend strength thresholds are crossed, aligning with volatility envelope dynamics.
Market Context : Asymmetric envelopes allow traders to see where bearish acceleration differs from bullish expansion, improving interpretation of liquidity conditions and institutional pressure.
Strategy Integration
LogPressure Envelope can be applied across trading styles:
Trend Following : Enter trades in the direction of midline bias, confirmed by buy or sell markers.
Pullback Entries : Use midline retests during trending conditions as lower-risk continuation points.
Volatility Breakouts : Identify sharp expansions in fan line spacing as early signals of directional moves.
Reversal Strategies : Fade extreme envelope touches when momentum shows exhaustion and fan contraction begins.
Multi-Timeframe Confirmation : Align signals from higher and lower timeframes to reduce noise and validate trade setups.
Stop-loss levels can be set near the opposite envelope boundary, while targets may be managed through progressive volatility zones or midline convergence.
Advanced Techniques
For greater precision, LogPressure Envelope can be combined with other analytical tools:
Pair with volume or liquidity measures to validate breakout or reversal conditions.
Use momentum indicators to confirm ROC-based midline bias.
Track sequences of fan line expansions and contractions to anticipate regime shifts in volatility.
Apply across multiple timeframes to monitor how volatility clusters align at different market scales.
Adjusting parameters such as envelope multipliers, moving average type, and fade bars allows the indicator to adapt to diverse asset classes and volatility environments.
Inputs and Customization
Midline Type : Select EMA, SMA, or WMA.
Line Opacity : Control visibility of fan lines.
Enable Candle Coloring : Toggle trend-based bar shading.
MA Length / StdDev Length : Define periods for midline and volatility calculation.
Multipliers : Set asymmetric scaling for upside and downside envelopes.
Fade Bars : Control smoothness of trend strength transitions.
Fan Lines : Adjust number of envelope subdivisions for visualization granularity.
Why Use LogPressure Envelope
LogPressure Envelope translates complex volatility and trend interactions into a structured and adaptive framework. By combining logarithmic normalization, asymmetric standard deviation envelopes, and smoothed trend confirmation, it allows traders to:
Normalize price analysis across assets of different scales.
Visualize volatility expansion and contraction in real time.
Identify and confirm directional shifts with objective signal markers.
Apply a disciplined system for trend, breakout, and reversal strategies.
This indicator is designed for traders who want a systematic, visually clear approach to volatility-based market analysis without relying on static bands or arbitrary scaling.
Moving Average Adaptive RSI [BackQuant]Moving Average Adaptive RSI
What this is
A momentum oscillator that reshapes classic RSI into a zero-centered column plot and makes it adaptive. It builds RSI from two parts:
• A sensitivity window that scans several recent bars to capture the strongest up and down impulses.
• A selectable moving average that smooths those impulses before computing RSI.
The output ranges roughly from −100 to +100 with 0 as the midline, with optional extra smoothing and built-in divergence detection.
How it works
Impulse extraction
• For each bar the script inspects the last rsi_sen bars and collects upward and downward price changes versus the current price.
• It keeps the maximum upward change and maximum downward change from that window, emphasizing true bursts over single-bar noise.
MA-based averaging
• The up and down impulse series are averaged with your chosen MA over rsi_len bars.
• Supported MA types: SMA, EMA, DEMA, WMA, HMA, SMMA (RMA), TEMA.
Zero-centered RSI transform
• RS = UpMA ÷ DownMA, then mapped to a symmetric scale: 100 − 200 ÷ (1 + RS) .
• Above 0 implies positive momentum bias. Below 0 implies negative momentum bias.
Optional extra smoothing
• A second smoothing pass can be applied to the final oscillator using smoothing_len and smooth_type . Toggle with “Use Extra Smoothing”.
Visual encoding
• The oscillator is drawn as columns around the zero line with a gradient that intensifies toward extremes.
• Static bands mark 80 to 100 and −80 to −100 for extreme conditions.
Key inputs and what they change
• Price Source : input series for momentum.
• Calculation Period (rsi_len) : primary averaging window on up and down components. Higher = smoother, slower.
• Sensitivity (rsi_sen) : how many recent bars are scanned to find max impulses. Higher = more responsive to bursts.
• Calculation Type (ma_type) : MA family that shapes the core behavior. HMA or DEMA is faster, SMA or SMMA is slower.
• Smoothing Type and Length : optional second pass to calm noise on the final output.
• UI toggles : show or hide the oscillator, candle painting, and extreme bands.
Reading the oscillator
• Midline cross up (0) : momentum bias turning positive.
• Midline cross down (0) : momentum bias turning negative.
• Positive territory :
– 0 to 40: constructive but not stretched.
– 40 to 80: strong momentum, continuation more likely.
– Above 80: extreme risk of mean reversion grows.
• Negative territory : mirror the same levels for the downside.
Divergence detection
The script plots four divergence types using pivot highs and lows on both price and the oscillator. Lookbacks are set by lbL and lbR .
• Regular bullish : price lower low, oscillator higher low. Possible downside exhaustion.
• Hidden bullish : price higher low, oscillator lower low. Bias to trend continuation up.
• Regular bearish : price higher high, oscillator lower high. Possible upside exhaustion.
• Hidden bearish : price lower high, oscillator higher high. Bias to trend continuation down.
Labels: ℝ for regular, ℍ for hidden. Green for bullish, red for bearish.
Candle coloring
• Optional bar painting: green when the oscillator is above 0, red when below 0. This is for visual scanning only.
Strengths
• Adaptive sensitivity via a rolling impulse window that responds to genuine bursts.
• Configurable MA core so you can match responsiveness to the instrument.
• Zero-centered scale for simple regime reads with 0 as a clear bias line.
• Built-in regular and hidden divergence mapping.
• Flexible across symbols and timeframes once tuned.
Limitations and cautions
• Trends can remain extended. Treat extremes as context rather than automatic reversal signals.
• Divergence quality depends on pivot lookbacks. Short lookbacks give more signals with more noise. Long lookbacks reduce noise but add lag.
• Double smoothing can delay zero-line transitions. Balance smoothness and timeliness.
Practical usage ideas
• Regime filter : only take long setups from your separate method when the oscillator is above 0, shorts when below 0.
• Pullback confirmation : in uptrends, look for dips that hold above 0 or turn up from 0 to 40. Reverse for downtrends.
• Divergence as a heads-up : wait for a zero-line cross or a price trigger before acting on divergence.
• Sensitivity tuning : start with rsi_sen 2 to 5 on faster timeframes, increase slightly on slower charts.
Alerts
• MA-A RSI Long : oscillator crosses above 0.
• MA-A RSI Short : oscillator crosses below 0.
Use these as bias or timing aids, not standalone trade commands.
Settings quick reference
• Calculation : Price Source, Calculation Type, Calculation Period, Sensitivity.
• Smoothing : Smoothing Type, Smoothing Length, Use Extra Smoothing.
• UI : Show Oscillator, Paint Candles, Show Static High and Low Levels.
• Divergences : Pivot Lookback Left and Right, Div Signal Length, Show Detected Divergences.
Final thoughts
This tool reframes RSI by extracting strong short-term impulses and averaging them with a moving-average model of your choice, then presenting a zero-centered output for clear regime reads. Pair it with your structure, risk and execution process, and tune sensitivity and smoothing to the market you trade.

Better Pivot Points [LuminoAlgo]Overview
The Better Pivot Points indicator is an advanced trend analysis tool that combines Supertrend methodology with automated pivot point identification and zigzag visualization. This indicator helps traders identify significant price turning points and visualize market structure through dynamic pivot labeling and connecting lines.
How It Works
This indicator utilizes a Supertrend-based algorithm to detect meaningful pivot points in price action. Unlike traditional pivot point indicators that rely on fixed time periods, this tool dynamically identifies pivots based on trend changes, providing more relevant and timely signals.
The algorithm tracks trend changes using ATR-based Supertrend crossovers to determine when significant highs and lows have formed. When a trend reversal is detected, the indicator marks the pivot point and draws connecting lines to visualize price flow and market structure progression.
Key Features
• Dynamic Pivot Detection: Automatically identifies high and low pivot points using Supertrend crossovers
• Market Structure Labeling: Labels pivots as HH (Higher High), LH (Lower High), HL (Higher Low), or LL (Lower Low)
• Zigzag Visualization: Connects pivot points with customizable lines to clearly show price flow and market structure
• Color-Coded Analysis: Uses distinct colors to indicate bullish trends (green), bearish trends (red), and neutral conditions (yellow)
• Customizable Parameters: Adjustable ATR period, factor, line width, and line style
Input Settings
• ATR Length: Controls the sensitivity of the Supertrend calculation (default: 21)
• Factor: Multiplier for the ATR-based Supertrend bands (default: 2.0)
• Zigzag Line Width: Customize the thickness of connecting lines (1-4)
• Zigzag Line Style: Choose between Solid, Dashed, or Dotted line styles
What Makes This Original
This indicator combines several analytical concepts into a cohesive tool that differentiates it from standard pivot point indicators:
1. Uses Supertrend crossovers as the trigger for pivot detection rather than traditional high/low lookback periods
2. Automatically categorizes market structure using HH/LH/HL/LL labeling system based on pivot relationships
3. Provides real-time zigzag visualization with intelligent color coding that reflects trend direction
4. Integrates trend direction analysis with structural pivot identification in a single comprehensive tool
The underlying calculations use custom logic for tracking trend states, validating pivot points, and determining appropriate color coding based on market structure analysis.
How to Use
1. Trend Identification: Green lines indicate bullish market structure, red lines show bearish structure, yellow indicates transitional periods
2. Support/Resistance: Pivot points often act as future support and resistance levels for price action
3. Market Structure Analysis: HH and HL patterns suggest uptrends, while LH and LL patterns indicate downtrends
4. Entry/Exit Planning: Use pivot points and trend changes to plan potential trade entries and exits
Important Limitations and Warnings
• This indicator is a technical analysis tool and should not be used as the sole basis for trading decisions
• Pivot points are identified after price moves occur, meaning this indicator has inherent lag and cannot predict future pivots
• False signals can occur during ranging or choppy market conditions where trends are unclear
• Past performance of any indicator does not guarantee future results or trading success
• The indicator works best in clearly trending markets and may produce less reliable signals in sideways price action
• This tool requires interpretation and should be combined with other forms of analysis
• Always use proper risk management and position sizing strategies when trading
Why This Script Is Protected
This indicator uses proprietary algorithms for pivot detection timing, trend state management, and market structure analysis that represent original research and development. The specific logic for pivot validation, color-coding methodology, and structural relationship calculations contains unique approaches that differentiate it from standard pivot point indicators available in the public library.
Disclaimer
This indicator is for educational and analysis purposes only and does not constitute investment advice. Trading involves substantial risk and is not suitable for all investors. Past results are not indicative of future performance. The future is fundamentally unknowable and past results in no way guarantee future performance. Always conduct your own research and consider your risk tolerance before making any trading decisions.

Price Heat Meter [ChartPrime]⯁ OVERVIEW
Price Heat Meter visualizes where price sits inside its recent range and turns that into an intuitive “temperature” read. Using rolling extremes, candles fade from ❄️ aqua (cold) near the lower bound to 🔥 red (hot) near the upper bound. The tool also trails recent extreme levels, tags unusually persistent extremes with a % “heat” label, and shows a bottom gauge (0–100%) with a live arrow so you can read market heat at a glance.
⯁ KEY FEATURES
Rolling Heat Map (0–100%):
The script measures where the close sits between the current Lowest Low and Highest High over the chosen Length (default 50).
Candles use a two-stage gradient: aqua → yellow (0–50%), then yellow → red (50–100%). This makes “how stretched are we?” instantly visible.
Dynamic Extremes with Time Decay:
When a new rolling High or Low is set, the script starts a faint horizontal trail at that price. Each bar that passes without a new extreme increases a counter; the line’s color gradually fades over time and fully disappears after ~100 bars, keeping the chart clean.
Persistent-Extreme Tags (Reversal Hints):
If an extreme persists for 40 bars (i.e., price hasn’t reclaimed or surpassed it), the tool stamps the original extreme pivot with its recorded Heat% at the moment the extreme formed.
• Upper extremes print a red % label (possible exhaustion/resistance context).
• Lower extremes print an aqua % label (possible exhaustion/support context).
Bottom Heat Gauge (0–100% Scale):
A compact, gradient bar renders at the bottom center showing the current Heat% with an arrow/label. ❄️ anchors the left (0%), 🔥 anchors the right (100%). The arrow adopts the same candle heat color for consistency.
Minimal Inputs, Clear Theme:
• Length (lookback window for H/L)
• Heat Color set (Cold / Mid / Hot)
The defaults give a balanced, legible gradient on most assets/timeframes.
Signal Hygiene by Design:
The meter doesn’t “call” reversals. Instead, it contextualizes price within its range and highlights the aging of extremes. That keeps it robust across regimes and assets, and ideal as a confluence layer with your existing triggers.
⯁ HOW IT WORKS (UNDER THE HOOD)
Range Model:
H = Highest(High, Length), L = Lowest(Low, Length). Heat% = 100 × (Close − L) / (H − L).
Extreme Tracking & Fade:
When High == H , we record/update the current upper extreme; same for Low == L on the lower side. If the extreme doesn’t change on the next bar, a counter increments and the plotted line’s opacity shifts along a 0→100 fade scale (visual decay).
40-Bar Persistence Labels:
On the bar after the extreme forms, the code stores the bar_index and the contemporaneous Heat% . If the extreme survives 40 bars, it places a % label at the original pivot price and index—flagging levels that were meaningfully “tested by time.”
Unified Color Logic:
Both candles and the gauge use the same two-stage gradient (Cold→Mid, then Mid→Hot), so your eye reads “heat” consistently across all elements.
⯁ USAGE
Treat >80% as “hot” and <20% as “cold” context; combine with your trigger (e.g., structure, OB, div, breakouts) instead of acting on heat alone.
Watch persistent extreme labels (40-bar marks) as reference zones for reaction or liquidity grabs.
Use the fading extreme lines as a memory map of where price last stretched—levels that slowly matter less as they decay.
Tighten Length for intraday sensitivity or increase it for swing stability.
⯁ WHY IT’S UNIQUE
Rather than another oscillator, Price Heat Meter translates simple market geometry (rolling extremes) into a readable temperature layer with time-aware extremes and a synchronized gauge . You get a continuously updated sense of stretch, persistence, and potential reversal context—without clutter or overfitting.

DM Impulse Enhanced [BackQuant]DM Impulse Enhanced
What this is (and what it isn’t)
DM Impulse Enhanced is a signal-driven overlay that classifies market action into two practical regimes: Long (risk-on) and Cash (risk-off). It’s built around a proprietary impulse model from the directional-movement family, wrapped in a persistence test and a state machine. Because this script is private, the core mechanics are intentionally abstracted here; what follows explains how to read and use it without revealing the protected calculation.
Why traders use it
Many tools oscillate or describe “how stretched” price is; fewer make a firm, operational call that you can automate. DM Impulse Enhanced aims to do exactly that declare when upside pressure is broad and durable enough to justify a long bias, and when deterioration is strong enough to stand aside (cash/short discretion). The emphasis is on impulse persistence rather than one-off spikes.
What you see on the chart
• Long / Cash markers – Green up-triangles (Long) and red down-triangles (Cash) plot at the bar where the regime changes.
• Regime-tinted bars (optional) – Candles can be softly shaded green during Long and red during Cash for at-a-glance context.
• Trend ribbon (context only) – A narrow ribbon (fast/slow moving averages) is tinted by the current regime to show trend alignment; it does not generate signals on its own.
• No separate sub-pane – Signals are intended to sit directly on price for immediate decision-making.
How the logic behaves (high-level)
Impulse core – A directional-movement–based engine estimates the strength of buying vs. selling pressure over a user-defined horizon.
Persistence gate – Instead of reacting to a single reading, the model evaluates how consistently that impulse dominates across a configurable lookback range.
State machine – When persistence clears (or fails) a pair of thresholds, the model flips and stays in that regime until evidence justifies a change. This “stickiness” is intentional; it reduces whipsaws in choppy tape.
Inputs & controls
Calculation Settings
• DM Length – The base horizon for the impulse engine. Longer = smoother/steadier; shorter = quicker/more reactive.
• Start / End – Defines the span of the persistence check. Expanding the span asks the market to prove itself against more history before changing regime.
Signal Settings
• Long Threshold – The persistence level required to promote the model into Long.
• Short Threshold – The level that, once crossed to the downside, demotes the model into Cash. Using a cross-under event for risk-off helps avoid premature exits on noise.
Visual Settings
• Long / Short colours – Customize marker and shading hues.
• Color Bars? – Toggle candle tinting by regime (off if you prefer a clean chart).
Reading the signals
• Long prints only when the model observes sustained upside pressure across the configured span. Treat this as permission to engage with pullbacks, breakouts, or your preferred setups in the direction of the trend.
• Cash prints when downside deterioration is strong enough to invalidate the prior regime. It’s a risk-off directive—flatten, hedge, or switch to short strategies according to your plan.
• Regime persistence is a feature: once Long, the model won’t flip on minor dips; once Cash, it won’t re-arm on minor bounces. If you want more flips, shorten the spans and relax thresholds; if you want fewer, do the opposite.
Practical tuning guide
Match DM Length to your timeframe
– Intraday: smaller length for timely response.
– Swing/Position: larger length to filter desk-noise and track higher-timeframe flows.
Size the persistence span to your goal
– Narrow span: faster regime changes, more trades, more noise.
– Wide span: fewer, higher-conviction calls, longer holds.
Set realistic thresholds
– The Long threshold should be reachable with your chosen span; the Short threshold should be low enough to catch genuine deterioration but not so tight that it flips on every dip.
Decide on cosmetics
– Turn on bar tinting for discretionary reading, or keep it off when exporting screenshots or running other overlays.
Suggested workflows
• Trend-following with discipline – Trade only in the Long regime; use structure (higher lows, anchored VWAP, or pullbacks to your MA stack) for entries and the Cash flip as a portfolio-level exit.
• Risk overlay – Keep your normal strategy, but: reduce size when Cash appears; re-enable full risk only after Long reasserts.
• Multi-timeframe gating – Require Long on a higher timeframe (e.g., 4H or 1D), then take entries on a lower one. If the high-TF posts Cash, stand down.
How the ribbon fits in
The ribbon visualizes short- vs. intermediate-term trend in the same colour as the regime. It’s deliberately “dumb”: it does not change the signal, it just helps you see when price action and regime are in harmony (e.g., pullbacks during Long that hold above the ribbon).
Alerts included
• DM Impulse LONG – Triggers as the persistence measure clears the Long threshold.
• DM Impulse CASH – Triggers when deterioration crosses the Short threshold from above.
Configure alerts to fire on bar close if you want final (non-intrabar) decisions.
Strengths
• Actionable binary output – Long/Cash is unambiguous and easy to automate.
• Persistence-aware – Focuses on runs that endure, not one-bar excitement.
• Asset/timeframe agnostic – Works anywhere you trust directional-movement concepts (equities, futures, crypto, FX).
Limitations & cautions
• Not a reversal caller – It’s a regime classifier. If you need early bottoms/tops, pair it with your own exhaustion or liquidity tools.
• Parameter feasibility matters – If your thresholds are set beyond what your span can reasonably achieve, signals may rarely (or never) trigger.
• Chop happens – In mean-reverting or news-driven tape, expect more frequent flips unless you widen spans and thresholds.
• Intrabar movement – Like any responsive model, provisional intrabar states can appear before the bar closes. Use “bar close” alerts for finality.
Getting started (safe defaults you can adapt)
• Intraday bias – Shorter DM Length, modest span, moderately tight thresholds.
• Swing filter – Longer DM Length, wider span, stricter Long and sufficiently low Short.
• Conservative overlay – Keep thresholds firm and spans wide; use signals to scale risk rather than flip directions frequently.
Summary
DM Impulse Enhanced is a persistence-focused regime classifier built on directional-movement concepts. It answers a narrow question clearly “Risk-on or risk-off?” and stays with that answer until the evidence meaningfully changes. Use it as a bias switch, a portfolio risk overlay, or a gate for your existing entry logic, and size its spans/thresholds to the cadence of the market you trade.

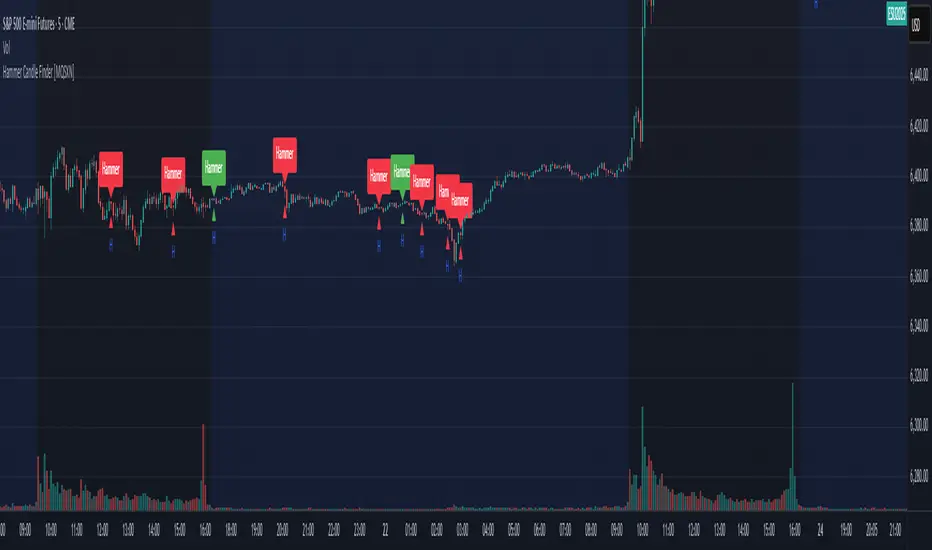
Hammer Candle Finder [MQSXN]This script automatically scans your chart for hammer candlestick patterns and highlights them with fully customizable labels and markers. Hammers are classic price action signals that can suggest potential reversals or exhaustion in the current trend.
How it works:
- Detects candles with a small body near the top of the range, a long lower wick, and minimal upper wick.
- Separates bullish hammers (green close above open) from bearish hammers (red close below open).
- You can choose to display either type—or both—depending on your trading style.
Customizable options:
- Adjustable detection sensitivity (body % of range, wick-to-body ratio, top wick allowance).
- Toggle to show/hide bullish or bearish signals.
- Custom text, colors, label style, and positioning for the markers.
- Option to anchor labels above bars automatically or offset them by a set number of ticks.
Usage:
This tool is designed for traders who want a clear, visual way to spot hammer candles in real time or during historical chart analysis. Combine it with your own support/resistance zones, volume analysis, or confirmation indicators to build complete strategies.
Note:
This indicator does not provide buy/sell signals on its own—it’s meant to assist with candlestick recognition. Always confirm with your broader trading plan and risk management rules.
(LES/SES) Compliment Net Volume(LES/SES) Compliment Net Volume
(LES/SES) Compliment Net Volume is a volume-based confirmation tool designed to show whether buyers or sellers are truly in control behind the candles. It acts as a compliment to the Long Elite Squeeze (LES) and Short Elite Squeeze (SES) frameworks, giving traders a clearer view of momentum strength.
Note! {Short Elite Squeeze (SES) Will be released in the Future}
-Designed to take shorts opposite of the long trades from LES
🔹 Core Logic
Net Volume Calculation – Positive volume when price closes higher, negative when price closes lower.
Cumulative Smoothing – Uses a rolling SMA of cumulative differences to remove noise.
Color Coding –
Green → Buyer dominance
Red → Seller dominance
Gray → Neutral pressure
🔹 How to Use
Above zero (green) → Buyers dominate → supports long setups (LES).
Below zero (red) → Sellers dominate → supports short setups (SES).
Flat/gray → No clear pressure → signals caution or chop.
This makes it easier to confirm when market participation aligns with a potential entry or exit.
🔹 Credit
The Compliment Net Volume was developed by Hunter Hammond (Elite x FineFir) as part of the LES/SES system.
The concept builds on classic Net Volume and cumulative volume analysis principles shared by the TradingView community, but has been uniquely adapted into the LES/SES framework.
⚠️ Disclaimer: This is a framework tool, not financial advice. Use with proper risk management.

Long Elite Squeeze (LES) — H.H 22 Lindsay (AI)LES (Long Elite Squeeze)
LES (Long Elite Squeeze) is a trading framework designed to capture the highest-probability long setups. It’s not just another signal script — it’s a structured system built to filter noise, manage risk, and keep you aligned with real momentum.
🔹 Core Logic
Breakout Confirmation – Ensures moves have structure, not just random spikes.
Relative Volume (RVOL) – Confirms participation and fuel behind the move.
RSI Alignment – Avoids overextended traps and fakeouts.
Squeeze Momentum – The backbone of LES. Signals fire only after a defined squeeze pattern shift (6+ dark green bars followed by a light green bar).
🔹 Trade Management Built In
Automated Sell Signals – Trigger on either:
2 consecutive dark green bars on Squeeze Momentum
WaveTrend cross down
(only valid after a Buy signal — no random shorts)
HUD Entry Checklist – Live conditions shown on chart.
Status Tracker HUD – Flips between “Waiting for Entry” and “In Trade” for clear context.
🔹 Flexibility
3 switchable squeeze versions (V1, V2, V3) for different market conditions.
Customizable EMA & ATR settings (with color options).
Session-aware logic — filter signals to prime trading hours.
🔹 Blueprint & Credits
LES is a fusion of proven concepts, standing on the shoulders of respected creators:
-Squeeze Momentum – LazyBear
-WaveTrend Oscillator – LazyBear
-Relative Volume – LonesomeTheBlue
Breakout/structural logic – refined from classic frameworks
Their work laid the foundation — LES expands and integrates them into a complete trading system.
⚡ Why LES Stands Out
LES wasn’t coded overnight. It’s the result of countless hours of live testing, rebuilding, and refining. Every feature earned its place by proving value in real trading, not theory.
LES is more than an indicator. It’s a disciplined framework — crafted to turn chaos into structure, randomness into probability, and noise into clarity.
⚠️ Disclaimer: This is a trading framework, not financial advice. Performance depends on trader discipline, risk management, and market conditions.

Vantage-XVANTAGE-X – The Market. Decoded.
Your vantage point between bull & bear — clarity, precision, and high-probability trading signals.
VANTAGE-X is a high-probability trading system designed to cut through the noise and deliver clarity at a glance.
🔹 What It Does
• EMA 20 (1H), EMA 50 (4H), EMA 200 (chart timeframe) → Instant bullish/bearish signals
• VWAP → Bullish/Bearish/Neutral, based on last 5 candles for precision
• Daily Bias → Bullish or Bearish without switching charts
• Chop Filter → Detects if market is trending or choppy (last 10 candles)
• Works across all assets on TradingView — futures, forex, stocks, crypto, options
🔹 Why Traders Use It
• Eliminates chart clutter and analysis paralysis
• No more flipping timeframes — dashboard updates automatically
• Clear signals = faster decisions, cleaner trades
🚨 Subscription Access Only – Invite-Only Script
This indicator is available exclusively to subscribed members of VANTAGE-X. Access is tied to your TradingView username and managed manually by our team.
👉 Website coming soon

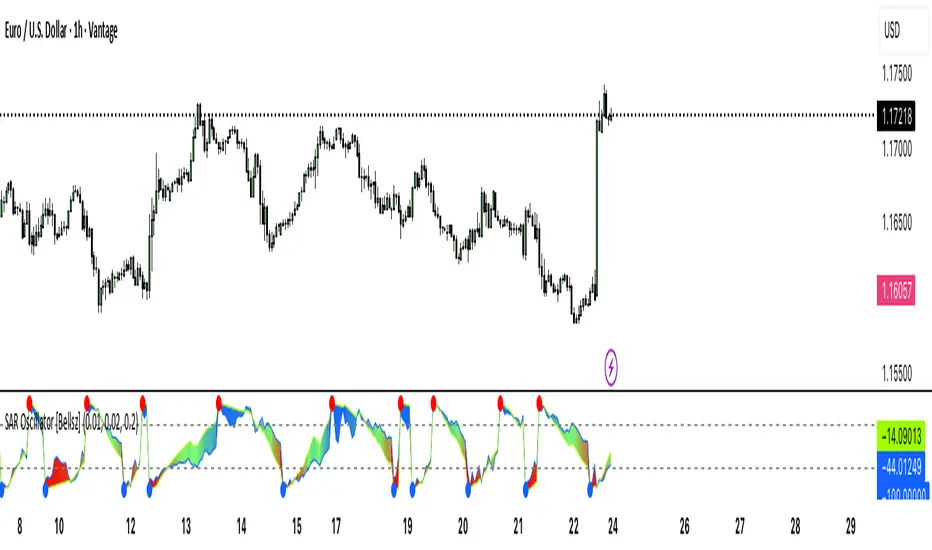
SAR Oscillator [Bellsz]Converts Parabolic SAR into a normalized oscillator with crossover signals, gradient fills, and trend strength levels. A cleaner way to read SAR momentum. Making it easier to read momentum shifts, trend strength, and reversals directly in the sub-chart. Instead of dots on price only, this tool converts SAR dynamics into a smooth oscillator that highlights bias and turning points.
What it shows
Normalized Price Line — scaled view of price relative to SAR.
Normalized SAR Line — SAR value normalized across the high/low range.
SAR Dots — visual cue when crossovers occur (potential reversal or trend acceleration).
Gradient Fill — color-coded background for quick read of momentum direction/intensity.
Guide Levels — ±50 baseline to track trend strength and overextension.
Why use it
Converts SAR into an oscillator format, easier to compare across instruments & timeframes.
Highlights momentum shifts early (crossovers, gradient flips).
Adds structure with gradient fill and baselines, making SAR more actionable than standard dot plots.
Works as a trend bias filter or confirmation tool alongside other indicators.
Inputs
Acceleration / Increment / Maximum — adjust SAR sensitivity.
Custom Colors — choose your scheme for price, SAR, and gradients.
Best practices
Use on intraday or swing TFs as a trend bias filter.
Look for Normalized Price crossing Normalized SAR as potential entry signals.
Watch how SAR dots cluster near ±100 for exhaustion or reversal signals.
Notes
This is a visual enhancement of SAR; it does not repaint.
Combine with volume, FVGs, or session models for added context.
Advanced Trend Momentum [Alpha Extract]The Advanced Trend Momentum indicator provides traders with deep insights into market dynamics by combining exponential moving average analysis with RSI momentum assessment and dynamic support/resistance detection. This sophisticated multi-dimensional tool helps identify trend changes, momentum divergences, and key structural levels, offering actionable buy and sell signals based on trend strength and momentum convergence.
🔶 CALCULATION
The indicator processes market data through multiple analytical methods:
Dual EMA Analysis: Calculates fast and slow exponential moving averages with dynamic trend direction assessment and ATR-normalized strength measurement.
RSI Momentum Engine: Implements RSI-based momentum analysis with enhanced overbought/oversold detection and momentum velocity calculations.
Pivot-Based Structure: Identifies and tracks dynamic support and resistance levels using pivot point analysis with configurable level management.
Signal Integration: Combines trend direction, momentum characteristics, and structural proximity to generate high-probability trading signals.
Formula:
Fast EMA = EMA(Close, Fast Length)
Slow EMA = EMA(Close, Slow Length)
Trend Direction = Fast EMA > Slow EMA ? 1 : -1
Trend Strength = |Fast EMA - Slow EMA| / ATR(Period) × 100
RSI Momentum = RSI(Close, RSI Length)
Momentum Value = Change(Close, 5) / ATR(10) × 100
Pivot Support/Resistance = Dynamic pivot arrays with configurable lookback periods
Bullish Signal = Trend Change + Momentum Confirmation + Strength > 1%
Bearish Signal = Trend Change + Momentum Confirmation + Strength > 1%
🔶 DETAILS
Visual Features:
Trend EMAs: Fast and slow exponential moving averages with dynamic color coding (bullish/bearish)
Enhanced RSI: RSI oscillator with color-coded zones, gradient fills, and reference bands at overbought/oversold levels
Trend Fill: Dynamic gradient between EMAs indicating trend strength and direction
Support/Resistance Lines: Horizontal levels extending from pivot-based calculations with configurable maximum levels
Momentum Candles: Color-coded candlestick overlay reflecting combined trend and momentum conditions
Divergence Markers: Diamond-shaped signals highlighting bullish and bearish momentum divergences
Analysis Table: Real-time summary of trend direction, strength percentage, RSI value, and momentum reading
Interpretation:
Trend Direction: Bullish when Fast EMA crosses above Slow EMA with strength confirmation
Trend Strength > 1%: Strong trending conditions with institutional participation
RSI > 70: Overbought conditions, potential selling opportunity
RSI < 30: Oversold conditions, potential buying opportunity
Momentum Divergence: Price and momentum moving opposite directions signal potential reversals
Support/Resistance Proximity: Dynamic levels provide optimal entry/exit zones
Combined Signals: Trend changes with momentum confirmation generate high-probability opportunities
🔶 EXAMPLES
Trend Confirmation: Fast EMA crossing above Slow EMA with trend strength exceeding 1% and positive momentum confirms strong bullish conditions.
Example: During institutional accumulation phases, EMA crossovers with momentum confirmation have historically preceded significant upward moves, providing optimal long entry points.
15min
4H
Momentum Divergence Detection: RSI reaching overbought levels while momentum decreases despite rising prices signals potential trend exhaustion.
Example: Bearish divergence signals appearing at resistance levels have marked major market tops, allowing traders to secure profits before corrections.
Support/Resistance Integration: Dynamic pivot-based levels combined with trend and momentum signals create high-probability trading zones.
Example: Bullish trend changes occurring near established support levels offer optimal risk-reward entries with clearly defined stop-loss levels.
Multi-Dimensional Confirmation: The indicator's combination of trend, momentum, and structural analysis provides comprehensive market validation.
Example: When trend direction aligns with momentum characteristics near key structural levels, the confluence creates institutional-grade trading opportunities with enhanced probability of success.
🔶 SETTINGS
Customization Options:
Trend Analysis: Fast EMA Length (default: 12), Slow EMA Length (default: 26), Trend Strength Period (default: 14)
Support & Resistance: Pivot Length for level detection (default: 10), Maximum S/R Levels displayed (default: 3), Toggle S/R visibility
Momentum Settings: RSI Length (default: 14), Oversold Level (default: 30), Overbought Level (default: 70)
Visual Configuration: Color schemes for bullish/bearish/neutral conditions, transparency settings for fills, momentum candle overlay toggle
Display Options: Analysis table visibility, divergence marker size, alert system configuration
The Advanced Trend Momentum indicator provides traders with comprehensive insights into market dynamics through its sophisticated integration of trend analysis, momentum assessment, and structural level detection. By combining multiple analytical dimensions into a unified framework, this tool helps identify high-probability opportunities while filtering out market noise through its multi-confirmation approach, enabling traders to make informed decisions across various market cycles and timeframes.

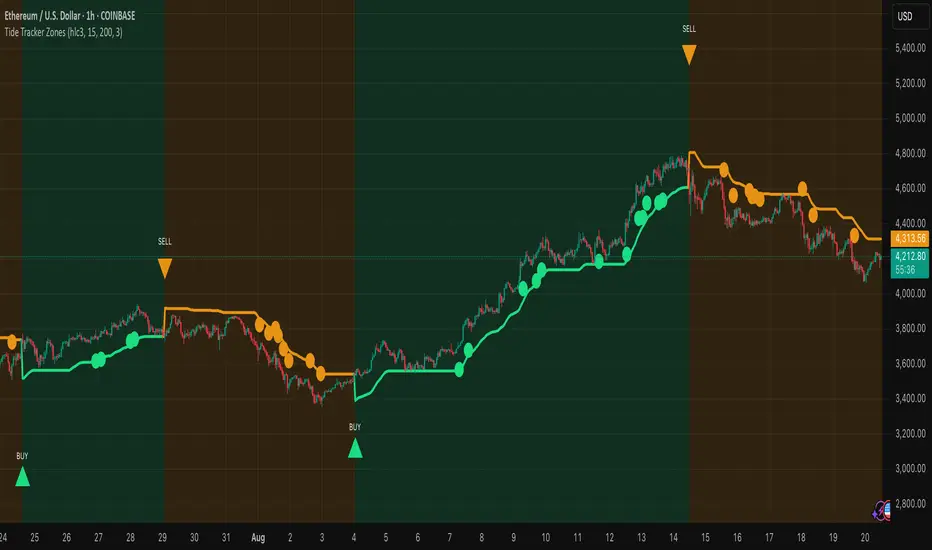
Tide Tracker ZonesTide Tracker Zones – Advanced Trend & Pullback Visualizer
Overview
Tide Tracker Zones is a sophisticated trading tool designed for traders who require clarity, precision, and actionable insights in real time. The indicator converts price action into dynamic trend zones, allowing users to instantly recognize market direction, potential reversals, and low-risk entry opportunities. By visualizing the market in this way, traders can focus on execution rather than deciphering complex charts.
Unlike static indicators, Tide Tracker Zones adapts to market volatility, providing a clear picture of bullish and bearish pressure across multiple timeframes. Its visual design, including color-coded trend zones, a prominent guide line, and carefully placed signals, ensures that market behavior is easy to interpret, making it suitable for scalping, swing trading, and longer-term strategies alike.
How It Works
The indicator relies on dynamic upper and lower bands derived from recent price ranges and a configurable multiplier. These bands expand during volatile periods and contract when price action stabilizes, creating flexible zones that reflect the dominant market tide.
A guide line tracks the active band, serving as a continuous reference for trend direction. Unlike traditional moving averages, the guide line does not clutter the chart but instead provides a subtle, intuitive indication of whether the market is in a bullish or bearish phase. Background shading reinforces this trend visually, highlighting bullish zones in one color and bearish zones in another, so the prevailing market flow is immediately clear.
The system continuously evaluates price relative to the bands to determine trend direction and detect potential reversals. When price crosses a band and flips the trend, the guide line updates, and signals are generated, providing traders with actionable information without overwhelming the chart.
Signals and Pullbacks
Tide Tracker Zones offers visual cues that make entry points more obvious and less speculative. Trend reversal arrows are plotted when the market changes direction: BUY arrows indicate a shift from bearish to bullish, and SELL arrows indicate a shift from bullish to bearish.
The indicator also highlights first pullbacks within an active trend. These pullback dots mark low-risk opportunities to enter a trend in progress, filtered to ensure that only the most relevant signals are displayed. The system uses ATR-based spacing to place arrows and dots vertically on the chart, preventing visual clutter and ensuring readability even during periods of high volatility.
Color-coded zones enhance situational awareness. Bullish zones are displayed in a customizable orange, while bearish zones are shown in green. Transparency is dynamically adjusted to maintain chart clarity while still providing a clear indication of trend strength.
Strategy Integration
Tide Tracker Zones can be used effectively for both trend-following and pullback strategies. Traders may enter positions in the direction of the guide line and colored zone, using trend reversal arrows for confirmation. First pullback dots offer tactical entries with reduced risk, allowing traders to enter a trend after a brief retracement.
Stop-loss levels can be placed just beyond the opposing trend zone, while take-profit targets may be determined using the width of the bands to account for market volatility. The indicator adapts seamlessly across multiple timeframes. Higher timeframes provide context and filter noise, while lower timeframes allow traders to refine entry timing. This makes it a versatile tool for scalping, swing trading, or longer-term positions.
Advanced Techniques
For traders seeking greater precision, Tide Tracker Zones can be combined with volume or momentum indicators to validate signals. Observing the sequence of trend arrows and pullback dots allows users to develop a systematic approach to entries and exits. Monitoring the width and behavior of the bands over time can also provide insights into periods of expanding or contracting volatility, helping traders anticipate market shifts.
Adjustments to the spread length and multiplier allow the indicator to be tuned for different assets and market conditions. By understanding the interaction between the guide line, trend zones, and pullback signals, traders can create a robust framework for decision-making, reducing guesswork and improving consistency.
Why Use Tide Tracker Zones
Tide Tracker Zones provides instant clarity and actionable insight in any market. Its dynamic zones and guide line give a clear visual understanding of trend direction, while trend reversal arrows and pullback dots highlight potential entry points. Unlike traditional indicators, it adapts to volatility and changing conditions, making it reliable across multiple asset classes and timeframes.
By combining trend detection, pullback analysis, and intuitive visual guidance, Tide Tracker Zones equips traders with a complete framework for disciplined, confident trading, transforming complex price action into a visual map of opportunity.
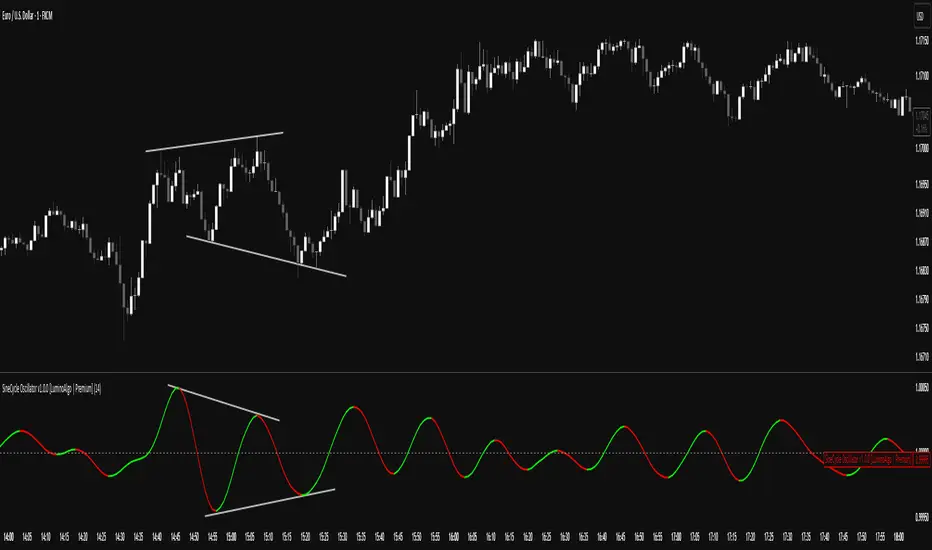
SigmoidCycle Oscillator [LuminoAlgo]Purpose:
The SineCycle Oscillator measures price momentum using sigmoid function mathematics (S-curve transformation) borrowed from neural network theory. It generates an oscillator that fluctuates around 1.0, identifying momentum shifts and potential reversal points.
Mathematical Foundation:
This indicator applies the sigmoid logistic function concept: y = 1/(1+e^-x) , which creates an S-shaped curve. In financial markets context, this transformation:
- Maps price changes to a bounded range (-1 to +1)
- Provides non-linear sensitivity (high near zero, low at extremes)
- Naturally filters outliers without lag penalty
Calculation Process:
1. Statistical Normalization: Price deviations are measured from a moving average baseline and scaled by recent volatility (standard deviation over N periods)
2. Sigmoid Transformation: Normalized values undergo S-curve transformation, which weights small movements linearly but compresses large movements logarithmically
3. Dual Timeframe Analysis:
• Short window: User-defined period (N)
• Long window: Double period (2N)
• Ratio calculation: Short sigmoid average ÷ Long sigmoid average
4. Volatility-Weighted Smoothing: Final values use exponential smoothing where the smoothing factor adjusts based on the coefficient of variation (volatility/mean ratio)
What Makes This Different:
Unlike linear momentum oscillators (RSI, Stochastic) that use fixed mathematical relationships, the sigmoid transformation creates variable sensitivity zones. This mimics how professional traders mentally weight price movements.
Trading Application:
Signal Types:
- Momentum: Green (>1.0) = bullish, Red (<1.0) = bearish
- Reversals: 1.0 line crosses with volume confirmation
- Divergence: Price makes new high/low, oscillator doesn't
- Exhaustion: Extended readings (>1.2 or <0.8) suggest overextension
Optimal Conditions:
- Works best: Trending markets with clear swings
- Avoid: Low volume, ranging markets under 1% daily movement
- Timeframes: 4H and above for reliability
Parameter Guidelines:
- Length 8-10: Day trading (expect more whipsaws)
- Length 14-20: Swing trading (balanced signals)
- Length 25-30: Position trading (fewer, stronger signals)
Limitations:
- Lag increases with higher length settings
- Can give false signals during news-driven spikes
- Requires additional confirmation in choppy markets
Trading Framework:
Based on momentum persistence theory - assumes trends continue until sigmoid curve flattens (indicating momentum exhaustion). The mathematical model captures both mean reversion (extreme readings) and trend following (mid-range readings) characteristics.
VWAP For Loop [BackQuant]VWAP For Loop
What this tool does—in one sentence
A volume-weighted trend gauge that anchors VWAP to a calendar period (day/week/month/quarter/year) and then scores the persistence of that VWAP trend with a simple for-loop “breadth” count; the result is a clean, threshold-driven oscillator plus an optional VWAP overlay and alerts.
Plain-English overview
Instead of judging raw price alone, this indicator focuses on anchored VWAP —the market’s average price paid during your chosen institutional period. It then asks a simple question across a configurable set of lookback steps: “Is the current anchored VWAP higher than it was i bars ago—or lower?” Each “yes” adds +1, each “no” adds −1. Summing those answers creates a score that reflects how consistently the volume-weighted trend has been rising or falling. Extreme positive scores imply persistent, broad strength; deeply negative scores imply persistent weakness. Crossing predefined thresholds produces objective long/short events and color-coded context.
Under the hood
• Anchoring — VWAP using hlc3 × volume resets exactly when the selected period rolls:
Day → session change, Week → new week, Month → new month, Quarter/Year → calendar quarter/year.
• For-loop scoring — For lag steps i = , compare today’s VWAP to VWAP .
– If VWAP > VWAP , add +1.
– Else, add −1.
The final score ∈ , where N = (end − start + 1). With defaults (1→45), N = 45.
• Signal logic (stateful)
– Long when score > upper (e.g., > 40 with N = 45 → VWAP higher than ~89% of checked lags).
– Short on crossunder of lower (e.g., dropping below −10).
– A compact state variable ( out ) holds the current regime: +1 (long), −1 (short), otherwise unchanged. This “stickiness” avoids constant flipping between bars without sufficient evidence.
Why VWAP + a breadth score?
• VWAP aggregates both price and volume—where participants actually traded.
• The breadth-style count rewards consistency of the anchored trend, not one-off spikes.
• Thresholds give you binary structure when you need it (alerts, automation), without complex math.
What you’ll see on the chart
• Sub-pane oscillator — The for-loop score line, colored by regime (long/short/neutral).
• Main-pane VWAP (optional) — Even though the indicator runs off-chart, the anchored VWAP can be overlaid on price (toggle visibility and whether it inherits trend colors).
• Threshold guides — Horizontal lines for the long/short bands (toggle).
• Cosmetics — Optional candle painting and background shading by regime; adjustable line width and colors.
Input map (quick reference)
• VWAP Anchor Period — Day, Week, Month, Quarter, Year.
• Calculation Start/End — The for-loop lag window . With 1→45, you evaluate 45 comparisons.
• Long/Short Thresholds — Default upper=40, lower=−10 (asymmetric by design; see below).
• UI/Style — Show thresholds, paint candles, background color, line width, VWAP visibility and coloring, custom long/short colors.
Interpreting the score
• Near +N — Current anchored VWAP is above most historical VWAP checkpoints in the window → entrenched strength.
• Near −N — Current anchored VWAP is below most checkpoints → entrenched weakness.
• Between — Mixed, choppy, or transitioning regimes; use thresholds to avoid reacting to noise.
Why the asymmetric default thresholds?
• Long = score > upper (40) — Demands unusually broad upside persistence before declaring “long regime.”
• Short = crossunder lower (−10) — Triggers only on downward momentum events (a fresh breach), not merely being below −10. This combination tends to:
– Capture sustained uptrends only when they’re very strong.
– Flag downside turns as they occur, rather than waiting for an extreme negative breadth.
Tuning guide
Choose an anchor that matches your horizon
– Intraday scalps : Day anchor on intraday charts.
– Swing/position : Month or Quarter anchor on 1h/4h/D charts to capture institutional cycles.
Pick the for-loop window
– Larger N (bigger end) = stronger evidence requirement, smoother oscillator.
– Smaller N = faster, more reactive score.
Set achievable thresholds
– Ensure upper ≤ N and lower ≥ −N ; if N=30, an upper of 40 can never trigger.
– Symmetric setups (e.g., +20/−20) are fine if you want balanced behavior.
Match visuals to intent
– Enabling VWAP coloring lets you see regime directly on price.
– Background shading is useful for discretionary reading; turn it off for cleaner automation displays.
Playbook examples
• Trend confirmation with disciplined entries — On Month anchor, N=45, upper=38–42: when the long regime engages, use pullbacks toward anchored VWAP on the main pane for entries, with stops just beyond VWAP or a recent swing.
• Downside transition detection — Keep lower around −8…−12 and watch for crossunders; combine with price losing anchored VWAP to validate risk-off.
• Intraday bias filter — Day anchor on a 5–15m chart, N=20–30, upper ~ 16–20, lower ~ −6…−10. Only take longs while score is positive and above a midline you define (e.g., 0), and shorts only after a genuine crossunder.
Behavior around resets (important)
Anchored VWAP is hard-reset each period. Immediately after a reset, the series can be young and comparisons to pre-reset values may span two periods. If you prefer within-period evaluation only, choose end small enough not to bridge typical period length on your timeframe, or accept that the breadth test intentionally spans regimes.
Alerts included
• VWAP FL Long — Fires when the long condition is true (score > upper and not in short).
• VWAP FL Short — Fires on crossunder of the lower threshold (event-driven).
Messages include {{ticker}} and {{interval}} placeholders for routing.
Strengths
• Simple, transparent math — Easy to reason about and validate.
• Volume-aware by construction — Decisions reference VWAP, not just price.
• Robust to single-bar noise — Needs many lags to agree before flipping state (by design, via thresholds and the stateful output).
Limitations & cautions
• Threshold feasibility — If N < upper or |lower| > N, signals will never trigger; always cross-check N.
• Path dependence — The state variable persists until a new event; if you want frequent re-evaluation, lower thresholds or reduce N.
• Regime changes — Calendar resets can produce early ambiguity; expect a few bars for the breadth to mature.
• VWAP sensitivity to volume spikes — Large prints can tilt VWAP abruptly; that behavior is intentional in VWAP-based logic.
Suggested starting profiles
• Intraday trend bias : Anchor=Day, N=25 (1→25), upper=18–20, lower=−8, paint candles ON.
• Swing bias : Anchor=Month, N=45 (1→45), upper=38–42, lower=−10, VWAP coloring ON, background OFF.
• Balanced reactivity : Anchor=Week, N=30 (1→30), upper=20–22, lower=−10…−12, symmetric if desired.
Implementation notes
• The indicator runs in a separate pane (oscillator), but VWAP itself is drawn on price using forced overlay so you can see interactions (touches, reclaim/loss).
• HLC3 is used for VWAP price; that’s a common choice to dampen wick noise while still reflecting intrabar range.
• For-loop cap is kept modest (≤50) for performance and clarity.
How to use this responsibly
Treat the oscillator as a bias and persistence meter . Combine it with your entry framework (structure breaks, liquidity zones, higher-timeframe context) and risk controls. The design emphasizes clarity over complexity—its edge is in how strictly it demands agreement before declaring a regime, not in predicting specific turns.
Summary
VWAP For Loop distills the question “How broadly is the anchored, volume-weighted trend advancing or retreating?” into a single, thresholded score you can read at a glance, alert on, and color through your chart. With careful anchoring and thresholds sized to your window length, it becomes a pragmatic bias filter for both systematic and discretionary workflows.

Scalp Sense AI# Scalp Sense AI (No Repaint)
**Adaptive trend & reversal detector with an AI-driven score, multi-timeframe confirmations, robust volume filters, and a purpose-built Scalping Mode.**
Signals are generated **only on bar close** (no repaint), include structured alert payloads for webhooks, and come with optional ATR-based TP/SL visualization for study and validation.
---
## What it is (in one paragraph)
**Scalp Sense AI** combines classic market structure (DI/ADX, EMA, SMA, Keltner, ATR) with a continuous **AI Score** that fuses RSI normalization, EMA distance (in ATR units), and DI edge into a single, volatility-aware signal. It adaptively gates **trend** and **reversal** entries, applies **HTF confirmation** without lookahead, and enforces **guard rails** (e.g., strong-trend reversal blocking) unless a high-confidence AI override and volume confirmation are present. **Scalping Mode** compresses reaction times and adds micro price-action cues (wick rejections, micro-EMA crosses, small engulfing) to surface more—but disciplined—opportunities.
---
## Non-Repainting Design
* All signals, markers, state, and alerts are computed **after bar close** using `barstate.isconfirmed`.
* HTF data are requested with `lookahead_off`.
* No “future-peeking” constructs are used.
* Result: signals do **not** change after the candle closes.
---
## How the engine works (pipeline overview)
1. **Base metrics**
* **RSI**, **EMA**, **ATR** (+ ATR SMA for regime/volatility), **SMA long & short**, **Keltner** (EMA ± ATR×mult).
* **Manual DI/ADX** for fine control (DM+, DM−, true range smoothing).
2. **Volatility regime**
* Compares ATR to its SMA and scales thresholds by √(ATR/ATR\_SMA) → robust “high\_vol” gating.
3. **Volume & flow**
* **Volume Z-score**, **OBV slope**, and **MFI** (all computed manually) to confirm impulses and filter weak reversals.
4. **Higher-Timeframe confirmation (optional)**
* Imports HTF **PDI/MDI/ADX** and **SMA** (no lookahead) to require alignment when enabled.
5. **AI Score**
* Weighted fusion of **RSI (normalized around 0)**, **EMA distance (in ATR)**, and **DI edge**.
* Smoothed; then its **mean (μ)** and **volatility (σ)** are estimated to form **adaptive bands** (hi/lo), with optional **hysteresis**.
* **Debounce** (M in N bars) avoids flicker; **bias state** persists until truly invalidated.
6. **Signal logic**
* **Trend entries** require AI bias + trend confirmations (DI/ADX/SMA, HTF if enabled), volatility OK, and **anti-breakout** filter.
* **Reversal entries** come in **core**, **early**, and **scalp** flavors (progressively more frequent), guarded by strong-trend blocks that an **AI+volume+ADX-cooling override** can bypass.
7. **Scalping Mode**
* Adaptive parameter contraction (shorter lengths), gentler guards, micro-patterns (wick/engulf/micro-EMA cross), and reduced cooldown to increase high-quality opportunities.
8. **Cooldown & state**
* One signal per side after a configurable spacing in bars; internal “last direction” avoids clustering.
9. **Visualization & alerts**
* **Triangles** for trend, **circles** for reversals (offset by ATR to avoid overlap).
* **Single-line alert payload** (BUY/SELL, reason, AI, volZ, ADX) ready for webhooks.
---
## Signals & visualization
* **Trend Long/Short** → triangle markers (above/below) when:
* AI bias aligns with trend confirmations (DI edge, ADX above threshold, price vs long SMA, optional HTF alignment).
* Volatility regime agrees; **anti-breakout** prevents entries exactly at lookback highs/lows.
* **Reversal Long/Short** → circular markers when:
* **Core**: AI near “loose” band, OBV/MFI/volZ supportive, ADX cooling, DI spread relaxed, PA confirms (crosses/div).
* **Early**: anticipatory patterns (Keltner exhaustion, simple RSI “quasi-divergence”).
* **Scalp**: micro-EMA cross, wick rejection, mini-engulfing, with relaxed guards but AI/volume still in the loop.
* **Markers appear only on the bar that actually emitted the signal** (no repaint); offsets use ATR so shapes don’t overlap.
---
## Alerts (ready for webhooks)
Enable “**Any alert() function call**” and you’ll receive compact, single-line payloads once per bar:
```
action=BUY;reason=reversal-early;ai=0.1375;volZ=0.82;adx=27.5
action=SELL;reason=trend;ai=-0.2210;volZ=0.43;adx=31.9
```
* `action`: BUY / SELL
* `reason`: `trend` | `reversal-core` | `reversal-early` | `reversal-scalp`
* `ai`: current smoothed AI Score at signal bar
* `volZ`: volume Z-score
* `adx`: current ADX
---
## Inputs (exhaustive)
### 1) Core Inputs
* **RSI Length (Base)** (`rsi_length_base`, int)
Base RSI lookback. Shorter = more reactive; longer = smoother.
* **RSI Overbought Threshold** (`rsi_overbought`, int)
Informational for context; RSI is used normalized in the AI fusion.
* **RSI Oversold Threshold** (`rsi_oversold`, int)
Informational; complements visual context.
* **EMA Length (Base)** (`ema_length_base`, int)
Primary adaptive mean; also used for Keltner mid and distance metric.
* **ATR Length (Base)** (`atr_length_base`, int)
Volatility unit for Keltner, SL/TP (debug), and regime detection.
* **ATR SMA Length** (`atr_sma_len`, int)
Smooth baseline for ATR regime; supports “high\_vol” logic.
* **ATR Multiplier Base** (`atr_mult_base`, float)
Scales volatility gating (sqrt-scaled); higher = tighter high-vol requirement.
* **Disable Volatility Filter** (`disable_volatility_check`, bool)
Bypass volatility gating if true.
* **Price Change Period (bars)** (`price_change_period_base`, int)
Simple momentum check (+/−% over N bars) used in trend validation.
* **Base Cooldown Bars Between Signals** (`signal_cooldown_base`, int ≥ 0)
Minimum bars to wait between signals (per side).
* **Trend Confirmation Bars** (`trend_confirm_bars`, int ≥ 1)
Require persistence above/below long SMA for this many bars.
* **Use Higher Timeframe Confirmation** (`use_higher_tf`, bool)
Turn on/off HTF alignment (no repaint).
* **Higher Timeframe for Confirmation** (`higher_tf`, timeframe)
E.g., “60” to confirm M15 with H1; used for HTF PDI/MDI/ADX and SMA.
* **TP as ATR Multiple** (`tp_atr_mult`, float)
For **visual debug** only (drawn after entries); not an order manager.
* **SL as ATR Multiple** (`sl_atr_mult`, float)
For visual debug only.
* **Enable Scalping Mode** (`scalping_mode`, bool)
Compresses lengths/thresholds, unlocks micro-PA modules, reduces cooldown.
* **Show Debug Lines** (`show_debug`, bool)
Plots AI bands, DI/ADX, EMA/SMA, Keltner, vol metrics, and TP/SL (debug).
### 2) AI Score & Thresholds
* **AI Score Smooth Len** (`ai_len`, int)
EMA smoothing over the raw fusion.
* **AI Volatility Window** (`ai_sigma_len`, int)
Window to estimate AI mean (μ) and standard deviation (σ).
* **K High (sigma)** (`ai_k_hi`, float)
Upper band width (σ multiplier) for strong threshold.
* **K Low (sigma)** (`ai_k_lo`, float)
Lower band width (σ multiplier) for loose threshold.
* **Debounce Window (bars)** (`ai_debounce_m`, int ≥ 1)
Rolling window length used by the confirm counter.
* **Min Bars>Thr in Window** (`ai_debounce_n`, int ≥ 1)
Minimum confirmations inside the debounce window to validate a state.
* **Use Hysteresis Thresholds** (`ai_hysteresis`, bool)
Requires crossing back past a looser band to exit bias → fewer whipsaws.
* **Weight DI Edge (0–1)** (`ai_weight_di`, float)
Importance of DI edge within the fusion.
* **Weight EMA Dist (0–1)** (`ai_weight_ema`, float)
Importance of EMA distance (in ATR units).
* **Weight RSI Norm (0–1)** (`ai_weight_rsi`, float)
Importance of normalized RSI.
* **Sensitivity (0–1)** (`sensitivity`, float)
Contracts/expands bands (higher = more sensitive).
### 3) Volume Filters
* **Volume MA Length** (`vol_ma_len`, int)
Baseline for volume Z-score.
* **Volume Z-Score Window** (`vol_z_len`, int)
Std-dev window for Z-score; larger = fewer volume “spikes”.
* **Reversal: Min Volume Z for confirm** (`vol_rev_min_z`, float)
Minimum Z required to validate reversals (adaptively relaxed in scalping).
* **OBV Slope Lookback** (`obv_slope_len`, int)
Rising/falling OBV over this window supports bull/bear confirmations.
* **MFI Length** (`mfi_len`, int)
Money Flow Index lookback (manual calculation).
### 4) Filters (Breakout / ADX / Reversal)
* **Enable Breakout Filter** (`enable_breakout_fil`, bool)
Avoid trend entries at lookback highs/lows.
* **Breakout Lookback Bars** (`breakout_lookback`, int ≥ 1)
Window for the anti-breakout guard.
* **Base ADX Length** (`adx_length_base`, int)
Lookback for DI/ADX smoothing (also adapted in Scalping Mode).
* **Base ADX Threshold** (`adx_threshold_base`, float)
Minimum ADX to validate trend context (scaled in Scalping Mode).
* **Enable Reversal Filter** (`enable_rev_filter`, bool)
Master switch for reversal logic.
* **Max ADX for Reversal** (`rev_adx_max`, float)
Hard cap: above this ADX, reversals are blocked (unless overridden by AI if allowed in Guards).
### 5) Reversal Guard (regime protection & overrides)
* **Strong Trend: ADX add-above Thr** (`guard_adx_add`, float)
Extra ADX above `adx_threshold` to mark “strong” trend.
* **Strong Trend: min DI spread** (`guard_spread_min`, float)
Minimum DI separation to consider a trend “dominant”.
* **Require ADX drop from window max (%)** (`guard_adx_drop_min_pct`, float 0–1)
ADX must drop at least this fraction from its window maximum to consider “cooling”.
* **Regime Window (bars)** (`guard_regime_len`, int ≥ 10)
Window over which ADX max is measured for the “cooling” check.
* **EMA Slope Lookback** (`guard_slope_len`, int ≥ 2)
EMA slope horizon used alongside Keltner for strong-trend identification.
* **Keltner Mult (ATR)** (`guard_kc_mult`, float)
Keltner width for strong trend bands and exhaustion checks.
* **HTF Reversal Block Mode** (`htf_block_mode`, string: `Off` | `On` | `AI-controlled`)
* `Off`: never block by HTF.
* `On`: block reversals whenever HTF is strong.
* `AI-controlled`: block **unless** AI+volume+ADX-cooling override criteria are met.
* **AI-controlled: allow AI override** (`ai_htf_override`, bool)
Enables the override mechanism in `AI-controlled` mode.
* **AI override multiplier (vs band\_hi)** (`ai_override_mult`, float)
Strength needed beyond the high band to count as “strong AI”.
* **AI override: min bars beyond strong thr** (`ai_override_min_bars`, int ≥ 1)
Debounce on the override itself.
### 6) Markers
* **Reversal Circle ATR Offset** (`rev_marker_offset_atr`, float ≥ 0)
Vertical offset for reversal circles; trend triangles use a separate (internal) offset.
### 7) Scalping Mode Tuning
* **Reversal aggressiveness (0–1)** (`scalp_rev_aggr`, float)
Higher = looser guards and stronger AI sensitivity.
* **Wick: body multiple (bull/bear)** (`scalp_wick_body_mult`, float)
Wick must be at least this multiple of body to count as rejection.
* **Wick: ATR multiple (min)** (`scalp_wick_atr_mult`, float)
Minimal wick length in ATR units.
* **Micro EMA factor (vs EMA base)** (`scalp_ema_fast_factor`, float 0.2–0.9)
Fast EMA length = base EMA × factor (rounded/int).
* **Relax breakout filter in scalping** (`scalp_breakout_relax`, bool)
Lets more trend entries through in scalping context.
### 8) ICT-style SMA (bases)
* **ICT SMA Long Length (Base)** (`sma_long_len_base`, int)
Long-term baseline for regime/trend.
* **ICT SMA Short1 Length (Base)** (`sma_short1_len_base`, int)
Short baseline for price-action crosses.
* **ICT SMA Short2 Length (Base)** (`sma_short2_len_base`, int)
Companion short baseline used in PA cross checks.
> **Adaptive “effective” values:** When **Scalping Mode** is ON, the script internally shortens multiple lengths (RSI/EMA/ATR/ADX/μσ windows, SMAs) and gently relaxes guards (ADX drop %, DI spread, volume Z, override thresholds), reduces cooldown/confirm bars, and optionally relaxes the breakout filter—so you get **more frequent but still curated** signals.
---
## Plots & debug (optional)
* DI+/DI−, ADX (curr + HTF), EMA, long SMA, Keltner up/down (when strong), AI Score, AI mean, AI bands (hi/lo; low plots only when hysteresis is on), Volume MA and Z-score, and ATR-based TP/SL guide (after entries).
* These are **study aids**; the indicator does not manage trades.
---
## Recommended use
* **Timeframes**:
* Scalping Mode: M1–M15.
* Standard Mode: M15–H1 (or higher).
* **Markets**: Designed for liquid FX, indices, metals, and large-cap crypto.
* **Chart type**: Standard candles recommended (Heikin-Ashi alters inputs and hence signals).
* **Alerts**: Use “Any alert() function call”. Parse the key/value payloads server-side.
---
## Good to know
* **Why some alerts don’t draw shapes retroactively**: markers are drawn **only on** the bar that emitted the signal (no repaint by design).
* **Why a reversal didn’t fire**: strong-trend guards + HTF block may have been active; check ADX, DI spread, Keltner position, EMA slope, and whether AI override criteria were met.
* **Too many / too few signals**: tune **Scalping Mode**, `signal_cooldown_base`, AI bands (`ai_k_hi/lo`, `sensitivity`), volume Z (`vol_rev_min_z`), and guards (`rev_adx_max`, `guard_*`).
---
## Disclaimer
This is an **indicator**, not a strategy or an execution system. It does not place, modify, or manage orders. Markets carry risk—validate on historical data and demo before any live decisions. No performance claims are made.
---
### Version
**Scalp Sense AI v11.5** — Adaptive AI bands with hysteresis/debounce, HTF no-lookahead confirmations, guarded reversal logic with AI override, full volume suite (Z, OBV slope, MFI), anti-breakout filter, and a dedicated Scalping Mode with micro-PA cues.
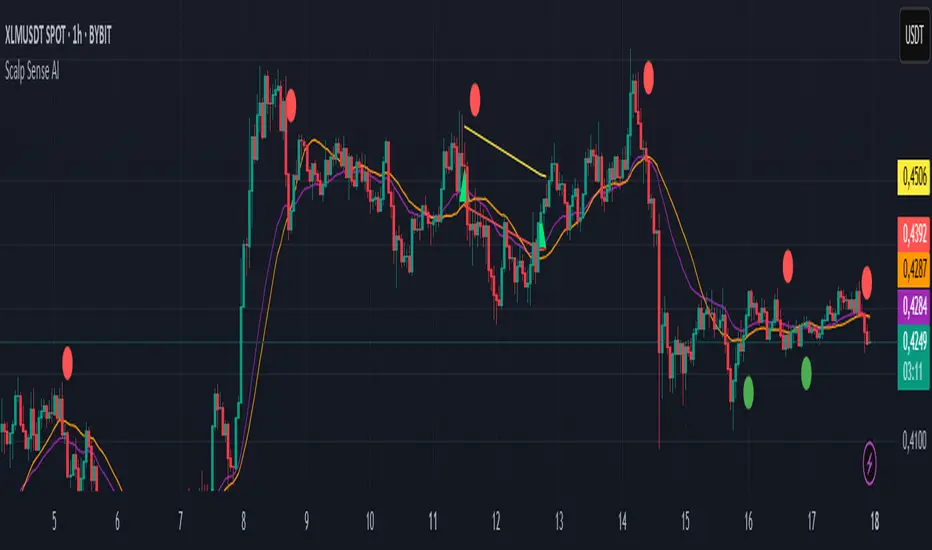
Forecasting Quadratic Regression [UPDATED V6] Forecasting Quadratic Regression applies a second-degree polynomial regression model to price data, offering a non-linear alternative to traditional linear regression. By fitting a quadratic curve of the form:
y=a+bx+cx2
the indicator captures both directional trend and curvature, allowing traders to detect momentum shifts earlier than with straight-line models.
🔹 Core Features
Fits a quadratic regression curve to user-defined lookback periods
Extends the fitted curve forward to generate forecast projections
Calculates slope curvature to highlight trend acceleration or deceleration
Adapts dynamically as new bars are added
🔹 Trading Applications
Identify potential reversal zones when the curve inflects (2nd derivative sign change)
Forecast near-term mean reversion targets or extended trend continuations
Filter trades by measuring momentum curvature rather than linear slope
Visualize higher-order structure in price beyond standard regression lines
⚠️ Note: This model is statistical and assumes past curvature informs short-term future price paths. It should be combined with confirmation signals (volume, oscillators, support/resistance) to reduce false inflection points.

Ultron Indicator BTCUSDT Ultron BTCUSDT Indicator (invite-only).
• Clear trend & reversion signals
• Next-bar execution parity and frozen TSL visuals
• Run on 4hr Binance BTCUSDT chart
• Risk sizing that uses your equity input
Usage: Add to chart → Settings → Inputs → set “Your Current Trading Equity (USD)”.
⚠️ Software tool for educational/informational use only. Not financial advice.
Past performance is not indicative of future results. You are responsible for your trades.

The Oracle by JaeheeThe Oracle
Summary
The Oracle is a volatility-adaptive trend indicator built on a smoothed range filter, persistence counters, and regime-flip logic. Signals appear only when price establishes a sustained move and flips from one regime to the other. An EMA(50)-anchored ribbon provides a flowing visual context but does not drive signals.
What it does
① Calculates a smoothed volatility-based range to adapt to market conditions
② Builds a filtered price path that reduces single-bar noise
③ Tracks persistence of upward or downward filter movement with counters
④ Confirms Buy/Sell signals only on regime flips, not on single ticks
⑤ Draws a multi-phase ribbon around EMA(50) to visualize slope and bias
How it works (concept level)
① Smoothed Range: Double EMA of absolute price change, scaled by multiplier
② Filtered Price: Range filter constrains price movement to reduce noise
③ Persistence Counters: Upward/Downward counters accumulate only if the filter continues in one direction
④ Signal Logic:
• Buy = price above filter AND prior regime was short
• Sell = price below filter AND prior regime was long
• Requires a full flip of state to confirm new signals
⑤ Ribbon: EMA(50) baseline with sinusoidal offsets creates a flowing ribbon, colored by EMA slope (visual only)
Why it is useful
① Noise resistance: Avoids whipsaws by requiring persistence + state flips
② Clarity: Ribbon visually encodes background trend for quick recognition
③ Balanced design: Combines volatility adaptation, persistence, and confirmation in one framework
④ Adaptable: Works across assets and timeframes without heavy parameter tuning
How to use it
① Signal reading:
• ✧ Buy marker = confirmed transition into an upward regime
• ✧ Sell marker = confirmed transition into a downward regime
• Use bar close confirmation
② Ribbon context: Align trades with ribbon slope/color to stay with the dominant trend
③ Timeframes:
• Higher (4H, Daily) = better swing bias
• Lower (5m, 15m) = faster signals but noisier
④ Combination: Pair with ATR stops, position sizing, or volume/momentum studies for added confirmation
Limitations
① Still possible to see false flips in choppy consolidations
② Smoothing introduces slight delay in regime confirmation
③ Signals can repaint intrabar — confirm on bar close
④ Indicator only — no built-in money management or strategy logic
Best Practices (Recommended Use)
① Confirm on bar close
• Signals can change intrabar; always make decisions after the bar has closed.
② Validate across multiple timeframes
• Although the tool adapts to volatility, reliability improves on higher timeframes.
• In practice, the 1-hour chart has shown the most stable balance between reactivity and noise.
③ Align with ribbon bias
• Trade in the same direction as the ribbon slope/color to reduce countertrend exposure.
④ Combine with independent risk management
• Use stop-losses, position sizing, or ATR-based targets outside the script.
• The indicator highlights transitions, but risk control must be user-defined.
⑤ Use as confirmation, not prediction
• Treat signals as confirmation of regime change, not as a forecast of future price.
Up On Volume Screener [LevelUp]The Up On Volume Screener is a powerful scanner designed to identify stocks exhibiting strong bullish momentum, characterized by a higher close on the day or week accompanied by a significant spike in trading volume compared to the average. This screener allows traders to customize parameters such as moving average lengths, closing range requirements, and proximity to 52-week highs using multiples of the ATR (average true range).
By pinpointing stocks with robust buying pressure and high volume, the Up On Volume screener helps traders uncover potential breakout opportunities, early trend leaders, and stocks demonstrating relative strength, making it an essential tool for momentum, swing, and growth trading strategies.
🔹 Why Search For Up On Volume?
▪ Confirmation of Bullish Momentum: Stocks that close higher on the day/week signal buying pressure and bullish sentiment throughout the session. This helps traders and investors identify names that are attracting demand, possibly due to news, earnings, or sector strength.
▪ Volume Adds Conviction: When a stock closes up with increased volume, it suggests strong participation behind the move — not just a “head fake” or a thinly traded rally. High volume confirms that institutional players or multiple market participants are involved, which often leads to more reliable price trends.
▪ Early Stage Moves: Daily breakouts can often mark the beginning of a larger trend. Catching stocks on days they close up helps pinpoint emerging leaders and stocks transitioning from accumulation to bullish phases.
▪ Technical Strength: A bullish close (especially in the top half of the day’s price range) is a technical sign of demand. This is a favored criterion in many technical analysis strategies for swing trading, momentum trading, and even fundamental breakouts.
🔹 When Is Up On Volume Screen Most Helpful?
▪ After Market Close: Stocks that show strength and close up on high volume often show continued follow-through in the coming days/weeks.
▪ After Major News/Events: When stocks respond positively to news releases, earnings, or sector movements, searching for those that close up can help you catch momentum before it’s widely recognized.
▪ Trend Days: On days when the market is trending (not sideways or choppy), screening for stocks closing up helps you align with the strongest moves and avoid false signals.
▪ Early in Bullish Cycles: Searching for stocks closing up during the early stage of a market rally or sector rotation can help growth traders get in ahead of sustained upward moves.a
▪ Relative Strength Signals True Leadership: When most stocks decline in a weak market, those that hold firm or rise are showing clear relative strength. This means buyers are stepping in even when the broader mood is negative, often signaling institutional accumulation — these are the names likely to become tomorrow’s winners.
▪ Early Clues to New Cycles: Throughout history, the biggest winners in bull markets often began their runs during corrections and bear phases, not after the headlines turn positive. By focusing on stocks that close green on red days, you’re hunting for companies quietly building buying pressure, poised to break out when the tide turns.
▪ Faster Recoveries and Outperformance: Stocks that resist declines tend to rebound earlier and outpace the broader market once conditions improve. These resilient names frequently end up delivering outsized returns, often leading sector rallies or driving new market themes.
🔹 Screening Features - Setting Your Search Criteria
There are various search options that can be customized.
✓ Volume Gap Up %: Minimum volume percent change over the average volume.
✓ Moving Average: Set length for average volume calculations on daily and weekly timeframes.
✓ Closing Range %: Specify the preferred closing range on the day or week.
✓ Price With X ATR of 52-Week High: Filter for stocks within X ATRs of their 52-week highs.
🔹 Installation And Usage
▪ Mark this indicator as a Favorite.
▪ Use the Pine Screener to search for stocks.
▪ Save the search results to a watchlist.
▪ View the watchlist in TradingView.
🔹 Note
Some high-volume breakout scans rely on proprietary formulas. With this screener, every filter can be researched and verified - no black box! The only variables are price, volume % change, closing range and price within a specified ATR of the 52-week high.

ML Compressor Enhanced Trading Indicator# 🤖 ML Enhanced Trading Indicator - Advanced Market Analysis
## 📊 Overview
This is a comprehensive Machine Learning Enhanced Trading Indicator that combines multiple advanced analytical techniques to provide high-probability trading signals. The indicator uses artificial intelligence, pattern recognition, anomaly detection, and traditional technical analysis to identify optimal entry and exit points in the market.
## 🚀 Key Features
### 🧠 **Machine Learning Core**
- **Advanced Pattern Recognition**: Uses cosine similarity, Pearson correlation, and Spearman rank correlation to identify historical patterns
- **AI-Powered Predictions**: Implements multiple correlation methods to forecast price movements
- **Anomaly Detection**: Z-score based detection system for unusual market activities
- **Signal Confidence Scoring**: Reliability assessment for each trading signal
### 📈 **Technical Analysis Integration**
- **Multi-Timeframe RSI Analysis**: 14 and 21-period RSI with oversold/overbought detection
- **MACD Momentum**: Enhanced MACD histogram analysis for trend confirmation
- **Bollinger Bands Position**: Dynamic position tracking within BB channels
- **Volume Analysis**: Spike and dry volume detection with ratio calculations
- **Trend Strength Measurement**: EMA-based trend power analysis
### 🎯 **Perfect Zone Detection**
- **Ideal Buy Zone**: Identifies perfect buying opportunities when 7 conditions align:
- ML Score ≥ 0.60
- Bottom proximity detection
- RSI in 20-35 range
- Volume spike confirmation
- Positive price anomaly
- Bullish pattern match
- Positive MACD momentum
### 📊 **Comprehensive Display Table**
- **Real-time ML Analysis**: Complete breakdown of all indicators
- **Perfect Buy Conditions Tracker**: Visual checklist with completion percentage
- **Performance Metrics**: Win rate tracking and P&L analysis
- **Signal Strength Indicators**: Confidence levels for each signal
## 🔧 **Customizable Parameters**
### **ML Settings**
- **ML Lookback Period**: 20-500 bars (default: 100)
- **Anomaly Threshold**: 1.0-5.0 sensitivity (default: 2.0)
- **Pattern Similarity**: 0.5-0.99 matching threshold (default: 0.80)
- **AI Lookback Period**: 20-200 bars (default: 50)
### **AI Prediction Models**
- **Correlation Methods**: Spearman, Pearson, Cosine Similarity
- **Forecast Length**: 15-250 bars (default: 50)
- **Similarity Type**: Price or %Change analysis
### **Visual Options**
- **Table Position**: Top/Bottom Left/Right positioning
- **Table Size**: Small, Normal, Large options
- **Signal Display**: Toggle buy/sell signals on/off
- **AI Visualization**: Optional prediction paths and ZigZag
## 📋 **How to Use**
### **For Beginners**
1. Add the indicator to your chart
2. Look for "PERFECT BUY" signals in the table
3. Wait for completion percentage ≥ 85% for highest probability trades
4. Use the background color changes as visual confirmation
### **For Advanced Traders**
1. Analyze individual ML components in the detailed table
2. Monitor anomaly detection for unusual market conditions
3. Use pattern confidence levels for trade timing
4. Combine with your existing strategy for confirmation
### **Signal Interpretation**
- **🟢 PERFECT BUY**: All 7 conditions met - highest probability reversal
- **🟡 NEAR BOTTOM**: Close to ideal conditions - monitor closely
- **🔴 NOT READY**: Wait for better setup
- **Strong Buy/Sell Signals**: ML score-based entries with high confidence
## ⚠️ **Important Notes**
### **Risk Management**
- This indicator provides analysis and signals, not guaranteed outcomes
- Always use proper risk management and position sizing
- Consider market conditions and fundamental factors
- Backtest the strategy on your preferred timeframes and assets
### **Best Practices**
- Use multiple timeframe analysis for confirmation
- Combine with support/resistance levels
- Monitor volume confirmation for all signals
- Set appropriate stop-losses and profit targets
### **Performance Tracking**
- The indicator tracks its own performance with win rate calculations
- Monitor the "AI Prediction" accuracy percentage
- Use the P&L tracking to assess signal quality over time
## 🔄 **Updates and Improvements**
This indicator is continuously evolving with:
- Enhanced machine learning algorithms
- Improved pattern recognition capabilities
- Additional correlation methods for better accuracy
- Performance optimization for faster calculations
- New visualization features based on user feedback
## 📚 **Technical Details**
### **Machine Learning Implementation**
- **Pattern Matching**: 20-bar normalized price patterns with historical comparison
- **Correlation Analysis**: Mathematical similarity scoring between current and historical patterns
- **Anomaly Detection**: Statistical Z-score analysis across price, volume, and RSI
- **Signal Weighting**: Multi-factor scoring system with optimized weights
### **Algorithm Components**
1. **Feature Extraction**: Price, volume, momentum, volatility, and trend features
2. **Pattern Recognition**: Historical pattern database with similarity matching
3. **Anomaly Detection**: Multi-dimensional Z-score threshold analysis
4. **Signal Generation**: Weighted scoring system with confidence intervals
5. **Performance Tracking**: Real-time win rate and accuracy monitoring
### **Calculation Methods**
- **Trend Strength**: (EMA8 - EMA21) / EMA21 * 100
- **Volume Ratio**: Current Volume / 20-period SMA Volume
- **BB Position**: (Close - BB_Lower) / (BB_Upper - BB_Lower)
- **Anomaly Score**: Average of normalized Z-scores for price, volume, and RSI
## 🎨 **Visual Elements**
### **Background Colors**
- **Light Green**: Perfect buy zone detected
- **Light Red**: Perfect sell zone detected
- **Light Blue**: Near bottom proximity
- **Green/Red Transparency**: Price anomaly detection
### **Signal Shapes**
- **Green Triangle Up**: Strong buy signal
- **Red Triangle Down**: Strong sell signal
- **Aqua Diamond**: Perfect buy zone entry
- **Purple Diamond**: Perfect sell zone entry
### **Table Information**
- **ML Complete Analysis**: 16 comprehensive metrics
- **Perfect Buy Conditions**: 7-point checklist with status indicators
- **Real-time Values**: Live updating of all calculations
- **Color-coded Status**: Green (good), Yellow (moderate), Red (caution)
## 🔍 **Troubleshooting**
### **Common Issues**
- **Table Not Showing**: Enable "Show ML Table" in settings
- **No Signals Appearing**: Check "Show Buy/Sell Signals" option
- **Performance Issues**: Reduce ML Lookback Period for faster calculation
- **Too Many/Few Signals**: Adjust Anomaly Threshold sensitivity
### **Optimization Tips**
- **For Day Trading**: Use lower timeframes (1m, 5m, 15m) with reduced lookback periods
- **For Swing Trading**: Use higher timeframes (1h, 4h, 1D) with standard settings
- **For Scalping**: Enable only strong signals and reduce pattern similarity threshold
- **For Long-term**: Increase all lookback periods and use daily/weekly timeframes
## 📖 **Disclaimer**
This indicator is for educational and informational purposes only. It should not be considered as financial advice. Trading involves substantial risk of loss and is not suitable for all investors. Past performance does not guarantee future results.
### **Risk Warning**
- All trading involves risk of substantial losses
- Never risk more than you can afford to lose
- This indicator does not guarantee profitable trades
- Always use proper risk management techniques
- Consider consulting with a financial advisor
### **Liability**
The creator of this indicator is not responsible for any losses incurred from its use. Users should thoroughly test and understand the indicator before using it with real money.
### **Feature Requests**
- Suggest improvements through TradingView comments
- Report bugs with detailed descriptions
- Share successful strategies using the indicator
- Contribute to community discussions
## 🏆 **Credits and Acknowledgments**
This indicator builds upon various open-source libraries and mathematical concepts:
- TradingView ZigZag library for visualization
- Statistical correlation methods from academic research
- Machine learning concepts adapted for financial markets
- Community feedback and testing contributions
## 📈 **Performance Metrics**
The indicator includes built-in performance tracking:
- **Win Rate Calculation**: Percentage of profitable signals
- **Signal Accuracy**: ML prediction vs actual price movement
- **Drawdown Tracking**: Current unrealized P&L from last signal
- **Completion Percentage**: How many perfect conditions are met
## 🔬 **Mathematical Foundation**
### **Correlation Calculations**
- **Pearson**: Measures linear correlation between patterns
- **Spearman**: Rank-based correlation for non-linear relationships
- **Cosine Similarity**: Vector-based similarity for pattern matching
### **Statistical Methods**
- **Z-Score**: (Value - Mean) / Standard Deviation
- **Pattern Normalization**: Price / Price
- **Volatility Percentile**: Historical ranking of current volatility
- **Momentum Calculation**: Price change over multiple periods
## 🎯 **Trading Strategies**
### **Conservative Approach**
- Wait for Perfect Buy Zone (85%+ completion)
- Use higher timeframes for confirmation
- Set stop-loss at recent swing low
- Take profits at resistance levels
### **Aggressive Approach**
- Trade on Strong Buy/Sell signals
- Use lower completion thresholds (70%+)
- Tighter stop-losses with faster exits
- Higher position sizes with confirmed trends
### **Hybrid Strategy**
- Combine with other indicators for confirmation
- Use different settings for different market conditions
- Scale in/out based on signal strength
- Adjust parameters based on market volatility
