4 Bar Momentum Reversal strategy█ STRATEGY DESCRIPTION
The "4 Bar Momentum Reversal Strategy" is a mean-reversion strategy designed to identify price reversals following a sustained downward move. It enters a long position when a reversal condition is met and exits when the price shows strength by exceeding the previous bar's high. This strategy is optimized for indices and stocks on the daily timeframe.
█ WHAT IS THE REFERENCE CLOSE?
The Reference Close is the closing price from X bars ago, where X is determined by the Lookback period. Think of it as a moving benchmark that helps the strategy assess whether prices are trending upwards or downwards relative to past performance. For example, if the Lookback is set to 4, the Reference Close is the closing price 4 bars ago (`close `).
█ SIGNAL GENERATION
1. LONG ENTRY
A Buy Signal is triggered when:
The close price has been lower than the Reference Close for at least `Buy Threshold` consecutive bars. This indicates a sustained downward move, suggesting a potential reversal.
The signal occurs within the specified time window (between `Start Time` and `End Time`).
2. EXIT CONDITION
A Sell Signal is generated when the current closing price exceeds the high of the previous bar (`close > high `). This indicates that the price has shown strength, potentially confirming the reversal and prompting the strategy to exit the position.
█ ADDITIONAL SETTINGS
Buy Threshold: The number of consecutive bearish bars needed to trigger a Buy Signal. Default is 4.
Lookback: The number of bars ago used to calculate the Reference Close. Default is 4.
Start Time and End Time: The time window during which the strategy is allowed to execute trades.
█ PERFORMANCE OVERVIEW
This strategy is designed for trending markets with frequent reversals.
It performs best in volatile conditions where price movements are significant.
Backtesting results should be analysed to optimize the Buy Threshold and Lookback parameters for specific instruments.
Trend

Directional Regime FilterThe Directional Regime Filter is a comprehensive tool designed to help traders identify the market’s dominant regime—bullish, bearish, or choppy/sideways. By blending a Jurik Moving Average (JMA), an RSI filter, an angle-based trend assessment, and multiple smoothing options, this indicator offers a refined approach to spotting trend direction and potential regime shifts. It highlights each regime visually on the chart, allowing you to quickly see when bullish or bearish momentum is emerging or fading.
Features:
The Jurik Moving Average, known for its low lag and smooth responsiveness, allows the tweaking of length, phase, and power to reduce noise while capturing price action effectively.
Relative Strength Index (RSI) with user-defined length and overbought/oversold levels serve as filters for trend confirmation.
A trend threshold is used to decide if the angle of the moving average is strong enough to be considered bullish or bearish. If the angle remains below this threshold, the market is considered to be “choppy” or sideways.
Multiple smoothing methods like EMA, Hull MA, RMA, WMA, or VWMA can be applied to the RSI and the trend angle calculations to further reduce whipsaws and noise.
Customizable timeframe analysis.
Regime Classification:
Bullish Regime: Displayed when the angle is positive beyond the set threshold and the RSI is bullish.
Bearish Regime: Displayed when the angle is negative beyond the set threshold and the RSI is bearish.
Choppy / Sideways Regime: Occurs when the angle does not exceed the threshold in absolute terms or does not meet RSI criteria.
Using the Directional Regime Filter:
This indicator works best when combined with support/resistance levels, volume analysis, or other momentum tools for confirmation.
Tailor the inputs for intraday, swing, or position trading to find an optimal balance between responsiveness and false signals.
Sudden spikes in volatility can cause rapid changes in the trend angle. Keep an eye on the broader market context. Always manage your risk accordingly.
Disclaimer: This indicator is intended for informational and educational purposes only. It is not financial advice. Always perform your own analysis and due diligence. Past performance does not guarantee future results. Use at your own risk.

Uptrick: Oracle Metrics +
Introduction
Uptrick: Oracle Metrics + is a multi-dimensional trading indicator designed to consolidate various technical and risk-oriented signals into one accessible framework. It allows traders to observe market volatility, identify potential reversal points, and assess numerous performance metrics, all within a single interface.
Purpose
The main goal of this indicator is to simplify a broad array of market insights. It merges trend analysis, volatility indicators, on-chart signals, and risk-performance metrics to help traders quickly evaluate the state of a market and make more informed decisions.
Features
1. Cloud Visualization
A colored cloud overlays the chart, indicating market conditions. When the cloud narrows, it can signal upcoming breakout scenarios, as volatility compresses and price movement may accelerate. In contrast, when the cloud is wide, this could hint at an extended trend that might be nearing a pullback or retracement. Observing shifts between narrow and wide phases helps anticipate shifts in momentum.
This can be seen here:
Simple Cloud Overlay
You can also use the cloud like this: when it turns purple you sell when it turns aqua color you buy. These signals are not very accurate in ranging markets but therefore they are usually better on almost all timeframes and assets in trending markets. :
Bounces of cloud. The cloud can also be used as a type of support/resistance. In the example below you can see how the trend bounces off of the cloud. For example, you could add up to your position every time it touches the cloud and then you could fully exit when the cloud turns purple or the trend breaks below the cloud:
An example of a way you could use this indicator as a confirmation is here. In the image below, a fake signal is generated, you can eliminate this signal by waiting for the cloud to turn purple in order to have confirmation for a potential downward move:
2. Bar Coloring for Volatility and System States
Traders can choose between two bar-coloring methods:
• Volatility: Bars change color intensity based on the level of current volatility relative to a historical average. This helps in spotting abrupt changes in market behavior, where bars become more pronounced when volatility is higher. You can see the volatility information in the volatility table.
• System Score: Bars receive a color gradient determined by the indicator’s final overall score. This simplifies spotting bullish, bearish, or neutral phases without needing to inspect multiple metrics separately. The closer the final score is to zero the less the color difference between bullish and bearish is.
3. Reversion Signals and Potential Reversal Alerts
Two sets of on-chart markers help in spotting sudden shifts in momentum:
• Reversion Signals marked with the letter R: These signals combine RSI thresholds, stochastic crossovers, and EMA confirmation to identify potential reversals. RSI highlights overbought (above 70) or oversold (below 30) conditions, while stochastic crossovers confirm shifts in momentum. The EMA ensures signals align with the broader trend, reducing false positives in volatile markets. Together, these components provide a reliable way to spot potential market corrections or reversals.
• Potential Reversal Signals marked with small circles: These signals detect subtle shifts in momentum using a smoothed RSI (via TEMA) and changes in its slope. When the slope turns positive or negative near key levels, it highlights early-stage reversals. This approach helps traders identify timely entry or exit opportunities by capturing potential trend changes before they fully develop.
4. Main Metrics Table
A primary dashboard shows detailed performance measures and market analytics. Next to each value, there is a bullish or bearish arrow to hint at the current direction of that metric. The table includes the following:
• Sharpe Ratio: Offers a view of risk-adjusted returns, hinting at whether rewards outweigh the variability in price.
• Sortino Ratio: A variation of risk-adjusted return focusing more on downside risk.
• Treynor Ratio: Displays returns relative to systematic risk, referencing a user-provided beta.
• Information Ratio: Shows how the instrument is outperforming or underperforming a benchmark, scaled by tracking error.
• ROC: Rate of change in price over a specified period, reflecting momentum.
• MACD Histogram: The difference between fast and slow moving average convergence, illustrating momentum shifts.
• CMF: Chaikin Money Flow, evaluating buying or selling pressure by combining price and volume.
• Ulcer Index: A measure of drawdown intensity to gauge how severe downtrends or pullbacks have been.
• Amihud Ratio: Assesses illiquidity by comparing price impact to volume.
• Market Depth Ratio: Looks at price ranges relative to volume activity, indicating how deeply the market can absorb trades.
• S2F Ratio: Incorporates the asset’s circulating supply relative to its yearly production, sometimes referenced in markets with a defined issuance schedule.
• NVT Ratio: A network value to transactions ratio, typically applied to on-chain data.
• MVRV Ratio: Compares the asset’s market value with its realized value, highlighting overall valuation conditions.
• Autocorrelation: Shows how current price movement may be echoing previous price changes.
• Alpha: Measures excess return over what might be expected from a risk-free rate plus systematic market exposure.
• Skewness: Reveals the asymmetry of the return distribution.
• Kurtosis: Looks at whether returns have heavier or lighter tails than typical distributions.
• Max Drawdown: The largest peak-to-trough drop within a lookback window, a key measure of downside risk.
• Calmar Ratio: Evaluates returns in light of drawdowns, relating performance to the severity of pullbacks.
• Omega Ratio: Considers gains versus losses around a threshold return level to measure reward-to-risk balance.
• January Performance: A snapshot of how price behaves in January over a lookback, connected to the idea of seasonality.
• Bid-Ask Spread: Reflects the percentage difference between highest and lowest price in a period, hinting at market liquidity costs.
5. Final Score Table
After analyzing individual metrics, the indicator calculates an overall score that determines if the broader environment appears bullish, bearish, or neutral. This final score then influences optional color schemes across the chart, allowing traders to see at a glance how multiple data points combine into one stance. For those who prefer a visual “gauge,” an additional grid table can be enabled, where boxes fill with varying color intensities based on the current score. The score calculation is complex and uses a similar technique to TPI. It assigns values to each metric and then divides the score by the amount of metrics. The score is then visualized in the System Generation bar coloring option according to how intense the signal is.
Grids (visualization of how much more the score needs to be a full signal.):
6. Volatility Table
A separate table focuses on how current volatility compares with an average measure. When current volatility differs significantly from historical norms, the bars become more vividly colored. If volatility nears its average, the bars are more subdued. This helps traders know when to be cautious of sudden moves or to adapt their position sizing.
Indicator Inputs
Users can tailor numerous inputs to suit the nature of each instrument:
• Risk-Free Rate (annualized rate used for risk calculations)
• Benchmark Return (expected return of the market benchmark)
• Beta (measure of systematic risk, particularly for Treynor Ratio calculations)
• Lookback Period (window of time used for many rolling calculations)
• ROC Period (time span for the rate of change calculation)
• CMF Period (window for the Chaikin Money Flow measure)
• Ulcer Index Period (depth for the Ulcer Index reading)
• Amihud Illiquidity Period (period for measuring price impact relative to volume)
• Market Depth Ratio Period (time range for examining price breadth versus volume)
• Circulating Supply (used for the stock-to-flow calculation)
• Yearly Production (helps update the stock-to-flow ratio)
• Market Cap (overall value of the instrument, often used in ratio metrics)
• Transaction Volume (on-chain or traded volume data for NVT ratio)
• Realized Value (alternative valuation data, used in MVRV calculation)
• Threshold Return for Omega (sets a custom threshold above which returns are considered favorable)
• Bar Coloring Method (choose between volatility-based or final-score-based color themes)
• Table Text Size (adjust the display size of table entries)
• Additional parameters related to internal signals (like RSI lengths or smoothing settings) can be fine-tuned for different market behaviors. It is important to customize these fields according to the characteristics of the specific asset you are trading.
Important!
Adjust the inputs according to your current asset! The inputs under the 'Vital' section have to be adjusted so that the metrics function properly. If not well adjusted to your asset, your final score will be mixed up and System Bar coloring as well! These inputs include: Circulating Supply, Yearly Production, Market Cap, Transaction Volume, and Realized Value!
Originality and Uniqueness
Uptrick: Oracle Metrics + stands out by combining complex metrics, including calculations similar to the Trend Probability Indicator (TPI), to provide a deeper analysis of market conditions. The indicator offers multiple signals tailored to different trading scenarios, allowing users to filter and customize them manually through a variety of features. This flexibility, combined with its advanced risk and trend analysis tools, makes it a versatile solution for both momentum and long-term trading strategies.
Warnings
In some scenarios, overlapping numbers or markers may crowd the chart. A practical fix for any visual overlap is removing the indicator and then reapplying it, which generally resets the tables and color overlays.
Summary
Uptrick: Oracle Metrics + merges cloud-based analytics, bar-coloring for volatility or system state, reversion alerts, and a detailed metrics dashboard into one seamless interface. This synergy of short-term signals and long-term performance metrics aims to give traders a fuller perspective on risk, trend changes, and valuation. By tuning the inputs to each asset, traders can capture more relevant data, while the color-coded approach simplifies quick decision-making in a dynamic market environment.
Disclaimer
The Uptrick: Oracle Metrics + indicator is a tool designed to assist traders in analyzing market conditions and making informed decisions. It is not a guarantee of future performance or a substitute for independent financial advice. Trading involves significant risk, and past results do not guarantee future outcomes. Users are advised to conduct their own research, consider their financial situation, and consult with a licensed financial professional if necessary. Uptrick and its affiliates are not responsible for any financial losses incurred while using this indicator. Use at your own discretion and risk.

ADVDEC.US OSCILLATORThis Pine Script implements an ADVDEC.US Oscillator, which is an indicator designed to analyze the Advance-Decline index (ADVDEC.US) with multiple smoothing techniques and timeframes. Here's what the script does:
Symbol and Inputs:
- The script is based on the ADVDEC.US index, which measures the difference between advancing and declining stocks.
Users can adjust several settings:
- Lookback Period: Defines the number of periods over which the highest and lowest values of the ADVDEC.US index are calculated.
- Smoothing Period: Smooths the oscillator with a simple moving average (SMA) to reduce market noise.
- EMA Period: Applies an Exponential Moving Average (EMA) to the smoothed oscillator for further trend analysis.
- MTF Period: Allows for fetching data from a specified timeframe (default is 5 minutes).
Calculation:
- It calculates the highest and lowest values of the ADVDEC index over the defined lookback period.
- It normalizes the ADVDEC value into a percentage between 0 and 100, representing the position of the current value relative to the range over the lookback period.
- This raw oscillator is then smoothed with an SMA to reduce choppiness.
- Finally, an EMA is calculated on the smoothed oscillator to emphasize the trend direction.
Thresholds:
- Horizontal lines are plotted at key levels (70, 30, and 50) for visual reference, offering an "RSI-style" interpretation of the oscillator.
- The upper and lower thresholds can indicate overbought/oversold conditions, while the midline helps identify neutral levels.
Visualization:
- The smoothed oscillator is plotted in blue.
- The EMA of the smoothed oscillator is plotted in orange.
In summary, this indicator aims to visualize the relationship between advancing and declining stocks with added smoothing and trend-following elements, providing an easy-to-interpret oscillator that can be used for market analysis or decision-making.

Trend Matrix - XTrend Matrix - X: Advanced Market Trend Analysis
Introduction: Trend Matrix - X is a powerful indicator designed to provide a comprehensive view of market trends, state transitions, and dynamics. By integrating advanced algorithms, statistical methods, and smoothing techniques, it identifies Bullish, Bearish, or Ranging market states while offering deep insights into trend behavior.
This indicator is ideal for traders seeking a balance between noise reduction and real-time responsiveness, with configurations that adapt dynamically to market conditions.
How It Works?
The indicator combines K-Median Clustering, Kalman Filtering, Fractal Dimension Analysis, and various regression techniques to provide actionable insights.
Market State Detection
- Divides data into three clusters: Bullish, Bearish, and Ranging.
- Uses K-Median Clustering to partition data based on medians, ensuring robust state classification even in volatile markets.
- Slope-Based Trend Analysis: Calculates trend slopes using Linear, Polynomial, or Exponential Regression. The slope represents the trend direction and strength, updated dynamically based on market conditions. It can apply Noise Reduction with Kalman Filter to balance stability and sensitivity
Dynamic Lookback Adjustment
- Automatically adjusts the analysis window length based on market stability, volatility, skewness, and kurtosis.
- This feature ensures the indicator remains responsive in fast-moving markets while providing stability in calmer conditions.
Fractal Dimension Measurement
- Calculates Katz Fractal Dimension to assess market roughness and choppiness.
- Helps identify periods of trend consistency versus noisy, range-bound markets.
Why Use Trend Matrix - X?
- Actionable Market States: Quickly determine whether the market is Bullish, Bearish, or Ranging.
- Advanced Smoothing: Reduces noise while maintaining trend-following precision.
- Dynamic Adaptation: Automatically adjusts to market conditions for consistent performance across varying environments.
- Customization: Configure regression type, lookback dynamics, and smoothing to suit your trading style.
- Integrated Visualization: Displays trend states, fractal dimensions, and cluster levels directly on the chart.
Configuration Options
Matrix Type (Raw or Filtered)
- Raw shows the unfiltered slope for real-time precision.
- Filtered applies Kalman smoothing for long-term trend clarity.
Regression Type
- Choose Linear, Polynomial, or Exponential Regression to calculate slopes based on your market strategy.
Dynamic Lookback Adjustment
- Enable Gradual Adjustment to smoothly adapt lookback periods in response to market volatility.
Noise Smoothing
- Toggle Smooth Market Noise to apply advanced filtering, balancing stability with responsiveness.
Cluster State Detection
- Visualize the current state of the market by coloring the candles to match the detected state.
How to Use the Trend Matrix - X Indicator
Step-by-Step Guide
Add the Indicator to Your Chart
- Once applied, it will display: Trend line (Trend Matrix) for identifying market direction, A state table showing the current market state (Bullish, Bearish, or Ranging), Cluster levels (High, Mid, and Low) for actionable price areas, Fractal dimension metrics to assess market choppiness or trend consistency.
Configure Your Settings
- Matrix Source (Raw vs. Filtered): Raw Matrix : Displays real-time, unsmoothed slope values for immediate precision. Ideal for fast-moving markets where rapid changes need to be tracked. Filtered Matrix : Applies advanced smoothing (Kalman Filter) for a clearer trend representation. Recommended for longer-term analysis or noisy markets
- Regression Type (Choose how the trend slope is calculated): Linear Regression : Tracks the average linear rate of change. Best for stable, straightforward trends. Polynomial Regression : Captures accelerating or decelerating trends with a curved fit. Ideal for dynamic, cyclical markets. Exponential Regression : Highlights compounding growth or decay rates. Perfect for parabolic trends or exponential moves.
- Market Noise Smoothing: Applies an adaptive (no lag) smoothing technique to the Matrix Source.
- Gradual Lookback Adjustment: Enable "Gradually Adjust Lookback" to allow the indicator to dynamically adapt its analysis window. (Indicator already does an automatic window, this just refines it).
Read the Outputs
- Trend Matrix Line: Upward Line (Bullish): Market is trending upward; look for buy opportunities. Downward Line (Bearish): Market is trending downward; look for sell opportunities.
- Cluster Levels: High Level (Cluster 0): Represents the upper bound of the trend, often used as a resistance level. Mid Level (Cluster 2): Serves as a key equilibrium point in the trend. Low Level (Cluster 1): Indicates the lower bound of the trend, often used as a support level.
- Market State Table: Displays the current state of the market. Bullish State: Strong upward trend, suitable for long positions. Bearish State: Strong downward trend, suitable for short positions. Ranging State: Sideways market, suitable for range-bound strategies.
- Fractal Dimension Analysis: Low Fractal Dimension (< 1.6): Indicates strong trend behavior; look for trend-following setups. High Fractal Dimension (> 1.6): Suggests choppy, noisy markets; focus on range-trading strategies.
Advanced Usage
- Adaptive Clustering: The indicator uses K-Median Clustering to dynamically identify Bullish, Bearish, and Ranging states based on market data. For traders interested in state transitions, monitor the cluster levels and the state table for actionable changes.
Trading Strategies
- Trend-Following: Use the Filtered Matrix and Fractal Dimension (< 1.6) to identify and follow strong trends. Enter long positions in Bullish States and short positions in Bearish States.
Disclaimer
I am not a professional market analyst, financial advisor, or trading expert. This indicator, Trend Matrix - X, is the result of personal research and development, created with the intention of contributing something that the trading community might find helpful.
It is important to note that this tool is experimental and provided "as-is" without any guarantees of accuracy, profitability, or suitability for any particular trading strategy. Trading involves significant financial risk, and past performance is not indicative of future results.
Users should exercise caution and use their own discretion when incorporating this indicator into their trading decisions. Always consult with a qualified financial advisor before making any financial or trading decisions.
By using this indicator, you acknowledge and accept full responsibility for your trading activities and outcomes. This tool is intended for educational and informational purposes only.

Adaptive Fourier Transform Supertrend [QuantAlgo]Discover a brand new way to analyze trend with Adaptive Fourier Transform Supertrend by QuantAlgo , an innovative technical indicator that combines the power of Fourier analysis with dynamic Supertrend methodology. In essence, it utilizes the frequency domain mathematics and the adaptive volatility control technique to transform complex wave patterns into clear and high probability signals—ideal for both sophisticated traders seeking mathematical precision and investors who appreciate robust trend confirmation!
🟢 Core Architecture
At its core, this indicator employs an adaptive Fourier Transform framework with dynamic volatility-controlled Supertrend bands. It utilizes multiple harmonic components that let you fine-tune how market frequencies influence trend detection. By combining wave analysis with adaptive volatility bands, the indicator creates a sophisticated yet clear framework for trend identification that dynamically adjusts to changing market conditions.
🟢 Technical Foundation
The indicator builds on three innovative components:
Fourier Wave Analysis: Decomposes price action into primary and harmonic components for precise trend detection
Adaptive Volatility Control: Dynamically adjusts Supertrend bands using combined ATR and standard deviation
Harmonic Integration: Merges multiple frequency components with decreasing weights for comprehensive trend analysis
🟢 Key Features & Signals
The Adaptive Fourier Transform Supertrend transforms complex wave calculations into clear visual signals with:
Dynamic trend bands that adapt to market volatility
Sophisticated cloud-fill visualization system
Strategic L/S markers at key trend reversals
Customizable bar coloring based on trend direction
Comprehensive alert system for trend shifts
🟢 Practical Usage Tips
Here's how you can get the most out of the Adaptive Fourier Transform Supertrend :
1/ Setup:
Add the indicator to your favorites, then apply it to your chart ⭐️
Start with close price as your base source
Use standard Fourier period (14) for balanced wave detection
Begin with default harmonic weight (0.5) for balanced sensitivity
Start with standard Supertrend multiplier (2.0) for reliable band width
2/ Signal Interpretation:
Monitor trend band crossovers for potential signals
Watch for convergence of price with Fourier trend
Use L/S markers for trade entry points
Monitor bar colors for trend confirmation
Configure alerts for significant trend reversals
🟢 Pro Tips
Fine-tune Fourier parameters for optimal sensitivity:
→ Lower Base Period (8-12) for more reactive analysis
→ Higher Base Period (15-30) to filter out noise
→ Adjust Harmonic Weight (0.3-0.7) to control shorter trend influence
Customize Supertrend settings:
→ Lower multiplier (1.5-2.0) for tighter bands
→ Higher multiplier (2.0-3.0) for wider bands
→ Adjust ATR length based on market volatility
Strategy Enhancement:
→ Compare signals across multiple timeframes
→ Combine with volume analysis
→ Use with support/resistance levels
→ Integrate with other momentum indicators

Multi Timeframe Market Formation [LuxAlgo]The Multi Timeframe Market Formation tool allows traders to analyze up to 6 different timeframes simultaneously to discover their current formation, S/R levels and their degree of synchronization with the current chart timeframe. Multi timeframe analysis made easy.
🔶 USAGE
By default, the tool displays the chart's timeframe formation plus up to 5 other formations on timeframes higher than the one in the chart.
When the chart formation is synchronized with any enabled timeframe formation, the tool displays labels and a trailing channel, it uses a gradient by default, so the more timeframes are synchronized, the more visible the labels and the trailing channel are.
All timeframes enabled in the settings panel must be higher than the chart timeframe, otherwise the tool will display an error message.
🔹 Formations
A formation is a market structure defined by a lower and an upper boundary (also known as support & resistance).
Each formation has a different symbol and color to identify it at a glance.
It helps traders to know the current market behavior and the tool displays up to 5 of them.
BULLISH (green ▲): higher high and higher low
BEARISH (red ▼): lower high and lower low
CONTRACTION (orange ◀): lower high and higher low
EXPANSION (blue ▶): higher high and lower low
SIDEWAYS (yellow ◀): Any that does not fit with the others
🔹 Multi Timeframe Formations
The tool displays up to 6 different timeframe formations, the chart timeframe plus 5 more configurable from the settings panel.
Each of them has an upper and lower limit, a timeframe, a color and an icon.
If a bound level is shared by more than one formation, the timeframes and symbols are displayed on the same line.
These are significant levels shared by different timeframes and traders need to be aware of them.
🔹 Sync With Chart Timeframe
If the current formation on the chart timeframe is in sync with any of the timeframes enabled in the settings panel, the tool will display this on the chart.
The more timeframes are in sync, the more they are visible, providing a clear visual representation of the common market behavior on multiple timeframes at the same time.
🔶 SETTINGS
Formation size: Size of market formations on the chart timeframe
🔹 Timeframes
TF1 to TF5: Activate/deactivate timeframe, set size of market formation and activate/deactivate high and low levels
🔹 Style
Show Labels: Enable/Disable Timeframe Sync Labels
Transparency Gradient: Enable/Disable Transparency Gradient
Show Trailing Channel | Multiplier: Enable/Disable Trailing Channel and set multiplier
Color for each formation

Trend Force Meter | JeffreyTimmermansTrend Force Meter
The "Trend Force Meter" is an innovative trading tool designed to visualize trend strength and provide precise signals for identifying market dynamics. By combining the Hull Moving Average (HMA) with the Simple Moving Average (SMA), it delivers a comprehensive analysis of trend forces and directions. With customizable smoothing, low-pass filtering, and an advanced color-coded display, this indicator is a valuable addition to any trader's toolkit.
Overview
The Trend Force Meter uses a unique approach to trend analysis by calculating the difference between smoothed HMA and SMA values. This difference is normalized and converted into a visually intuitive gradient to represent bullish and bearish conditions. The indicator also incorporates features for noise reduction and enhanced visualization.
Key Features
Dual Moving Averages
Hull Moving Average (HMA): Provides a highly responsive measure of trend direction and strength.
Simple Moving Average (SMA): Offers a stable and reliable long-term trend baseline.
Customizable Smoothing
Enable/Disable Smoothing: Adjust the sensitivity of the HMA and SMA calculations.
Smoothing Length: Fine-tune the smoothing parameters to match your trading style, balancing between responsiveness and stability.
Low-Pass Filtering
Noise Reduction: Optional low-pass filter reduces market noise, providing clearer trend signals.
Filter Length: Adjustable parameter for fine control over the noise reduction level.
Gradient-Based Visualization
Dynamic Color Coding: Bullish trends are displayed in shades of green, while bearish trends appear in shades of red, providing immediate visual clarity.
Strength Meter: A gradient-based strength meter quantifies the intensity of the current trend, from weak to strong.
Trend Strength Normalization
Normalizes trend strength over a configurable period, ensuring consistent and meaningful readings across various market conditions.
Alerts
Bullish Trend Alert: Notifies when the trend transitions to a bullish phase.
Bearish Trend Alert : Signals when the trend turns bearish.
Enhanced Functionality
Trend Strength Gauge
Displays a real-time strength gauge that visualizes the trend intensity, allowing traders to assess the market at a glance.
Automatically adjusts to reflect normalized trend values, ensuring accuracy across different timeframes and volatility conditions.
Visual Gradient
A refined gradient coloring system dynamically adjusts based on trend direction and intensity, enabling traders to easily interpret market sentiment.
Advanced Customization
Length Settings: Fine-tune HMA and SMA lengths to match specific trading strategies.
Smoothing Options: Toggle smoothing and low-pass filtering on or off as needed.
Gradient Color Range: Provides flexible options for customizing the visual display.
Use Cases
Trend Analysis: Quickly identify the direction and strength of market trends to make informed trading decisions.
Momentum Confirmation : Use the gradient and strength meter to validate potential breakout or reversal scenarios.
Noise Reduction: Employ the low-pass filter to focus on meaningful trends while ignoring short-term market fluctuations.
How It Works
Calculate HMA and SMA: The indicator computes smoothed HMA and SMA values.
Difference Extraction: The difference between the smoothed HMA and SMA forms the core trend signal.
Optional Filtering: Low-pass filtering reduces noise, enhancing the clarity of trend signals.
Normalization: The difference is normalized over the selected period, ensuring consistent scaling.
Visualization: A color-coded gradient and trend strength gauge display the trend’s intensity and direction.
Customization Options
MA Lengths: Adjust the calculation periods for HMA and SMA.
Smoothing and Filtering: Enable or disable smoothing and filtering to refine the signal output.
Color Palette: Choose custom colors to align with personal preferences or trading environments.
Conclusion
The Trend Force Meter is an invaluable addition to any trader’s toolkit, combining cutting-edge techniques with intuitive visuals to make trend analysis more accessible and actionable. Its flexibility and precision cater to various trading strategies, ensuring traders stay ahead of market movements.
This script is inspired by "VanHels1ng" . However, it is more advanced and includes additional features and options.
-Jeffrey
Fibonacci Trend [ChartPrime]Fibonacci Trend Indicator
This powerful indicator leverages supertrend analysis to detect market direction while overlaying dynamic Fibonacci levels to highlight potential support, resistance, and optimal trend entry zones. With its straightforward design, it is perfect for traders looking to simplify their workflow and enhance decision-making.
⯁ KEY FEATURES AND HOW TO USE
⯌ Supertrend Trend Identification :
The indicator uses a supertrend algorithm to identify market direction. It displays purple for downtrends and green for uptrends, ensuring quick and clear trend analysis.
⯌ Fibonacci Levels for Current Swings :
Automatically calculates Fibonacci retracement levels (0.236, 0.382, 0.618, 0.786) for the current swing leg.
- These levels act as key zones for potential support, resistance, and trend continuation.
- The high and low swing points are labeled with exact prices, ensuring clarity.
- If the swing range is insufficient (less than five times ATR), Fibonacci levels are not displayed, avoiding irrelevant data.
⯌ Extended Fibonacci Levels :
User-defined extensions project Fibonacci levels into the future, aiding traders in planning price targets or projecting key zones.
⯌ Optimal Trend Entry Zone :
A filled area between 0.618 and 0.786 levels visually highlights the optimal entry zone for trend continuation. This allows traders to refine their entry points during pullbacks.
⯌ Diagonal Trend Line :
A dashed diagonal line connects the swing high and low, visually confirming the range and trend strength of the current swing.
⯌ Visual Labels for Fibonacci Levels :
Each Fibonacci level is marked with a label displaying its value for quick reference.
⯁ HOW TRADERS CAN POTENTIALLY USE THIS TOOL
Fibonacci Retracements:
Use the Fibonacci retracement levels to find key support or resistance zones where the price may pull back before continuing its trend.
Example: Enter long trades when the price retraces to 0.618–0.786 levels in an uptrend.
Fibonacci Extensions:
Use Fibonacci extensions to project future price targets based on the current trend's swing leg. Levels like 127.2% and 161.8% are commonly used as profit-taking zones.
Reversal Identification:
Spot potential reversals by monitoring price reactions at key Fibonacci retracement levels (e.g., 0.236 or 0.382) or the swing high/low.
Optimal Trend Entries:
The filled zone between 0.618 and 0.786 is a statistically strong area for entering a position in the direction of the trend.
Example: Enter long positions during retracements to this range in an uptrend.
Risk Management:
Set stop-losses below key Fibonacci levels or the swing low/high, and take profits at extension levels, enhancing your trade management strategies.
⯁ CONCLUSION
The Fibonacci Trend Indicator is a straightforward yet effective tool for identifying trends and key Fibonacci levels. It simplifies analysis by integrating supertrend-based trend identification with Fibonacci retracements, extensions, and optimal entry zones. Whether you're a beginner or experienced trader, this indicator is an essential addition to your toolkit for trend trading, reversal spotting, and risk management.

Improved Trend Shot | JeffreyTimmermansImproved Trend Shot
The "Improved Trend Shot" is an advanced trend-following tool that integrates cutting-edge features and the principles of John Ehlers’ SuperSmoother Filter to provide traders with more accurate trend detection and better decision-making. This enhanced version includes multiple smoothing types, customizable lengths, dynamic alerts, and a comprehensive dashboard to help traders quickly interpret market conditions.
This script is inspired by "TRW" . However, it is more advanced and includes additional features and options.
Key Features and Improvements
Smoothed Lines and Trend Detection
The core of the Improved Smooth Trend Shot relies on three key lines to capture market momentum:
Fast Line: Highly sensitive to short-term price changes, offering rapid responsiveness to market movements.
Middle Line: Provides a medium-term view of market trends, acting as a more stable reference.
Slow Line: Focuses on long-term trends, offering a broader perspective on market direction.
These three smoothed lines interact dynamically to create a visual color-coded cloud that helps traders easily interpret market conditions:
Green Cloud: Indicates an upward trend when the Fast line is above the Slow line.
Red Cloud: Signals a downward trend when the Fast line is below the Slow line.
The cloud color adjusts based on the relative positioning of the Fast, Middle, and Slow lines, helping traders to identify bullish or bearish trends with ease.
Dynamic Cloud Visualization and Alerts
The cloud and trend lines adapt to market conditions, updating in real-time to reflect changes in trend strength and momentum. Traders can also set up real-time alerts to notify them of important trend shifts, such as:
Fast and Slow Crossovers: Alerts when the Fast line crosses the Slow line.
Middle and Slow Crossovers: Alerts when the Middle line crosses the Slow line.
This makes it easier to capture trading opportunities and respond promptly to market changes.
Enhanced Smoothing Options
Traders can now choose from multiple smoothing types, including:
EMA (Exponential Moving Average)
SMA (Simple Moving Average)
DEMA (Double Exponential Moving Average)
WMA (Weighted Moving Average)
Each smoothing type has different properties, allowing traders to select the best fit for their trading style. The smoothing length can also be customized, offering flexibility in fine-tuning how sensitive or stable the trend lines should be.
Improved Signal Logic and Precision
The signal logic has been optimized for better precision. Now, the system provides more accurate buy and sell alerts based on:
Trend Detection: The color-coded cloud and the relative positions of the Fast, Middle, and Slow lines help visualize whether the trend is bullish or bearish.
Rising and Falling Indicators: The indicator also checks if each line is rising or falling over the last three bars, offering early signals of momentum shifts.
Dashboard Insights
The dashboard provides real-time updates on the positions and movements of the smoothed lines:
Line Positions: Displays the positions of the Fast, Middle, and Slow lines.
Trend Direction: Shows whether each line is rising or falling.
Price Levels: Displays the price levels for each of the smoothed lines, offering clear reference points for market evaluation.
These features help traders better understand the state of the market, offering valuable insights for both trend-following and reversal-based strategies.
Crossovers and Signal Triggers
The Improved Smooth Trend Shot focuses on crossovers between the different smoothed lines as primary trading signals. There are two types of crossovers:
Fast Shots: This occurs when the Fast line crosses the Slow line.
Slow Shots: This occurs when the Middle line crosses the Slow line.
These crossovers serve as key entry or exit points for traders, helping them spot potential trend reversals. The improved logic ensures that crossovers are accurately detected, reducing the chances of false signals.
Customization Options
The Improved Smooth Trend Shot offers a high degree of customization:
Smoothing Length: Adjust the smoothing period to balance between fast responses and stable trends.
Source Selection: Default to the average of high and low prices (hl2), or choose other price sources.
Smoothing Type: Select from EMA, SMA, DEMA, or WMA for personalized trend analysis.
Signal Type: Choose between Fast Shots or Slow Shots based on the type of crossover you want to focus on.
Long, Medium, and Short-Term Applications
Although the default settings are optimized for long-term trend analysis, the Improved Smooth Trend Shot is highly adaptable. By adjusting the smoothing length and selecting different smoothing types, traders can use the tool for:
Short-Term Trading: Focus on fast responses to market shifts using shorter smoothing periods.
Medium-Term Trading: Tailor the settings to capture intermediate trends.
Long-Term Trend Analysis: Use longer smoothing periods for a more stable and comprehensive view of market dynamics.
Advanced ATR Filtering and Alerts
The inclusion of ATR (Average True Range) filtering helps ensure that signals are triggered only when significant price movements occur. This helps reduce noise and false signals, ensuring traders only act on meaningful market shifts.
Conclusion
The Improved Smooth Trend Shot is a powerful and versatile tool that enhances the original SuperSmoother Filter with advanced features like customizable smoothing options, real-time alerts, and an intuitive dashboard. Whether you're a day trader, swing trader, or long-term investor, this enhanced indicator provides a comprehensive and actionable view of market trends.
The combination of enhanced signal accuracy, dynamic trend visualization, and in-depth customization ensures that the Improved Smooth Trend Shot is an indispensable tool for traders across all market conditions.
-Jeffrey

Bollinger Bands color candlesThis Pine Script indicator applies Bollinger Bands to the price chart and visually highlights candles based on their proximity to the upper and lower bands. The script plots colored candles as follows:
Bullish Close Above Upper Band: Candles are colored green when the closing price is above the upper Bollinger Band, indicating strong bullish momentum.
Bearish Close Below Lower Band: Candles are colored red when the closing price is below the lower Bollinger Band, signaling strong bearish momentum.
Neutral Candles: Candles that close within the bands remain their default color.
This visual aid helps traders quickly identify potential breakout or breakdown points based on Bollinger Band dynamics.

B4100 - NW TrendThis is a trend-following tool based on the Nadaraya-Watson (NW) kernel regression estimator.
Nadaraya-Watson Estimator :
This indicator employs a weighted average of historical prices where the weights are determined by a kernel function. This kernel function gives more weight to recent prices and less weight to older ones. The kernel function's shape (Gaussian, Epanechnikov, or a combination) can be chosen by the user, and its bandwidth controls the sensitivity of the estimator. A smaller value means more sensitivity to short-term changes; a larger value means smoother curves and less sensitivity.
Trend Confirmation:
The indicator also uses a confirmation period (confirm_period) to minimize whipsaws. The trend only changes once the estimator has moved in a particular direction for a configurable number of consecutive bars.
Bandwidth (h):
This is the key parameter controlling the estimator's sensitivity to price changes.
Smaller values (e.g., 10-40) result in a more reactive and wiggly line. This will be more sensitive to short-term price changes.
Larger values (e.g., 100-200) result in a smoother line, focusing on longer-term trends.
Source:
The price data used in the calculations. The default is close but can be changed to other price values such as high, low, or a mathematical combination.
Kernel Type:
Select the type of kernel function to use.
Confirmation Period:
Adjust this setting to specify how many consecutive bars the estimator must be moving in the same direction before the trend is confirmed.
Lower values result in more trend changes.
Higher values result in fewer trend changes and can filter out some noise.
Enjoy, and good luck.
Improved RSI Trend Sniper | JeffreyTimmermansImproved RSI Trend Sniper
This indicator, the "Improved RSI Trend Sniper" is a sophisticated tool designed to enhance market trend analysis by integrating customizable RSI thresholds with advanced moving average options and refined visual enhancements.
Key Features
Advanced Moving Average Options:
The indicator now supports multiple moving average types: SMA, EMA, SMMA, WMA, VWMA, LSMA, HMA, and ALMA, offering greater flexibility in trend analysis.
Users can customize the moving average length for precise momentum detection.
Enhanced Momentum Detection:
Upgraded to allow dynamic calculation of momentum based on user-selected moving averages.
Conditions for bullish or bearish momentum now consider changes in the chosen moving average rather than a fixed EMA, improving accuracy.
Visual Upgrades:
A gradient-based trend fill with multiple opacity layers provides a visually appealing representation of bullish and bearish trends.
New dashboard integration displays key market information, including the ticker, timeframe, and current trend (bullish or bearish).
Improved Signal Customization:
Customizable colors and labels for bullish and bearish signals ensure easy identification on the chart.
Enhanced settings for showing or hiding labels and trend fills
Refined Alerts System:
Alerts are now generated for bullish and bearish conditions with customized messages for better responsiveness.
Alerts can be triggered once per bar close, making them more reliable.
What's New:
RSI and MA Customization: Users can define thresholds and moving average settings, providing more control over trend analysis.
Dashboard Integration: Displays real-time updates directly on the chart for improved situational awareness.
Visual Enhancements: Introduced gradient fills for trend regions, making trends more distinct.
Expanded Moving Average Options: Allows for tailored strategies using various MA calculation methods.
Alert Messaging: Streamlined notifications for actionable insights.
How It Works
Momentum Analysis:
Bullish momentum is detected when the RSI crosses above the bullish threshold and the moving average is increasing.
Bearish momentum is flagged when the RSI falls below the bearish threshold, and the moving average is decreasing.
Trend Visualization:
Bullish trends are highlighted with gradient shades of green, while bearish trends use shades of red.
Labels appear on the chart to mark key turning points.
Tailored for Different Trading Styles
The Improved RSI Trend Sniper is versatile and adaptable, catering to traders with various time horizons:
Long-Term Adjustments: For traders focusing on long-term trends, increasing the RSI length and moving average period allows the indicator to smooth out minor price fluctuations and highlight sustained momentum. Selecting slower-moving averages like the SMA or LSMA further filters out short-term noise, ensuring signals align with broader market trends.
Medium-Term Adjustments: Swing traders can use a balanced RSI length (e.g., 14–20) and a medium moving average period (e.g., 20–50) to capture actionable signals within the mid-range market cycles. The inclusion of options like EMA or SMMA ensures quicker reactions to price changes while maintaining moderate sensitivity to reversals.
Short-Term Adjustments: For day traders or scalpers, using a shorter RSI period (e.g., 7–10) alongside faster moving averages such as the HMA or ALMA can provide quicker signals for high-frequency trading. These adjustments enhance the ability to react swiftly to immediate market shifts, ideal for fast-paced trading environments.
By customizing the indicator’s settings to align with your trading timeframe, the Improved RSI Trend Sniper ensures accurate and relevant insights, empowering traders to optimize their strategies across any market condition.
Dashboard Details
Provides an at-a-glance view of market data for the current ticker and timeframe.
The Improved RSI Trend Sniper takes the original tool to the next level, offering a more comprehensive, customizable, and visually intuitive approach to market trend analysis. Perfect for traders looking to refine their strategies with actionable insights.
-Jeffrey

Relative Performance Indicator by ComLucro - 2025_V01The "Relative Performance Indicator by ComLucro - 2025_V01" is a powerful tool designed to analyze an asset's performance relative to a benchmark index over multiple timeframes. This indicator provides traders with a clear view of how their chosen asset compares to a market index in short, medium, and long-term periods.
Key Features:
Customizable Lookback Periods: Analyze performance across three adjustable periods (default: 20, 50, and 200 bars).
Relative Performance Analysis: Calculate and visualize the difference in percentage performance between the asset and the benchmark index.
Dynamic Summary Label: Displays a detailed breakdown of the asset's and index's performance for the latest bar.
User-Friendly Interface: Includes customizable colors and display options for clear visualization.
How It Works:
The script fetches closing prices of both the asset and a benchmark index.
It calculates percentage changes over the selected lookback periods.
The indicator then computes the relative performance difference between the asset and the index, plotting it on the chart for easy trend analysis.
Who Is This For?:
Traders and investors who want to compare an asset’s performance against a benchmark index.
Those looking to identify trends and deviations between an asset and the broader market.
Disclaimer:
This tool is for educational purposes only and does not constitute financial or trading advice. Always use it alongside proper risk management strategies and backtest thoroughly before applying it to live trading.
Chart Recommendation:
Use this script on clean charts for better clarity. Combine it with other technical indicators like moving averages or trendlines to enhance your analysis. Ensure you adjust the lookback periods to match your trading style and the timeframe of your analysis.
Additional Notes:
For optimal performance, ensure the benchmark index's data is available on your TradingView subscription. The script uses fallback mechanisms to avoid interruptions when index data is unavailable. Always validate the settings and test them to suit your trading strategy.

Improved Target Oscillator | JeffreyTimmermansImproved Target Oscillator
The Improved Target Oscillator is a versatile technical indicator that identifies trends, reversals, and market momentum. Designed to work effectively across various markets, this oscillator excels at capturing longer-term market trends, making it ideal for traders focused on sustained price movements. By using advanced mathematical techniques and dynamic visualization, the oscillator provides actionable insights, helping traders navigate complex market environments with confidence.
Key features include:
A dynamic oscillator line to reflect market momentum and reversals.
Clear gradient-based coloring to distinguish between bullish and bearish conditions.
Signal highlights for potential entry and exit points based on trend shifts.
This tool is particularly useful for identifying extended trends and provides a clean, intuitive interface for assessing market dynamics.
Improvements in the Improved Target Oscillator
Smoothing Feature:
Added an optional smoothing toggle, allowing the use of SMA or EMA for reducing noise.
Provides flexibility through adjustable smoothing length, enhancing clarity in choppy markets.
Alerts for Trade Opportunities:
Built-in alert conditions for bullish and bearish signals.
Allows traders to receive notifications when critical trend changes occur, ensuring they never miss an opportunity.
Customizable to integrate seamlessly into trading workflows.
Enhanced Visualization:
Introduced dynamic gradients for bullish and bearish conditions with improved customization options.
Provides clearer differentiation of momentum changes, improving interpretability.
Signal Highlights:
Improved visual cues for bullish and bearish signals with precise dot indicators.
Offers better alignment with oscillator momentum shifts, ensuring actionable insights.
Adaptability:
Tuned for use in capturing longer-term market trends, emphasizing its effectiveness in identifying sustained movements.
Adjusted oscillator sensitivity with a levels multiplier for better scalability across various market conditions.
Level Markers:
Clearer delineation of key oscillator levels, including half and full normalized levels for improved context.
A neutral line explicitly plotted for easier trend and momentum identification.
Summary
The Improved Target Oscillator combines a sophisticated mathematical foundation with practical visualization enhancements to deliver a more intuitive and precise tool for market analysis. With added flexibility, improved signals, and tailored features for longer-term trends, this oscillator is an essential resource for traders looking to refine their strategies.
-Jeffrey

Phase Cross Strategy with Zone### Introduction to the Strategy
Welcome to the **Phase Cross Strategy with Zone and EMA Analysis**. This strategy is designed to help traders identify potential buy and sell opportunities based on the crossover of smoothed oscillators (referred to as "phases") and exponential moving averages (EMAs). By combining these two methods, the strategy offers a versatile tool for both trend-following and short-term trading setups.
### Key Features
1. **Phase Cross Signals**:
- The strategy uses two smoothed oscillators:
- **Leading Phase**: A simple moving average (SMA) with an upward offset.
- **Lagging Phase**: An exponential moving average (EMA) with a downward offset.
- Buy and sell signals are generated when these phases cross over or under each other, visually represented on the chart with green (buy) and red (sell) labels.
2. **Phase Zone Visualization**:
- The area between the two phases is filled with a green or red zone, indicating bullish or bearish conditions:
- Green zone: Leading phase is above the lagging phase (potential uptrend).
- Red zone: Leading phase is below the lagging phase (potential downtrend).
3. **EMA Analysis**:
- Includes five commonly used EMAs (13, 26, 50, 100, and 200) for additional trend analysis.
- Crossovers of the EMA 13 and EMA 26 act as secondary buy/sell signals to confirm or enhance the phase-based signals.
4. **Customizable Parameters**:
- You can adjust the smoothing length, source (price data), and offset to fine-tune the strategy for your preferred trading style.
### What to Pay Attention To
1. **Phases and Zones**:
- Use the green/red phase zone as an overall trend guide.
- Avoid taking trades when the phases are too close or choppy, as it may indicate a ranging market.
2. **EMA Trends**:
- Align your trades with the longer-term trend shown by the EMAs. For example:
- In an uptrend (price above EMA 50 or EMA 200), prioritize buy signals.
- In a downtrend (price below EMA 50 or EMA 200), prioritize sell signals.
3. **Signal Confirmation**:
- Consider combining phase cross signals with EMA crossovers for higher-confidence trades.
- Look for confluence between the phase signals and EMA trends.
4. **Risk Management**:
- Always set stop-loss and take-profit levels to manage risk.
- Use the phase and EMA zones to estimate potential support/resistance areas for exits.
5. **Whipsaws and False Signals**:
- Be cautious in low-volatility or sideways markets, as the strategy may generate false signals.
- Use additional indicators or filters to avoid entering trades during unclear market conditions.
### How to Use
1. Add the strategy to your chart in TradingView.
2. Adjust the input settings (e.g., smoothing length, offsets) to suit your trading preferences.
3. Enable the strategy tester to evaluate its performance on historical data.
4. Combine the signals with your own analysis and risk management plan for best results.
This strategy is a versatile tool, but like any trading method, it requires proper understanding and discretion. Always backtest thoroughly and trade with discipline. Let me know if you need further assistance or adjustments to the strategy!

Adaptive Trend Flow Strategy with Filters for SPXThe Adaptive Trend Flow Strategy with Filters for SPX is a complete trading algorithm designed to identify traits and offer actionable alerts for the SPX index. This Pine Script approach leverages superior technical signs and user-described parameters to evolve to marketplace conditions and optimize performance.
Key Features and Functionality
Dynamic Trend Detection: Utilizes a dual EMA-based totally adaptive method for fashion calculation.
The script smooths volatility the usage of an EMA filter and adjusts sensitivity through the sensitivity enter. This allows for real-time adaptability to market fluctuations.
Trend Filters for Precision:
SMA Filter: A Simple Moving Average (SMA) guarantees that trades are achieved best while the rate aligns with the shifting average trend, minimizing false indicators.
MACD Filter: The Moving Average Convergence Divergence (MACD) adds some other layer of confirmation with the aid of requiring alignment among the MACD line and its sign line.
Signal Generation:
Long Signals: Triggered when the fashion transitions from bearish to bullish, with all filters confirming the pass.
Short Signals: Triggered while the trend shifts from bullish to bearish, imparting opportunities for final positions.
User Customization:
Adjustable parameters for EMAs, smoothing duration, and sensitivity make certain the strategy can adapt to numerous buying and selling patterns.
Enable or disable filters (SMA or MACD) based totally on particular market conditions or consumer possibilities.
Leverage and Position Sizing: Incorporates a leverage aspect for dynamic position sizing.
Automatically calculates the exchange length based on account fairness and the leverage element, making sure hazard control is in area.
Visual Enhancements: Plots adaptive fashion ranges (foundation, top, decrease) for actual-time insights into marketplace conditions.
Color-coded bars and heritage to visually represent bullish or bearish developments.
Custom labels indicating crossover and crossunder occasions for clean sign visualization.
Alerts and Automation: Configurable alerts for each lengthy and quick indicators, well matched with automated buying and selling structures like plugpine.Com.
JSON-based alert messages consist of account credentials, motion type, and calculated position length for seamless integration.
Backtesting and Realistic Assumptions: Includes practical slippage, commissions, and preliminary capital settings for backtesting accuracy.
Leverages excessive-frequency trade sampling to make certain strong strategy assessment.
How It Works
Trend Calculation: The method derives a principal trend basis with the aid of combining fast and gradual EMAs. It then uses marketplace volatility to calculate adaptive upper and decrease obstacles, creating a dynamic channel.
Filter Integration: SMA and MACD filters work in tandem with the fashion calculation to ensure that handiest excessive-probability signals are accomplished.
Signal Execution: Signals are generated whilst the charge breaches those dynamic tiers and aligns with the fashion and filters, ensuring sturdy change access situations.
How to Use
Setup: Apply the approach to SPX or other well suited indices.
Adjust person inputs, together with ATR length, EMA smoothing, and sensitivity, to align together with your buying and selling possibilities.
Enable or disable the SMA and MACD filters to test unique setups.
Alerts: Configure signals for computerized notifications or direct buying and selling execution through third-celebration systems.
Use the supplied JSON payload to integrate with broking APIs or automation tools.
Optimization:
Experiment with leverage, filter out settings, and sensitivity to find most effective configurations to your hazard tolerance and marketplace situations.
Considerations and Best Practices
Risk Management: Always backtest the method with realistic parameters, together with conservative leverage and commissions.
Market Suitability: While designed for SPX, this method can adapt to other gadgets by means of adjusting key parameters.
Limitations: The method is trend-following and can underperform in enormously risky or ranging markets. Regularly evaluate and modify parameters primarily based on recent market conduct.
If you have any questions please let me know - I'm here to help!

OBV TSI IndicatorThe OBV TSI Indicator combines two powerful technical analysis tools: the On-Balance Volume (OBV) and the True Strength Index (TSI). This hybrid approach provides insights into both volume dynamics and momentum, helping traders identify potential trend reversals, breakouts, or continuations with greater accuracy.
The OBV TSI Indicator tracks cumulative volume shifts via OBV and integrates the TSI for momentum analysis. It offers customizable moving average options for further smoothing. Visual trendlines, pivot points, and signal markers enhance clarity.
The OBV tracks volume flow by summing volumes based on price changes. Positive volume is added when prices rise, and negative volume is subtracted when prices fall. The result is smoothed to detect meaningful trends in volume. A volume spread is derived from the difference between the smoothed OBV and cumulative volume. This is then adjusted by the price deviation to generate the shadow spread, which highlights critical volume-driven price levels.
The shadow spread is added to either the high or low price, depending on its sign, producing a refined OBV output. This serves as the main source for the subsequent TSI calculation. The TSI is a momentum oscillator calculated using double-smoothed price changes. It provides an accurate measure of trend strength and direction.
Various moving average options, such as EMA, DEMA, or TEMA, are applied to the smoothed OBV for additional trend filtering. Users can select their preferred type and length to suit their trading strategy. Trendlines are plotted to visualize the overall direction. When a significant change in trend is detected, up or down arrows indicate potential buy or sell signals. The script identifies key pivot points based on the highest and lowest levels within a defined period. These pivots help pinpoint reversal zones.
The indicator offers customization options, allowing users to adjust the OBV length for smoothing, choose from various moving average types, and fine-tune the short, long, and signal periods for TSI. Additionally, users can toggle visibility for trendlines, signals, and pivots to suit their preferences.
This indicator is ideal for practical use cases such as spotting potential trend reversals by observing TSI crossovers and pivot levels, anticipating breakouts from key price levels using the shadow spread, and validating trends by aligning TSI signals with OBV and moving averages.
The OBV TSI Indicator is a versatile tool designed to enhance decision-making in trading by combining volume and momentum analysis. Its flexibility and visual aids make it suitable for traders of all experience levels. By leveraging its insights, you can confidently navigate market trends and improve your trading outcomes.

Special Forces Supertrend | JeffreyTimmermansSpecial Forces Supertrend Indicator
The "Special Forces Supertrend" is a cutting-edge trading indicator designed by Jeffrey Timmermans to provide traders with actionable insights into market trends. It combines advanced moving averages with dynamic range calculations to adapt to changing market conditions, ensuring clear and reliable trend identification.
Core Features
Trend Identification:
Integrates a customizable moving average (MA) with multiple types such as SMA, EMA, SMMA, WMA, VWMA, TEMA, DEMA, LSMA, HMA, or ALMA.
Employs a dynamic range calculation using the highest high over a user-defined period, modified by adjustable multipliers.
Offers the option to switch between average range and specific lookback periods for increased adaptability.
Signal Generation:
Scores are calculated based on price action relative to the moving average and dynamic range.
Generates bullish (long) and bearish (short) crossover signals using these scores.
Alerts for long and short conditions are integrated, ensuring traders never miss an opportunity.
Visual Indicators:
Candlestick Coloring: Trends are visually distinguished—greenish hues for bullish conditions and purplish hues for bearish conditions.
Moving Average Line: A semi-transparent, color-coded line dynamically adjusts to match the trend direction for improved clarity.
Range Visualization: A semi-transparent shaded area indicates potential support or resistance levels based on the average range calculation.
Customization Options
Range Settings:
Length: Determines the period for calculating the highest high.
Lookback Alpha & Beta: Enables varied lookback periods for range computation.
Multiplier Alpha & Beta: Fine-tune the range sensitivity using these multipliers.
Use Average Range: Toggle between average range or specific lookback periods for signal generation.
Source Input: Select a data source (e.g., close price) to adapt the range calculation for highly volatile assets.
Moving Average Settings:
Type MA: Choose from multiple moving average methods to suit different trading styles.
Length: Define the length for the moving average calculation.
Source: Specify the price source (default is close price).
Color Customization: Choose personalized colors for bullish and bearish trends to align with your trading environment.
Alerts:
Supertrend Long Alert: Notifies when a bullish crossover is detected.
Supertrend Short Alert: Notifies when a bearish crossover is detected.
How to Use
The Special Forces Supertrend indicator is a versatile tool that excels in identifying and confirming trends.
For optimal performance:
Use it in combination with other indicators or analysis methods to validate signals.
Adjust its parameters to align with specific market instruments or your trading strategy.
This indicator is tailored to meet the needs of both novice and experienced traders, providing flexibility, reliability, and clear visual cues for navigating complex market dynamics.
-Jeffrey
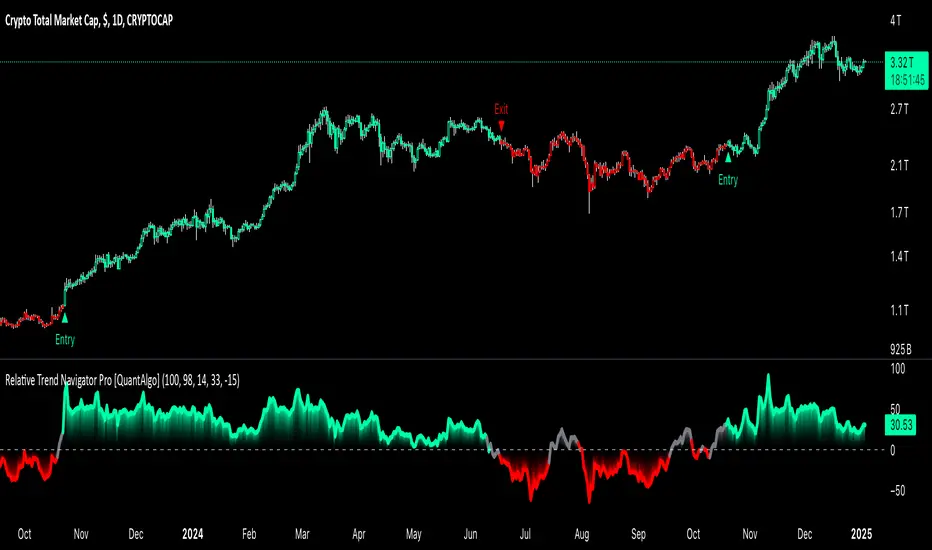
Relative Trend Navigator Pro [QuantAlgo]Upgrade your trend-following investing and trading strategy with Relative Trend Navigator Pro by QuantAlgo , a sophisticated technical indicator that combines adaptive trend recognition with dynamic momentum analysis to deliver high quality market insights. Whether you're a medium- to long-term investor focusing on sustained moves or an active trader seeking high-probability entries, this indicator's multi-layered approach offers valuable strategic advantages that you don't want to miss out on!
🟢 Core Architecture
The foundation of this indicator lies in its innovative Relative Trend Index (RTI) calculation and dynamic state management system. By implementing a unique array-based analysis alongside statistical volatility measures, each price movement is evaluated against its historical context while maintaining responsiveness to current market conditions. This sophisticated approach helps distinguish genuine trend developments from market noise across various timeframes and instruments.
🟢 Technical Foundation
Three key components power this indicator are:
Dynamic Trend Boundaries: Utilizes standard deviation-based channels to establish adaptive price ranges
Array-Based Historical Analysis: A comprehensive dynamic momentum system that processes and sorts historical data for trend context
Relative Trend Index (RTI): A normalized calculation that measures current price position relative to historical boundaries
🟢 Key Features & Signals
The Relative Trend Navigator Pro delivers market insights through:
Color-adaptive RTI line that reflects trend strength and direction
Dynamic threshold levels for bull and bear signal generation
Smart fill coloring between RTI and zero line for enhanced visualization
Clear entry and exit markers for validated trend changes
Intelligent bar coloring that highlights current trend state
Customizable alert system for both bullish and bearish setups
🟢 Practical Usage Tips
Here's how to maximize your use of the Relative Trend Navigator Pro :
1/ Setup:
Add the indicator to your favorites ⭐️
Begin with the default historical lookback for balanced analysis
Use the default sensitivity setting for optimal signal generation
Start with standard threshold levels
Customize visualization colors to match your chart preferences
Enable both bar coloring and signal markers for complete visual feedback
2/ Reading Signals:
Watch for signal markers - they indicate validated trend transitions
Monitor RTI line color changes for trend direction confirmation
Observe the fill color between RTI and zero line for trend strength
Use the built-in alert system to stay informed of potential trend changes
🟢 Pro Tips
Adjust Historical Lookback Period based on your preferred timeframe:
→ Lower values (20-50) for more responsive signals
→ Higher values (100-200) for more stable trend identification
Fine-tune Sensitivity based on market conditions:
→ Higher values (95-100) for choppy markets
→ Lower values (85-95) for trending markets
Optimize Threshold Levels for your strategy:
→ Increase thresholds for stronger trend confirmation
→ Decrease thresholds for earlier entries
Combine with:
→ Volume analysis for trade confirmation
→ Multiple timeframe analysis for strategic context
→ Support/resistance levels for entry/exit refinement
WMA Killer Ratio Analysis | JeffreyTimmermansWMA Killer Ratio Analysis
The WMA Killer Ratio Analysis is a highly responsive trend-following indicator designed to deliver quick and actionable insights on the ETHBTC ratio. By utilizing advanced smoothing methods and normalized thresholds, this tool efficiently identifies market trends. Let’s dive into the details:
Core Mechanics
1. Smoothing with Standard Deviations
The WMA Killer Ratio Analysis begins by smoothing source price data using standard deviations, which measure the typical variance in price movements. This creates dynamic deviation levels:
Upper Deviation: Marks the high boundary, indicating potential overbought conditions.
Lower Deviation: Marks the low boundary, signaling potential oversold conditions.
These levels are integrated with the Weighted Moving Average (WMA), filtering out market noise and honing in on significant price shifts.
2. Weighted WMA Bands
The WMA is further refined with dynamic weighting:
Upper Weight: Expands the WMA, creating an Upper Band to capture extreme price highs.
Lower Weight: Compresses the WMA, forming a Lower Band to reflect price lows.
This adaptive dual-weighting system highlights potential areas for trend reversals or continuations with precision.
3. Normalized WMA (NWMA) Analysis
The Normalized WMA adds a deeper layer of trend evaluation: It calculates the percentage change between the source price and its smoothed average. Positive NWMA values suggest overbought conditions, while negative NWMA values point to oversold conditions.
Traders can customize long (buy) and short (sell) thresholds to align signal sensitivity with their strategy and market conditions.
Signal Logic
Buy (Long) Signals: Triggered when the price remains above the lower deviation level and the NWMA crosses above the long threshold. Indicates a bullish trend and potential upward momentum.
Sell (Short) Signals: Triggered when the price dips below the upper deviation level and the NWMA falls beneath the short threshold. Suggests bearish momentum and a potential downward trend.
Note: The WMA Killer Ratio Analysis is most effective when paired with other forms of analysis, such as volume, higher time-frame trends, or fundamental data.
Visual Enhancements
The WMA Killer Ratio Analysis emphasizes usability with clear and dynamic plotting features:
1. Color-Coded Trend Indicators: The indicator changes color dynamically to represent trend direction. Users can customize colors to suit specific trading pairs (e.g., ETHBTC, SOLBTC).
2. Threshold Markers: Dashed horizontal lines represent long and short thresholds, giving traders a visual reference for signal levels.
3. Deviation Bands with Fill Areas: Upper and Lower Bands are plotted around the WMA. Shaded regions highlight deviation zones, making trend boundaries easier to spot.
4. Signal Arrows and Bar Coloring: Arrows or triangles appear on the chart to mark potential buy (upward) or sell (downward) points. Candlesticks are color-coded based on the prevailing trend, allowing traders to interpret the market direction at a glance.
Customization Options
Adjustable Thresholds: Tailor the sensitivity of long and short signals to your strategy.
Dynamic Weighting: Modify upper and lower band weights to adapt the WMA to varying market conditions.
Source Selection: Choose the preferred input for price data smoothing, such as closing price or an average (hl2).
The WMA Killer Ratio Analysis combines rigorous mathematical analysis with intuitive visual features, providing traders with a reliable way to identify trends and make data-driven decisions. While it excels at detecting key market shifts, its effectiveness increases when integrated into a broader trading strategy.
-Jeffrey
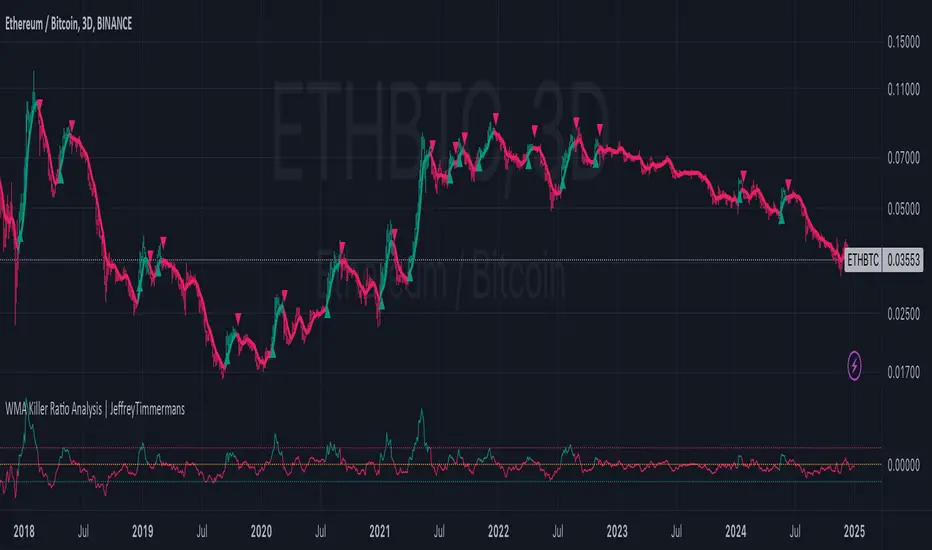
Dual Bayesian For Loop [QuantAlgo]Discover the power of probabilistic investing and trading with Dual Bayesian For Loop by QuantAlgo , a cutting-edge technical indicator that brings statistical rigor to trend analysis. By merging advanced Bayesian statistics with adaptive market scanning, this tool transforms complex probability calculations into clear, actionable signals—perfect for both data-driven traders seeking statistical edge and investors who value probability-based confirmation!
🟢 Core Architecture
At its heart, this indicator employs an adaptive dual-timeframe Bayesian framework with flexible scanning capabilities. It utilizes a configurable loop start parameter that lets you fine-tune how recent price action influences probability calculations. By combining adaptive scanning with short-term and long-term Bayesian probabilities, the indicator creates a sophisticated yet clear framework for trend identification that dynamically adjusts to market conditions.
🟢 Technical Foundation
The indicator builds on three innovative components:
Adaptive Loop Scanner: Dynamically evaluates price relationships with adjustable start points for precise control over historical analysis
Bayesian Probability Engine: Transforms market movements into probability scores through statistical modeling
Dual Timeframe Integration: Merges immediate market reactions with broader probability trends through custom smoothing
🟢 Key Features & Signals
The Adaptive Dual Bayesian For Loop transforms complex calculations into clear visual signals:
Binary probability signal displaying definitive trend direction
Dynamic color-coding system for instant trend recognition
Strategic L/S markers at key probability reversals
Customizable bar coloring based on probability trends
Comprehensive alert system for probability-based shifts
🟢 Practical Usage Tips
Here's how you can get the most out of the Dual Bayesian For Loop :
1/ Setup:
Add the indicator to your TradingView chart by clicking on the star icon to add it to your favorites ⭐️
Start with default source for balanced price representation
Use standard length for probability calculations
Begin with Loop Start at 1 for complete price analysis
Start with default Loop Lookback at 70 for reliable sampling size
2/ Signal Interpretation:
Monitor probability transitions across the 50% threshold (0 line)
Watch for convergence of short and long-term probabilities
Use L/S markers for potential trade signals
Monitor bar colors for additional trend confirmation
Configure alerts for significant trend crossovers and reversals, ensuring you can act on market movements promptly, even when you’re not actively monitoring the charts
🟢 Pro Tips
Fine-tune loop parameters for optimal sensitivity:
→ Lower Loop Start (1-5) for more reactive analysis
→ Higher Loop Start (5-10) to filter out noise
Adjust probability calculation period:
→ Shorter lengths (5-10) for aggressive signals
→ Longer lengths (15-30) for trend confirmation
Strategy Enhancement:
→ Compare signals across multiple timeframes
→ Combine with volume for trade validation
→ Use with support/resistance levels for entry timing
→ Integrate other technical tools for even more comprehensive analysis

Premarket and Opening Range (First 30 minutes) LevelsThis indicator is for people who like to utilize the pre-market highs and pre-market Low's as well as the first 30 minutes high and low, or some people like to call the opening range. I hope you find value in this. Note, the levels will only appear after tracking. Premarket levels will happen after pre-market closes. Opening Range levels will show right after the first 30 minutes.