Indicatore Pine Script®
Media mobile ponderata (WMA)
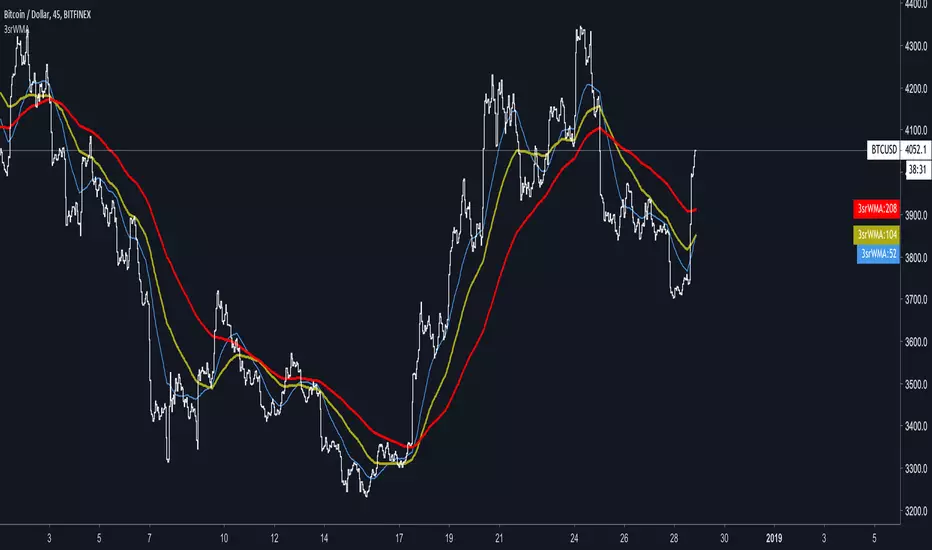
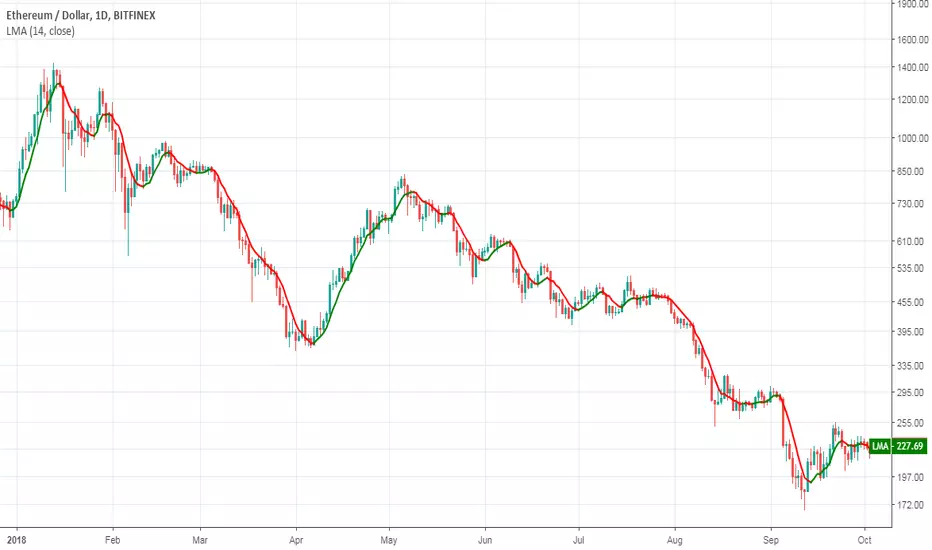
Self-Weighted Moving AverageThis type of moving average was originally developed by Alex Orekhov at his home. This WMA uses previous prices as weights for the new ones. At the moment, this is a highly experimental approach, so don't use it in real trading.
The weighting scheme is presented on the chart.
Indicatore Pine Script®

9 moyennes configurables3 moyennes mobiles simples, 3 moyennes exponentielles et 3 moyennes ponderées.
Longueurs configurables dans les paramètres d'entrée.
Indicatore Pine Script®

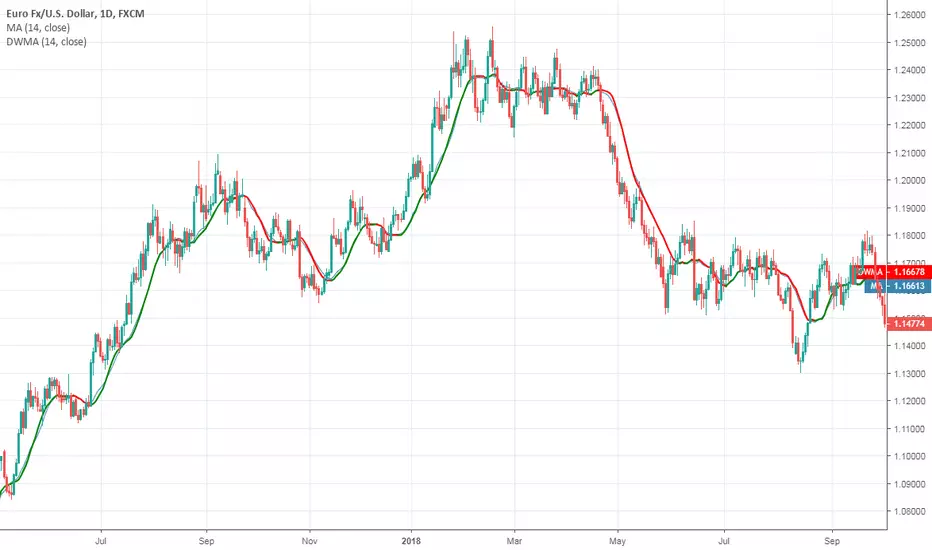
Jurik JMA/DWMA CrossoverThis is a crossover system that was recommended by Mark Jurik. The system consists of Jurik Moving Average (JMA) and Double Weighted Moving Average (DWMA). In case of Jurik Moving Average I use the best original JMA' clone on TradingView that has the almost identical behaviour as the original one.
As Mr. Jurik noticed:
" JMA is ideal for the fast moving average line because it is quick to respond to reversals, is smooth and can be set to have no overshoot. DWMA (double weighted moving average) is ideal for the slower line as is tends to delay reversing direction until JMA crosses it."
Reference: www.jurikres.com
Indicatore Pine Script®

Indicatore Pine Script®

Indicatore Pine Script®
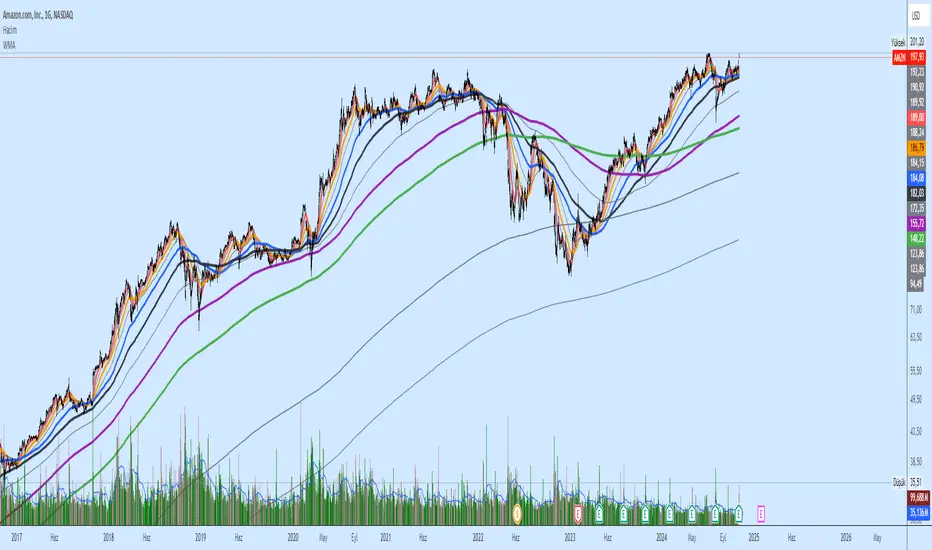
Multi Custom Moving Averages by FlintyThis script allows up to 10 moving averages to be customised and plotted.
You can set the number of days used in the calculation from: 1 to 999.
Choose between :EMA, SMA , WMA for each MA.
Set source value: open, high, low, close, hl2 , hlc3, ohcl4.
Adjust the colour and line style to suit your taste.
Each MA can be enabled / disabled with the click of a button.
Indicatore Pine Script®

Multiple customizable MA own timeresolution own MA-typeMultiple (8) customizable MA
Features:
Set MA-Type/Smoothing: "RMA", "SMA", "EMA", "WMA", "VWMA"
Set Timeframe/Resolution: "60", "240", "1D", "1W", "1M", "Chart"
To use the native chart time resolution select "Chart" as TimeFrame
Indicatore Pine Script®

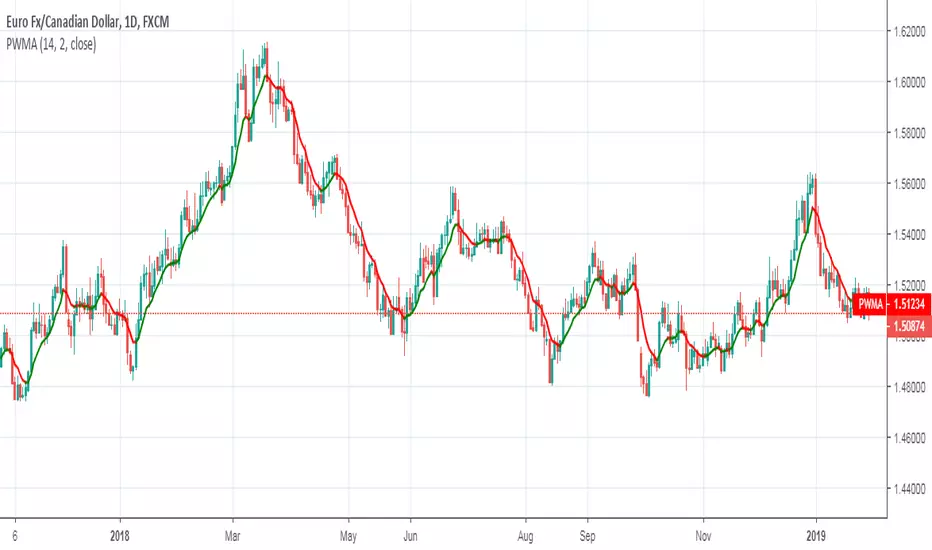
Parabolic Weighted Moving AverageThe weights of this moving average are powers of the weights of the standard weighted moving average WMA .
Remember:
When parameter Power = 0, you will get SMA .
When parameter Power = 1, you will get WMA .
Good luck!
Indicatore Pine Script®
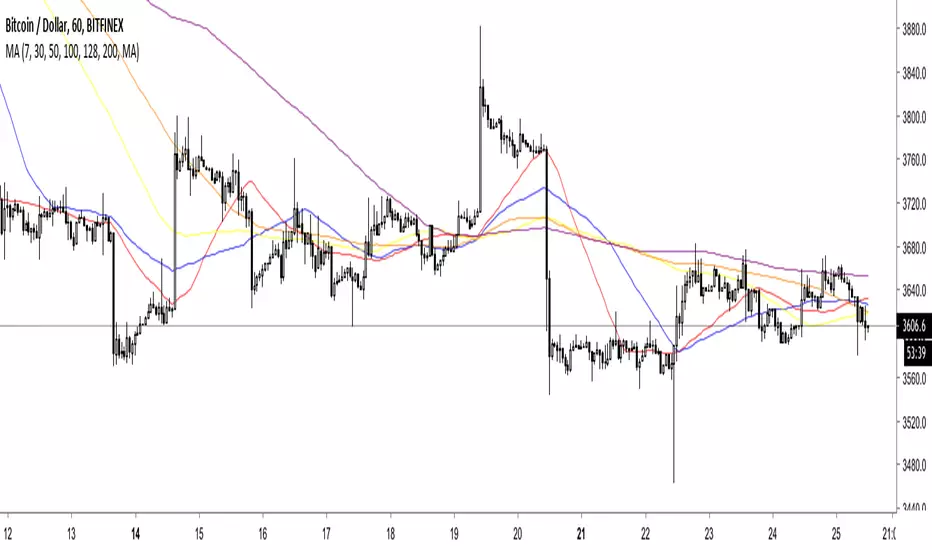
6MA: Moving Averages in One ScriptInstead of wasting 6 indicators this script lets you do custom 6 moving averages in one.
You are able to select MA EMA or WMA
Default values: 7, 30, 50, 100, 128, 200
Indicatore Pine Script®
6MA: Moving Averages in One ScriptInstead of wasting 6 indicators this script lets you do custom 6 moving averages in one.
You are able to select MA EMA or WMA
Default values: 7, 30, 50, 100, 128, 200
Indicatore Pine Script®

Double Weighted Moving AverageMr. Jurik uses this weighted moving average to create a crossover trading system with his JMA.
To learn more see www.jurikres.com .
Good luck!
Indicatore Pine Script®

Inverse Distance Weighted Moving AverageThe weights of this moving average are the sums of distances between points.
Good luck!
Indicatore Pine Script®

Distance Weighted Moving AverageAdopted to Pine from systemtradersuccess.com
They wrote that this average is designed to be a robust version of a moving average to reduce the impact of outliers, but I dont see a significant difference comparing it with SMA. So, I published it for the educational purposes.
To learn more about the robust filters and averages google Hampel Filter, Interquartile Range Filter and Recursive Median Filter (or any other filter that is based on quartiles).
Good luck!
Indicatore Pine Script®
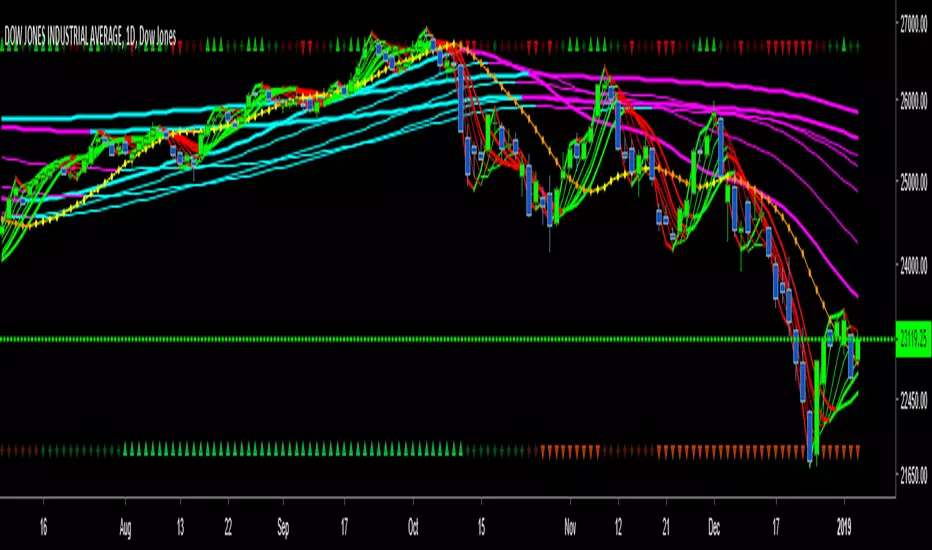
Multiple Moving Average Colors7 moving averages in 1 indicator, including the Hull Moving Average.
I've updated with some graphics that print at the top of the chart (you can change color and placement on the indicator settings page)
All 7 MAs Up - Green and up triangle
All 7 MAs Down - Red and down triangle
4, 5 or 6 MAs Up - Dark green and a square
4, 5 or 6 MAs Down - Maroon and a square
Indicatore Pine Script®

Indicatore Pine Script®
Indicatore Pine Script®
Indicatore Pine Script®
SMA/WMA histogram with MTF and alertsThis histogram is based on the difference between SMA and WMA (I make it as false MACD to create signals)
Since we have the non repainting MTF function we can see the buy and the sell signals at different time frames.
the color of the histo change according to difference so as the color change from dark red to light red be ready to buy and if color change from dark green to light green be ready to sell. The signal based on cross to the 0 .
since you have MTF in build you can change time frame changing int2 to desire min you want
here 60 min MTF on 30 min graph. you can make any variation you want .it flexible model allow you to find the best setting for your purpose
Indicatore Pine Script®

Fibonacci Weighted Moving AverageHello traders and developers!
The weights of this WMA are Fibonacci numbers. That's all)
Good luck and happy trading!
Indicatore Pine Script®

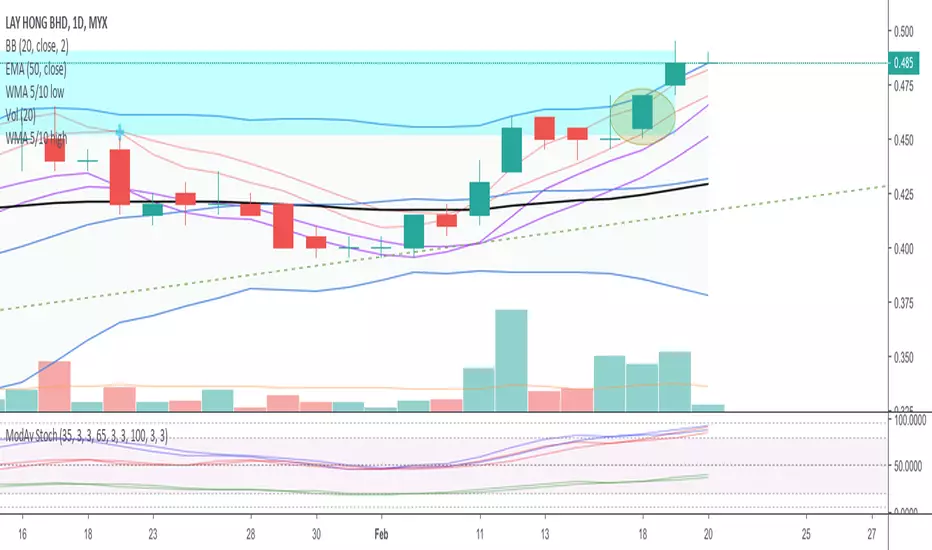
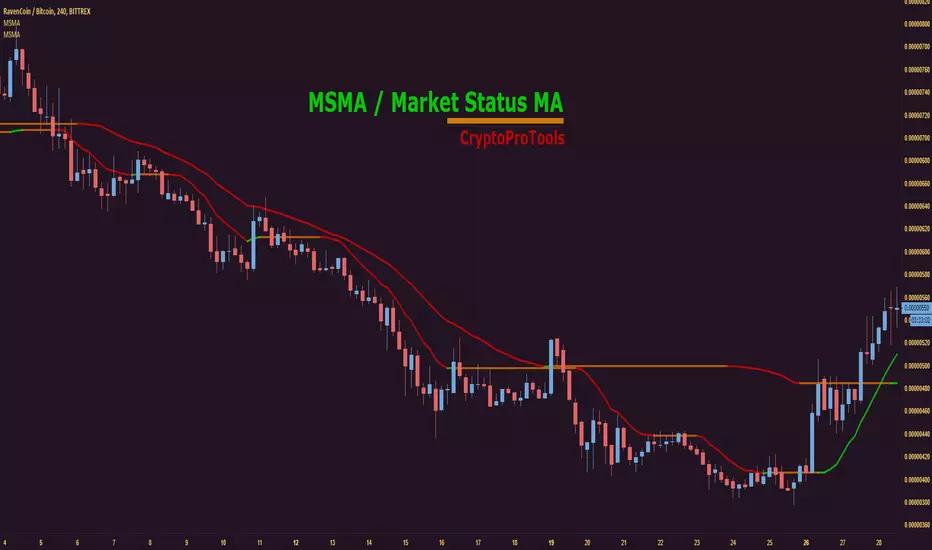
Market Status Moving AverageGet a quick easy view of the current market status.
Examples used above are lengths 6 and 15, but you can tweak to your liking.
Want to stop sweating the small stuff and see the bigger picture? Try increasing the length to 50, 100 etc
Green = Bullish
Orange = Consolidation / Flat
Red = Bearish
--------------------------------------------------------------------
--------------------------------------------------------------------
Check out some of our other recent releases below :
Indicatore Pine Script®
MW+MA Cross StrategyThe strategy uses WMA and SMA indicators with certain algorithm in order to create signals when they cross.
Strategia Pine Script®

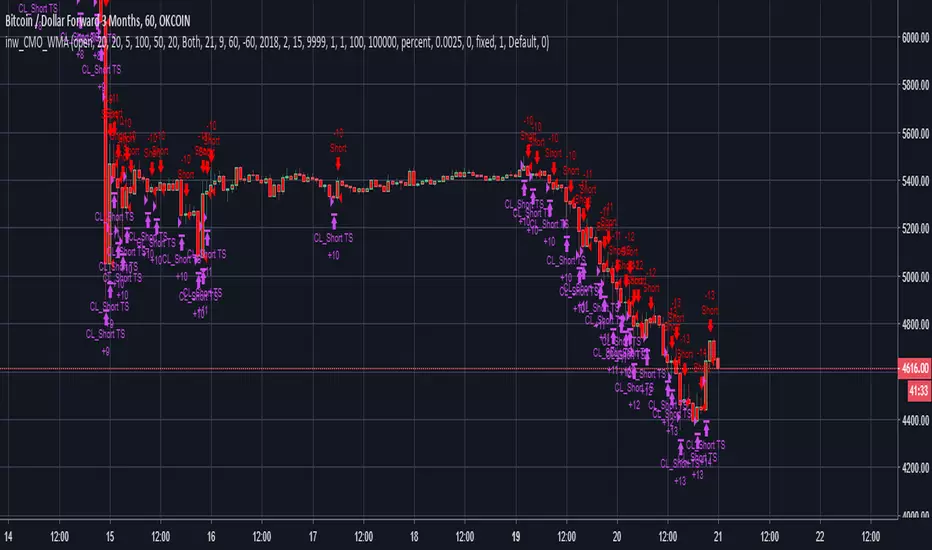
inwCoin CMO&WMA StrategyOriginal strategy by HPotter :
Actually I still have no idea how it work but the backtest result is way too good haha
Let me know if you want to try this strategy.
Strategia Pine Script®