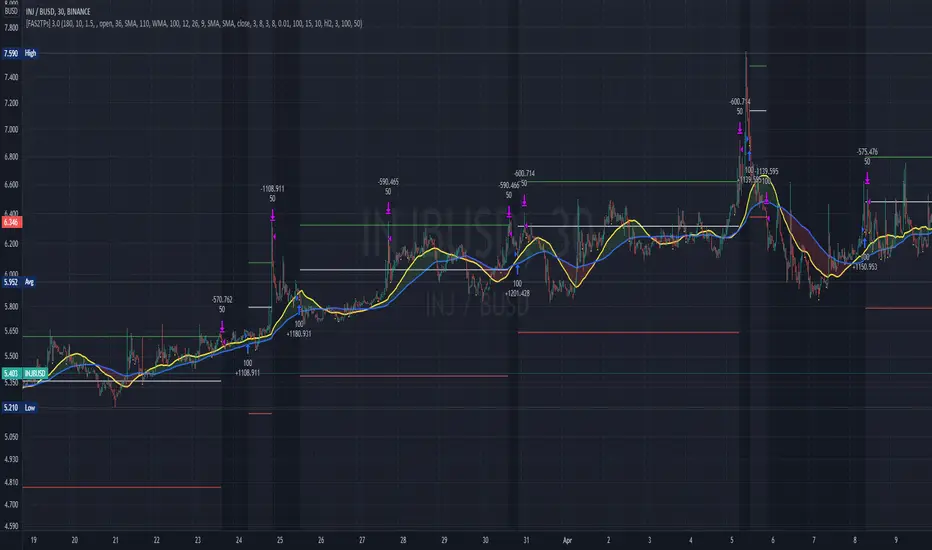
RedK_MAGicWAVe_v3: Improved Visual & Code RevampI have been planning to re-write the MAGicWAVe script for a long time, so here's a totally revamped version.
What is the MAGic WAVe ?
- this is one of my first indicators - and is a constant in my trading charts ...
- It's really a simple idea that plays with weighted moving averages (WMA) to produce a low-lag MAGnified Weighted Average (hence the name MAGic WAVe) - that enables me to better visualize how the momentum of the price move changes and when a change in trend is to be expected.
see link to the TA series below for more info.
- This simple concept can then be utilized in trading in a similar way to a basic MA Crossover approach, with the added benefit of the ability to magnify the trend moves
- you can also think of this as a MACD plotted on the price chart - in fact if you add a MACD to the chart and compare to the WAVe, you will see exactly what i mean.
What are the improvements in this new version
- better visualization, removed a lot of the clutter from previous versions
- the WAVe code was re-written to produce a "smoother" WAVe line.
note that the WAVe line in this version is also "lazier" than the previous version .. we need to set length to around 7 to match a 10 in v2 due to the increased lag caused by the smoothing.
- introduced the cloud fill to act as additional visual clue - introduced a WAVe "depth" variable - which will grow/shrink the fill area as preferred for improved visual.
- kept the optional slow EMA filter line set by default to 50EMA
here's a comparison of MAGic WAVe v3 (top panel) vs the older version (lower panel)
can be used with any timeframe and any instrument .. adjust settings as needed to suit the trader's own style.
- i'm not a big fan of alerts and always prefer "less signals" than "too many signals" in trading, so i don't think i will add alerts to this script in future.
Please feel free to use and comment. good luck!
Media mobile ponderata (WMA)
Yusram Mount MaV - Day MaV CrossOver Strgty
This indicator shows the comparison between the 7-day fast simple average and the monthly slow average of 5 bars. The red line indicates the monthly green and blue lines the daily average. If the Green-Blue line crosses the red upwards, it is a buy signal and the opposite is a sell signal. As soon as it turns green blue without waiting for the sell signal, a sell signal is created. If you are trading fast, you can consider turning green to blue as an opportunity. In the long run, the red intersection can be interpreted as a Stop point.
I hope it will be useful to everyone.
You can also find the strategy indicator with the same name.
I got the name of this indicator from my daughter's name. The meaning of the name Yüsra means "convenience". I hope this indicator will help you.Yüsram Mount HO - Day HO
Yusram Mount MaV - Day MaVYüsram Mount HO - Day HO
This indicator shows the comparison between the 7-day fast simple average and the monthly slow average of 5 bars. The red line indicates the monthly green and blue lines the daily average. If the Green-Blue line crosses the red upwards, it is a buy signal and the opposite is a sell signal. As soon as it turns green blue without waiting for the sell signal, a sell signal is created. If you are trading fast, you can consider turning green to blue as an opportunity. In the long run, the red intersection can be interpreted as a Stop point.
I hope it will be useful to everyone.
You can also find the strategy indicator with the same name.
I got the name of this indicator from my daughter's name. The meaning of the name Yüsra means "convenience". I hope this indicator will help you.
{Gunzo} Trend Sniper (WMA with coefficient)Trend Sniper is a trend-following indicator that sticks closer to the trend than others moving averages as it is using an upgraded weighted moving average implementation.
OVERVIEW :
It is typical to use a moving average indicator (SMA, EMA, WMA or TMA) to identify the trend of an asset. Standard moving averages indicators smooth the price and doesn’t stick very closely to the actual price, showing potential lagging information.
CALCULATION :
In order to have a trendline that sticks to the price, we are going to use a weighted moving average as it puts more weight on recent candles and less on past candles. The weight is usually calculated using the distance from current candle to the other candles used in the calculation. We have the following formula for the standard calculation as implemented in TradingView :
WMA_standard = (Price1 * Weight1 + …… + PriceN * WeightN)) / (Weight1 + …… + WeightN)
This “Trend Sniper” indicator uses an additional coefficient to alter even more the weight of each candle.
WMA_with_coefficient = (Price1 * (Weight1 - Coefficient) + …… + PriceN * (WeightN - Coefficient)) / ((Weight1 - Coefficient) + …… + (WeightN - Coefficient))
SETTINGS :
MA source : Source used for moving average calculation (ex : “close”)
MA length : Length of the moving average. Higher values will give a smoother line, lower values will give a more reactive line.
Use extra smoothing : Enable/disable usage of a EMA to extra smooth the line curve. If activated the indicator may be lagging, but it will also avoid many false buy/sell signals.
MA extra smoothing length : Length of the moving average of the extra smoothing.
Change candle colors : Enable/disable painting the candles of the chart with the colors of the weighted moving average.
Display buy/sell signals : Display buy/sell signals (circles) when the moving average is changing direction
VISUALIZATIONS :
This indicator has 3 possible visualizations :
Moving Average line : the line represents the weighted moving average that is following the price of the asset, when the line goes up we are in a uptrend (green line) when the line goes down we are in a downtrend (red line).
Candle coloring : the color of the moving average line can be applied to the candles of the chart for better readability.
Signals : Buy/Sell signals can be displayed at the bottom of the chart
USAGE :
This indicator can help analyze the trend directional changes :
First of all, if the moving average line is under the price (or above the price), then we can assume that the uptrend is strong (or downtrend is strong).
If the current candle crosses the moving average line, it is the first sign that the trend is weakening and possibly starting to revert.
If the weighted moving average is changing direction, then the trend change is confirmed and the color of the line changes
RSI-Trend FormationRSI Trend Formation uses RSI (9) along with 3 EMA and 21 WMA . 3 EMA and 21 WMA graphs have been plotted on RSI (9). RSI value above 50 will be considered as 'BUY' zone and RSI value below 50 will be considered as 'SELL' zone.
When 21 WMA ( Volume Strength) and 3 EMA (Price Strength) crosses RSI from above (that means both of these will go below RSI ), it is a Buy signal.
When 21 WMA ( Volume Strength) and 3 EMA (Price Strength) crosses RSI from below (that means both of these will go above RSI ), it is a Sell signal.
This is the best time of 3/5/15 min Time Frame for Intraday Traders..
(IK) Color Coded MAJust a simple Moving Average indicator. Choose between SMA, EMA, and WMA, set the length and the source. There are 3 color indicators that represent whether price is above or below the moving average:
- the moving average line itself
- the background of the chart (optional)
- the 'underglow' of price action (optional - set 'underglow strength' to 0 to turn off)
You can customize the colors
I wasn't planning on publishing this, because, again, it doesn't really do anything special, but I've been using it for a little bit now in place of regular MAs, and I really dig the visual effect of the underglow, so I thought I'd share.
Feel free to steal/modify this.
Erzurum Indicators (By DadashKadir)Erzurum Indicators (By DadashKadir)
An indicator in which you will keep track of the buying and selling movements by adding the movements of the three moving averages together. The parameters were determined as Moving Average (SMA), Exponential Moving Average (EMA), Weighted Moving Average (WMA) and Volume Weighted Moving Average (VWMA). Its constant value was taken as WMA. It is used to calculate the averages of 3 - 5 and 7. You can include the standard deviation (STDEV) in these moving averages.
The name of the indicator is taken from our city of Erzurum, the pearl of Eastern Anatolia.
MA Crossover Strategy with MA Turning Point Exits + ADX filterThis strategy is based upon @rthomson's MA Crossover Strategy with MA Turning Point Exits.
I just added an ability to filter out entries when ADX < 20. In fact you have a choice to set this ADX threshold value.
In a sideways market, the MA crossovers end up in yielding entry trades with losses. ADX value around 20 to 25 indicates a sideway market. By introducing ADX threshold, we are trying to prevent potential loss making entries.
MA Crossover Strategy with MA Turning Point Exits + ADX filterThis strategy uses @rthomson's "MA Crossover Strategy with MA Turning point Exits" and combines it with ADX.
This strategy filters out any entries where ADX < 20. In fact you can set the value for ADX threshold. (Generally value under 20 for ADX is considered as non trend zone)
Funding Rate for FTX:BTCPERP (estimated) v0.1 Original credits goes to @Hayemaker, and @NeoButane for the TWAP portions of this script
By @davewhiiite, 2021-03-27
Version 0.1
Summary: The funding rate is the interest charged / credited to a perpetual futures trader for taking a long or short position. The direction of the funding rate is used as an indicator of trader sentiment (+ve = bullish; -ve = bearish), and therefore useful to plot in real time.
The FTX exchange has published the calculation of their funding rate as follows:
TWAP((future - index) / index) / 24
The formula here is the same, but expresses it in the more common % per 8hr duration:
funding = TWAP((future / index) - 1) * (8 / 24) * 100
For reference: future refers to the FTX bitcoin futures contract price (FTX:BTCPERP) and index is the spot price of bitcoin on the exchange (FTX:BTCUSD)
Additional notes:
Probably best to add to the indicator to a new pane, or as secondary axis
Plot this in combination with FTX:BTCPERP or FTX:BTCUSD, or chart of your choice to complement your bitcoin dashboard
Compare to funding rates published on ViewBase
questions? Ask me!
Reivaj MA - PreSession This script contains 9 moving averages which can be changed each between "sma", "ema", "wma", "vwma.
The values of the moving averages are:
MMA20 = SMA20
MMA50 = SMA50
MMA100 = SMA100
MMA200 = SMA200
MMA300 = SMA300.
MMAextra1 = ema 8
MMAextra2 = ema21
MMAextra3 = sma400
MMAextra4 = sma500.
It has an Asian range that goes from 21: 00-07: 00 UTC which turns the color of the candle in green.
And pre-sessions that is one hour before the opening, the time of the opening and the hour after the opening of London and New York.
RR 3Software signal with a combination of Moving Average, Exponential Average, Hull Average, Volume weighted best combined with RR 1 & 2
NOTE: RR 3 is in beta Stage will update it once it is Final
Customizable MA RibbonAll credits to @Violent (www.tradingview.com) for making the original code! I just updated it by adding new features and themes!
---------------------------------------------
Lemon's Customizable MA Ribbon:
---------------------------------------------
A series of moving averages of different lengths that create a ribbon-like indicator. Traders can determine trend strength by lookin at the distance between the moving averages and the overall balance of the colored lines. Price movements through the ribbon can also be used to identify trend changes.
------------
FEATURES
------------
MA TYPES: SMA , EMA , WMA, RMA, ALMA, VWMA, HMA
Editable length
Editable start
User defined number of plots to show (between 1 to 32 total plots)
Multiple color theme choices
A color smoothing option.
Thank you and happy trading!
with love,
-Lemon
Nirvana Trend ChannelThere are two kinds of channels involved in this indicator: the trend channel and momentum channel.
When the two channels are up, consider buying.
When the trend is up but the momentum is sideways or down, just wait, if the price comes back, above the momentum channel, you can buy.
When the two channels are sideways, don't trade.
When the two channel are down, consider selling.
When the trend is down but the momentum is sideways, just watch and wait, when the price goes below the momentum channel, sell.
When the trend is sideways and the momentum is down, don't trade.
Buying is the main option in an up trend and selling is the main option in a down trend.
The suggested timeframe for this indicator are 1H 4H 1D
Customization of this indicator:
You can change the color and the opacity of the channels
You can change the color of the labels, or hide it
Please send me private message if you need further tutorial or you want to get the authorization
Versions for Mate Trader 4, Mate Trader 5, and any other platform that supports custom indicators are available.
This script belongs to the author. If you need to use this indicator, you can send a private message to the author. You can also contact through the email in the signature information.
MA Multiplier with FibonacciThis implementation of the "2-Year MA Multiplier" gives you some control over the indicator, you can change the multiplier from it's default of 5, you can change the lookback from it's default of 730 days and I've also added three fibonacci traces between the moving average and it's multiple that you can play with. Oh and you can also choose the data source ('close' or 'hl2' make most sense).
The formula for this indicator was created by Philip Swift.
Thanks to @Pladizow for pointing me to this indicator.
Hilega Milega(by NK sir) - @AMPrice Volume Strength(PVS) Indicator script has been developed based on Nitish Kumar Sir's concepts. This script uses RSI(9) along with 3 EMA and 21 WMA . 3 EMA and 21 WMA graphs have been plotted on RSI (9). RSI value above 50 will be considered as 'BUY' zone and RSI value below 50 will be considered as 'SELL' zone.
When 21 WMA ( Volume Strength) and 3 EMA (Price Strength) crosses RSI from above (that means both of these will go below RSI), it is a Buy signal.
When 21 WMA ( Volume Strength) and 3 EMA (Price Strength) crosses RSI from below (that means both of these will go above RSI), it is a Sell signal.
Indicator EMA(20),SMA(100,150,200),VMA, Trader/Learner ModeBINANCE:XLMUSDT
This script contains two modes or environment of operation: Trader and Learner. Below, each mode of operation is explained.
Learner Mode
In Learner mode (Settings -> Enviroment Learner), you can see pivot points with floats values, color change for high bars, ema/ sma cross movements with vertical lines and texts (Golden Cross, Death Cross, Upward movement, Downward movement), green bar over red bar and ema 20 support (ENTRY POINT), trend arrows and supports / resistances.
Trader Mode
In Trader mode (Settings -> Enviroment Trader), you can see pivot points with triangle shaped, color change for high bars, ema/ sma cross movements with vertical lines, green bar over red bar and ema 20 support (ENTRY POINT).
MA, MATR, ChEx | All in One - 4CR CUPIn trade position setup, we always need to determine the market structure and manage the position sizing in a short period of decision time. Indicators such as moving average, initial stop loss and trailing stop loss are always helpful.
This indicator put all these handy tools into a single toolkit, which includes the following price action and risk management indicators:
MA - Moving Average
MATR - Moving Average less Average True Range
ChEx - Chandelier Exit
This script further enhances the setting so that you can easily customize the indicators.
For both the Moving Averages and the Moving Average less Average True Range , you can pick a type of moving average which suits your analysis style from a list of commonly used moving average formulations: namely, EMA , HMA , RMA, SMA and WMA , where EMA is selected as default.
The Moving Average less Average True Range , MATR, is usually applied as a reference to set the initial stop loss whenever opening a new position.
The abbreviation, MATR, is picked, so that this can serve as a handy reminder of a very good trading framework as elaborates as below:
M – Market Structure
A – Area of Value
T – Trigger
R – Risk Management (aka. Exit Strategy)
Intraday VWAP weighted averaged KAMA BandsFor Intraday trading!
This indicator helps in figuring out the directivity as well as optimum entry criteria in an Intraday Trade
Most of the times in market,
it makes a good sense for any trader to have a particular bias, the indicator helps provide biases with the potential target bands
Explore it and come up with your own explanation! The indicator is self intuitive
Buy when Blue price tracker line appears
Sell when Orange price tracker line appears
Target the just next band line! or Pivot
Which timeframes it works best ?
It is designed for 1 minute
Fancy Bollinger Bands Strategy [BigBitsIO]This script is for a Bollinger Band type indicator with built-in TradingView strategy including as many features as I can possibly fit into a Bollinger Band type indicator including a wide variety of options to create the most flexible Bollinger Bands strategy possible.
Features:
- A single custom moving average serving as the middle band.
- Standard MA inputs.
- MA type.
- MA period.
- MA price.
- MA resolution (time frame).
- Visibility toggle.
- MA Candle Type
- Fancy MA inputs.
- Toggle to show only candles included in the MA calculation ("Highlight inclusion") or display entire MA history.
- Toggle to show a ghost trail when Highlight inclusion is toggled on. Displays a shaded version of past MA history before the inclusion period (as seen on snapshot).
- Toggle to show forecast values for the MA.
- Other inputs related to forecasting:
- Forecast bias. (Neutral forecasts MA if the current price remains the same.)
- Forecast period.
- Forecast magnitude.
- Toggle showing details on the screen
- Toggle the visibility of the fill between the upper and lower bands.
- Toggle to use ATR instead of the standard deviation to calculate the location of the upper and lower bands.
- Custom input for the ATR period.
Strategy Features
-Strategy Window - only test during this window
-Take Profit and Stop Loss
-Open and Close conditions, including condition counts and any/all requirements
-Many conditions to choose from that can either be selected to open, close or open and close a position
-Conditions include:
-Price crossing above/below the Upper, Middle, or Lower bands
-Price being above/below the Upper, Middle, or Lower bands
-Bollinger Band width crossing or being above/below custom values
-Percent B crossing or being above/below custom values
This script may contain errors, or out of date code. Please be mindful of updates to the script.
*** DISCLAIMER: For educational and entertainment purposes only. Nothing in this content should be interpreted as financial advice or a recommendation to buy or sell any sort of security or investment including all types of crypto. DYOR, TYOB. ***
MavilimW Strategy MTF EMA with HA CandlesThis is a strategy adapted initially for Mavilim moving average indicator, based on WMA MA.
It seems to works amazingly on long term markets, like stocks, some futures, some comodities and so on.
In this strategy, I form initially the candle, using EMA values, so I take the EMA of last 50 closes, open, highs and lows and form the candle
After this I take interally HA and convert the EMA candle to HA.
Then using the moving averages on multiple timeframes, like in this example we have a chart on 4h, but I use 1h and 1d moving averages.
For long condition we have : close is above moving average timeframe1 and oving average timeframe2 and oving average timeframe3
Initially short would be close below ma timeframe1, ma timeframe2 and timeframe3 -> but here I also convert it into a long signal.
So we actually go only long .
And we have 2 different exits : for first long if we have a crossdown of 1h ma with 1 day ma, and for second long if we have a cross up of 1h ma with 1 day ma in this example.
Message me if you have any questions about this strategy.
Fib Cross Moving AveragesThe white line is the main 200-candle MA. The fibonacci ratio MAs are relative to that 200-day MA. Some lines change color based on the trend shown by this indicator.
So 61.8% for example, the orange/red line golden ratio MA is a 124 candle MA (~68% of 200). There is also a weighted 124 candle MA that works along-side the 100 candle MA.
My BTST RSI MACD X-BODYMy trial of script base on EMA , RSI and MACD to filter the best Candle which has likely hood of uptrend in a practice of " Buy Today Sell Tomorrow".
Blue candle : 40 to 70 % RSI
Orange candle > 80 % RSI
Yellow candle < 30 % RSI - buy and can hold
Lime candle buy above MACD line.
Also i added the label when 2 EMAs and SMA cross each other in solid body candle.
Buy on Blue, Lime.
Buy and hold on Yellow candle.
Good luck!