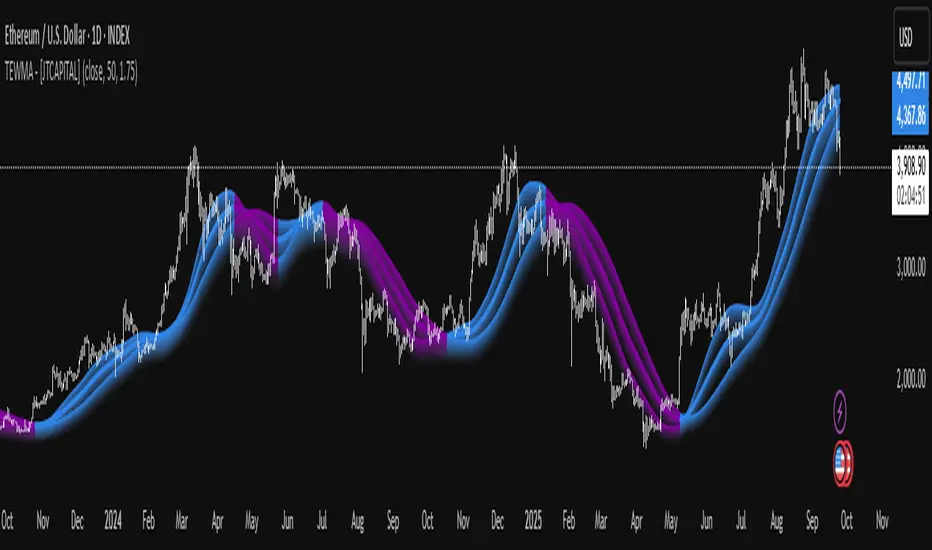
Flush Percent RangeFans of Woodies CCI may recognize the approach to this one. This is my attempt at using the same methods but for taking the highs and lows into account without the standard deviation of the CCI. The smoothness of other oscillators may not be ideal however the Williams Percent Range is a fast stochastic that also operates within a channel. This provides an alternative yet still complex view for the virtuoso. A unique feature is total utilization of the weighted moving average, from the standard to the more complex. A fun fact is the Hull Moving Average is actually calculated using weighted moving averages.
How to use:
The base length is for accuracy, the fast length is for catching all the moves(even the wrong ones sometimes.)
The bars back option will not flip the histogram/base trend to its bullish/bearish alternative until the base plot remains on the latter half of the oscillator for a certain number of bars. This can be set to zero if desired.
The factor controls the chop on the various levels. A higher number will increase it.
The oscillator levels are measuring slope, price relative to the average, and a summation of percent changes between the two. Both the baseline/histogram and the levels have color coding for bullishness, bearishness, and indecision(depending on the factor.) The fast line matches the indecision color by default. This is all customizable.
There are many potential ways to trade with this indicator. From hooks back toward the trend and range line crossovers to divergence and reversals. It's important to note the current performance of the oscillator levels. Time cycles may come in handy along with other forecasting tools.
Lastly, there are optional linear regression lines plotted on the chart. They're synchronized to the lengths in the oscillator. This is an additional visual aid to provide context to the direction of the channel.
Overall the Flush Percent Range is for analyzing multiple regression models within a single price channel. No smoothing, fast averages, and specified timeframes of highs/lows. Credit to Larry Williams for the original calculation and Ken Woods for design/methodology inspiration.
Media mobile ponderata (WMA)
Bitcoin Trend Indicator█ Overview
The Trend Indicator script is designed to help traders identify the direction and strength of momentum in the price of a digital asset. By using historical price data, it calculates and provides daily signals indicating whether the asset is in an uptrend, downtrend, or no trend at all. The script can be applied to various cryptocurrencies, such as Bitcoin and Ether, using their respective price charts.
█ Key Concepts and Calculation Methodology
For calculations, the script uses the 180 most recent candles.
The Trend Indicator is calculated based on four moving average pairs (MAPs), which compare shorter-term and longer-term moving averages of the asset's price.
The moving averages are exponentially weighted, meaning more recent prices have a greater impact on the average than older prices. The half-life of the moving averages determines the weight decay.
The script uses the following moving average pairs:
1-day vs. 5-day
2.5-day vs. 10-day
5-day vs. 20-day
10-day vs. 40-day
█ Calculation Steps
Exponentially Weighted Moving Averages (EWMA):
Each moving average is calculated using an exponential decay factor and a normalization factor to adjust for the fixed window of 180 observations.
Component Inputs:
For each moving average pair, the script compares the shorter-term moving average to the longer-term moving average. If the shorter-term average is greater than or equal to the longer-term average, the component input is +1 (indicating an uptrend). If it is less, the input is -1 (indicating a downtrend).
Trend Indicator Value:
The script averages the four component inputs to produce a final value ranging from -1 to +1, representing the trend's direction and strength:
+1: Significant uptrend
+0.5: Uptrend
0: No trend
-0.5: Downtrend
-1: Significant downtrend
█ Learn More
For more information about the Bitcoin Trend Indicator and other trading tools, please visit my TradingView profile. Feel free to reach out with any questions or feedback.
Uptrick: Complex WMA Indicator with Trend Transitions
The "Complex WMA Indicator with Trend Transitions" is a technical analysis tool designed to help traders identify and visualize market trends using three Weighted Moving Averages (WMAs) of varying lengths. The primary purpose of this indicator is to provide a clearer and more nuanced view of market trends by highlighting bullish and bearish phases and filtering out noise, thereby enabling more informed trading decisions.
Detailed Explanation
This indicator allows users to set the lengths of three WMAs through input parameters. The default lengths are set to 10, 20, and 50, but users can customize these values according to their trading strategy. The WMAs are calculated using the closing prices of the specified periods, and the results are plotted on the chart in red, green, and blue, corresponding to the first, second, and third WMAs, respectively.
The indicator defines two primary conditions for trend analysis: bullish and bearish trends. A bullish trend is identified when both the shorter WMAs (first and second) are above the longest WMA (third), indicating upward momentum. Conversely, a bearish trend is identified when both the shorter WMAs are below the longest WMA, signaling downward momentum.
Crossover Signals and Trend Transitions
The script also identifies crossover signals between the first and second WMAs. A bullish crossover occurs when the first WMA crosses above the second WMA, generating a buy signal. This event is marked on the chart with a green upward label. A bearish crossover, marked with a red downward label, occurs when the first WMA crosses below the second WMA, indicating a sell signal.
To track the trend transitions effectively, the indicator employs a state machine. It maintains two variables, currentTrend and prevTrend, to store the current and previous trend states. The trend state is updated based on the defined trend conditions. When the trend changes from one state to another (e.g., from a bullish trend to a bearish trend), the indicator creates a label at the beginning of the new trend to mark this transition. This helps traders quickly recognize significant changes in market direction.
Visual Enhancements
The indicator enhances visual clarity by coloring the background of the chart based on the identified trend. When a bullish trend is detected, the background turns green, and when a bearish trend is identified, it turns red. The script ensures that only clear bullish and bearish trends are highlighted by excluding the "No Clear Trend" state, which reduces noise and prevents false signals.
Alerts
To further aid traders, the indicator includes alert conditions for both bullish and bearish crossovers. These alerts notify traders when a crossover occurs, enabling them to take timely action based on the identified signals.
Purpose and Unique Features
The primary purpose of the "Complex WMA Indicator with Trend Transitions" is to provide traders with a more precise and actionable analysis of market trends. Unlike simple moving average indicators, this tool uses multiple WMAs and incorporates a state machine to track and highlight trend transitions more effectively. By focusing on clear trend signals and filtering out noise, it helps traders make more informed decisions.
This indicator differs from other moving average-based tools in several ways:
Multi-WMA Analysis: It uses three WMAs of different lengths, providing a more comprehensive view of the market trend.
State Machine for Trends: The use of a state machine to track trend transitions ensures that only significant trends are highlighted, reducing noise.
Visual Clarity: The combination of colored backgrounds and labeled transitions makes it easier for traders to identify and act on trends.
Customization: Users can adjust the lengths of the WMAs to suit their trading strategies, making the indicator versatile.
In summary, the "Complex WMA Indicator with Trend Transitions" offers a sophisticated and customizable approach to trend analysis, providing clear visual cues and alerts for significant market movements, which sets it apart from simpler moving average indicators.
Weighted Moving Range with Trend Signals (WMR-TS)Weighted Moving Range with Trend Signals (WMR-TS)
Technical analysis involves analyzing statistical trends from trading activity , such as price movement and volume, to make trading decisions. Technical indicators are mathematical calculations based on the price, volume, or open interest of a security or contract. They are used by traders to analyze price movements and predict future market behavior. The WMR-TS indicator combines weighted moving averages and range calculations to identify key trading levels and generate buy/sell signals. It dynamically adjusts to market conditions, offering traders insights into potential support, resistance, and trend reversal points. Key levels are color-coded for quick interpretation. It utilizes weighted moving averages (WMA) and range calculations to determine these levels, making it a robust tool for both trending and ranging markets.
SUMMARY
Parameters :
WMA Length : Determines the length for the primary weighted moving average.
Highest High Length : Sets the period for calculating the highest high.
Lowest Low Length : Sets the period for calculating the lowest low.
Range Corrector : Adjusts the range calculation slightly for fine-tuning.
Top Level : Multiplier for determining the top level from the calculated range.
Bottom Level : Multiplier for determining the bottom level from the calculated range.
Levels Visibility : Sets how many recent bars will display the levels.
Trading Zones :
Short Area : Highlighted zone indicating potential shorting opportunities.
Long Area : Highlighted zone indicating potential buying opportunities.
The Levels :
Wave (Yellow): Midpoint of the calculated range, adjusted by WMA.
Top Level (Red): Calculated upper boundary of the trading range.
Sell Level (Pink): Intermediate sell level.
Resistance Level (Magenta): Immediate resistance level.
Support Level (Cyan): Immediate support level.
Buy Level (Light Green): Intermediate buy level.
Bottom Level (Dark Green): Calculated lower boundary of the trading range.
Interpreting the Signals :
Hammer Signal : Red circles above bars indicate potential sell signals.
Rocket Signal : Green circles below bars indicate potential buy signals.
KEY CONCEPTS
Highest High and Lowest Low :
These values represent the highest high ( HH ) and lowest low ( LL ) over a specified number of periods.
Support Level :
This is the lower boundary of the trading range. It is a price level where demand is strong enough to prevent the price from falling further. As the price approaches the support level, it is likely to bounce back up.
Resistance Level :
This is the upper boundary of the trading range. It is a price level where supply is strong enough to prevent the price from rising further. As the price approaches the resistance level, it is likely to pull back down.
THE USE OF MULTIPLIERS :
The script uses several multipliers to adjust and fine-tune the calculated support and resistance levels, as well as to control the range and sensitivity of these levels. Here is a detailed explanation of these multipliers and their purpose:
Range Corrector : This multiplier adjusts the calculated high ( H ) and low ( L ) levels, adding flexibility to how these levels are positioned relative to the highest high and lowest low. It ranges from -1 to 1 , with a default value of 0 . The use of positive values increase the range, making the calculated levels further apart. Thus, using negative values decrease the range, bringing the calculated levels closer together.
Top Level : This multiplier adjusts the distance of the top level from the calculated high H ) level. It fluctuates from 0 to 2 , with a default value of 0.382 . Higher values will push the top level further above the high level, while lower values will bring it closer.
Bottom Level : This multiplier adjusts the distance of the bottom support level from the calculated low support level. Ranging from 0 to 2, with a default value of 0.214, the higher values will push the bottom level further below the low level, while lower values will bring it closer.
The script plots the support and resistance levels on the chart, allowing traders to visualize the trading range. Color-coded zones are used to indicate areas where buying or selling opportunities may arise based on the current price relative to the trading range. A trading range refers to the area between a price's support and resistance levels over a specific period of time. Within this range, the price of the security fluctuates up and down but does not break out above the resistance or below the support. Support and resistance levels to make trading decisions. Buying near the support level and selling near the resistance level is a common strategy. When the price moves above the resistance level, it is called a breakout . A breakout often indicates that the price may start a new upward trend . Conversely, when the price moves below the support level, it is called a breakdown . A breakdown often indicates that the price may start a new downward trend . By understanding and utilizing trading ranges, traders can make more informed decisions, optimize their trading strategies, and manage risk more effectively.
Understanding Moving Averages
A moving average (MA) is a widely used technical indicator that helps smooth out price data by creating a constantly updated average price. The main purpose of using a moving average is to identify the direction of the trend and to reduce the "noise" of random price fluctuations. The Weighted Moving Average ( WMA ) assigns different weights to each period, with more recent periods typically given more weight. A 10-day WMA might give the most recent day a weight of 10, the second most recent day a weight of 9, and so on. It is useful for traders who want to emphasize recent price data more than older data. When the price is above the moving average, it suggests an Bullish trend . A Bearish Trend is expected to take place when the price is below the moving average. Understanding the price reactions around these levels can be used to make trading decisions.
APPLYING CONCEPTS
Support and Resistance Calculations in the Script :
The script calculates dynamic support and resistance levels using weighted moving averages ( WMA s) and the highest high and lowest low over specified periods. Buy ( Rocket ) and sell ( Hammer ) signals are generated based on the crossing of the price with calculated top and bottom levels.These signals help traders identify potential entry and exit points within the trading range .
Weighted Moving Average (WMA) Application in the Script
This script calculates a special trendWMA using the close price that helps in creating a more dynamic moving average that considers both high and low price actions. This modified WMA is used in conjunction with highest high and lowest low values over specified periods to calculate dynamic support and resistance levels.
Explanation of the Levels in the Script
By understanding these levels, traders can make more informed decisions about where to enter and exit trades, manage risk, and anticipate potential market movements. The script incorporates several key levels levels that traders can use to better anticipate price movements and make more informed trading decisions. Leveraging the principles of Fibonacci retracement ratios ( 23.6%, 38.2%, 50%, 61.8%, and 100% ) to identify key support and resistance zones can also serve for gauging the overall market sentiment.
Top Level and Sell Leve l: Used to identify potential resistance zones where the price may reverse or pause.
Support Level and Buy Level : Used to identify potential support zones where the price may bounce.
Upper and Lower Pivot Values : Serve as intermediate levels for possible price retracements or extensions within the trading range.
Wave Level : Indicates the central trend direction, which can be useful for gauging the overall market sentiment.
Alerts are a crucial part of the script as they notify traders of potential buy and sell signals based on predefined conditions. There are two main alerts: one for a " Hammer " signal (sell condition) and one for a " Rocket " signal (buy condition).
Adjust the input parameters to fit your trading style and the specific asset being analyzed. Shorter lengths may be more responsive to price changes but can produce more false signals , while longer lengths provide smoother signals but may lag . Always backtest the indicator on historical data to understand its behavior and performance. Also remember that different markets may require different parameter settings for optimal performance.
Keep in mind that by nature like all moving averages, WMAs lag behind price action. This means that signals may be delayed. The indicator performs differently in various market conditions. Always consider the overall market context when interpreting signals.
Adjusting parameters like the range corrector and visibility can help tailor the indicator to specific market conditions or trading strategies, improving its effectiveness. The script uses the calculated levels to plot lines and fill zones on the chart, helping traders visualize potential support, resistance, and trend reversal points. The use of multipliers allows for dynamic adjustment of these levels, making the indicator flexible and adaptable to different market conditions.
I think traders can make more informed decisions about where to enter and exit trades, manage risk, and anticipate potential market movements following this code. Stay safe and always remember that market is always changing. Use this tool if you want, please stay informed and plan safe trades,
D.
MarketRangerThis indicator puts a selection of elements together providing traders with insights into price dynamics, trend changes, and potential trading opportunities within the specified timeframe.
Trading Range Defined by Support and Resistance :
Support and resistance levels are calculated using the lowest low and highest high over specified periods.
These
levels define the boundaries of the trading range within which the price moves.
WMA Color Changing based on Slope :
The script uses three Weighted Moving Averages (WMAs) with different lengths.
The color of the main WMA changes based on its slope.
When the slope of the WMA is positive (indicating an uptrend), it's displayed in blue. When it's
negative (indicating a downtrend), it's displayed in pink.
New High/Low Detection :
The script detects new highs and lows in the price action.
A new high is detected when the current high crosses under the previous resistance level, and a new low is detected when the current low crosses over the previous support level.
These
detections are marked by triangle shapes above or below the bars.
WMA Crosses :
The script calculates the difference between the two WMAs.
When the faster WMA crosses above the slower WMA, indicating a potential bullish signal, a blue cross shape is plotted below the bar.
When the faster WMA crosses below the slower WMA, indicating a potential bearish signal, a
pink cross shape is plotted above the bar.
Slope Changes :
The script calculates the slope of the main WMA and tracks changes in slope.
A positive slope indicates an upward trend, while a negative slope indicates a downward trend.
Slope changes from negative to positive indicate potential bullish momentum, and from
positive to negative indicate potential bearish momentum.
Customizable Pivot Levels :
Pivot levels are calculated based on user-defined percentages of the range between support and resistance.
Pivot Level 1 and Pivot Level 2 provide additional reference points for potential reversals or trend continuation.
Usage :
The indicator provides support and resistance levels, new high/low alerts, and WMA crosses.
The midpoint and customizable pivot levels offer potential trading zones.
Slope change points indicate potential shifts in market sentiment.
Customize the pivot levels according to your trading strategy.
Parameters :
Adjust the WMA lengths and support/resistance lengths to suit your trading style.
Modify the visibility settings to control how many periods of support and resistance are displayed.
Customize the pivot levels to fit your preferred trading strategy.
Alerts :
Alerts are triggered for new high/low points and WMA crosses.
Use alerts to stay informed about potential trading opportunities.
Interpretation :
Watch for new high/low points for potential trend reversals or continuations.
Monitor WMA crosses and slope changes for signals of market direction.
Consider trading near support/resistance levels and pivot points.
Additional Notes :
Experiment with different settings to find the configuration that best suits your trading preferences.
Backtest the indicator on historical data to validate its effectiveness before using it in live trading.
F.B_Double Hull Moving Average Trend TrackerThe F.B_Double Hull Moving Average Trend Tracker indicator is designed to identify market trends and is based on two Hull Moving Averages.
The "Hull Moving Average" (HMA) is a fast and smooth moving average that exhibits a rather unique behavior. The HMA attempts to completely remove lag while simultaneously presenting smoother results.
The first derivative is calculated for each HMA 1 and HMA 2.
If HMA 1 derivative > 0 and HMA 2 derivative > 0, then color the HMA lines and bar color green.
If HMA 1 derivative < 0 and HMA 2 derivative < 0, then color the HMA lines and bar color red.
If the slope of the derivative is different between HMA 1 and HMA 2, then color the HMA lines and bar color gray.
Meaning of colors:
Green ⇒ Uptrend
Gray ⇒ Price consolidation, trend weakness, or correction
Red ⇒ Downtrend
Best used in conjunction with additional indicators.
Moving Average Crossover MonitorMoving Average Crossover Monitor: Gain Insight into Market Trends
The Moving Average Crossover Monitor is a specialized tool crafted for traders seeking to understand and predict market trends more effectively. This indicator's primary focus lies in analyzing consecutive candle movements above or below specified moving averages and providing predictive estimates based on historical data.
Key Features:
1. Consecutive Candle Tracking: The indicator meticulously counts and tracks the number of consecutive candles that close above or below a selected moving average (MA1). This tracking offers a tangible measure of trend persistence over time.
2. Historical Analysis for Future Prediction: By analyzing past trends, the indicator provides insights into potential future movements. It estimates the likelihood of upcoming candles continuing above or below the moving average based on historical patterns.
3. Dynamic Visualization: Moving averages (SMA, WMA, EMA) are dynamically plotted on the chart, clearly displaying crossover points and trend transitions.
How It Works:
1. Moving Average Calculation: Select your preferred moving average type (SMA, WMA, EMA) and define short and long periods. The indicator computes two moving averages (MA1 and MA2) based on these parameters.
2. Consecutive Candle Analysis:
- Above MA1: Tracks and counts consecutive candles closing above MA1, indicating potential bullish momentum.
- Below MA1: Tracks and counts consecutive candles closing below MA1, suggesting potential bearish sentiment.
3. Future Trend Prediction: Based on historical data of consecutive candle movements, the indicator estimates the likelihood of the next candle continuing in the same direction (above or below MA1).
Advantages for Traders:
1. Quantitative Insights: Use numerical data on consecutive candles to gauge trend strength and durability.
2. Predictive Analytics: Leverage historical patterns to anticipate future market movements and adjust trading strategies accordingly.
3. Decision Support Tool: Gain clarity on trend transitions, empowering timely and informed trading decisions.
Disclaimer:
This indicator is provided for educational purposes only and should not be considered as financial advice. Trading involves risks, and past performance is not indicative of future results. Traders should conduct their own analysis and exercise caution when making trading decisions based on any indicator or tool. Always consider risk management strategies and consult with a qualified financial advisor if needed.
Strategy Container_Variable Pyramiding & Leverage [Tradingwhale]This is a strategy container . It doesn’t provide a trading strategy. What it does is provide functionality that is not readily available with standard strategy ’shells.’
More specifically, this Strategy Container enables Tradingview users to create trading strategies without knowing any Pine Script code .
Furthermore, you can use most indicators on tradingview to build a strategy without any coding at all, whether or not you have access to the code.
To illustrate a possible output in the image (buy and sell orders) of this strategy container, we are using here an indicator that provides buy and sell signals, only for illustration purposes. Again, this is a strategy container, not a strategy. So we need to include an indicator with this published strategy to be able to show the strategy execution.
What can you do with this strategy container? Please read below.
Trade Direction
You can select to trade Long trades only, Short trades only, or both, assuming that whatever strategy you create with this container will produce buy and sell signals.
Exit on Opposite
You can select if Long signals cause the exit of Short positions and vice versa. If you turn this on, then a sell/short signal will cause the closing of your entire long position, and a buy/long signal will cause the closing of your entire short position.
Use external data sources (indicators) to (a) import signals, or (b) create trading signals using almost any of the indicators available on Tradingview.
Option 1:
When you check the box ‘Use external indicator Buy & Sell signals?’ and continue to select an external indicator that plots LONG/BUY signals as value '1' and SHORT/SELL signals as value '-1, then this strategy container will use those signals for the strategy, in combination with all other available settings.
Here an example of code in an indicator that you could use to import signals with this strategy container:
buy = long_cond and barstate.isconfirmed
sell = short_cond and barstate.isconfirmed
//—------- Signal for Strategy
signal = buy ? 1 : sell ? -1 : 0
plot(plot_connector? signal : na, title="OMEGA Signals", display = display.none)
Option 2:
You can create buy/long and sell/short signals from within this strategy container under the sections called “ Define 'LONG' Signal ” and “ Define 'SHORT' Signal .”
You can do this with a single external indicator, by comparing two external indicators, or by comparing one external indicator with a fixed value. The indicator/s you use need to be on the same chart as this strategy container. You can add up to two (2) external indicators that can be compared to each other at a time. A checkbox allows you to select whether the logical operation is executed between Source #1 and #2, between Source # 1 and an absolute value, or just by analyzing the behavior of Source #1.
Without an image of the strategy container settings it’s a bit hard to explain. However, below you see a list of all possible operations.
Operations available , whenever possible based on source data, include:
- "crossing"
- "crossing up"
- "crossing down"
- "rejected from resistance (Source #1) in the last bar", which means ‘High’ was above Source #1 (resistance level) in the last completed bar and 'Close' (current price of the symbol) is now below Source #1" (resistance level).
- "rejected from resistance (Source #1) in the last 2 bars", which means ‘High’ was above Source #1 (resistance level) in one of the last two (2) completed bars and 'Close' (current price of the symbol) is now below Source #1" (resistance level).
- "rejected from support (Source #1) in the last bar" --- similar to above except with Lows and rejection from support level
- "rejected from support (Source #1) in the last 2 bars" --- similar to above except with Lows and rejection from support level
- "greater than"
- "less than"
- "is up"
- "is down"
- "is up %"
- "is down %"
Variable Pyramiding, Leverage, and Pyramiding Direction
Variable Pyramiding
With this strategy container, you can define how much capital you want to invest for three consecutive trades in the same direction (pyramiding). You can define what percentage of your equity you want to invest for each pyramid-trade separately, which means they don’t have to be identical.
As an example: You can invest 5% in the first trade let’s call this pyramid trade #0), 10% in the second trade (pyramid trade #1), and 7% in the third trade (pyramid trade #2), or any other combination. If your trading strategy doesn’t produce pyramid trading opportunities (consecutive trades in the same direction), then the pyramid trade settings won’t come to bear for the second and third trades, because only the first trade will be executed with each signal.
Leverage
You can enter numbers for the three pyramid trades that are combined greater than 100%. Once that is the case, you are using leverage in your trades and have to manage the risk that is associated with that.
Pyramiding Direction
You can decide to scale only into Winners, Losers, or Both. Pyramid into a:
- Losers : A losing streak occurs when the price of the underlying security at the current signal is lower than the average cost of the position.
- Winners : A winning streak occurs when the price of the underlying security at the current signal is higher than the average cost of the position.
- Both means that you are selecting to scale/pyramid into both Winning and Losing streaks.
Other Inputs that influence signal execution:
You can choose to turn these on or off.
1. Limit Long exits with a WMA to stay longer in Long positions: If you check this box and enter a Length number (integer) for the WMA (Weighted Moving Average), then Long positions can only be exited with short signals when the current WMA is lower than on the previous bar/candle. Short signals sometimes increase with uptrends. We’re using this WMA here to limit short signals by adding another condition (WMA going down) for the short signal to be valid.
2. Maximum length of trades in the number of candles. Positions that have been in place for the specified number of trades are excited automatically.
3. Set the backtest period (from-to). Only trades within this range will be executed.
4. Market Volatility Adjustment Settings
- Use ATR to limit when Long trades can be entered (enter ATR length and Offset). We’re using the 3-day ATR here, with your entries for ATR length and offset. When the 3-day ATR is below its signal line, then Long trades are enabled; otherwise, they are not.
- Use VIX to limit when Short trades can be entered (enter VIX). If you select this checkbox, then Short trades will only be executed if the daily VIX is above your set value.
- Use Momentum Algo functions to limit Short trades. This uses the average distance of Momentum Highs and Lows over the lookback period to gauge whether markets are calm or swinging more profoundly. Based on that you can limit short entries to more volatile market regimes.
Set:
- Fast EMA and Slow EMA period lengths
- Number of left and right candles for High and Low pivots
- Lookback period to calculate the High/Low average and then the distance between the two.
The assumption here is that greater distances between momentum highs and lows correlate positively with greater volatility and greater swings in the underlying security.
Stop-Loss
Set separate stop-losses based on % for Long and Short positions. If the position loses X% since entry, then the position will be closed.
Take-Profit
Set separate take-profit levels based on % for Long and Short positions. If the position wins X% since entry, then the position will be closed.
Volatility Adjusted Weighted DEMA [BackQuant]Volatility Adjusted Weighted DEMA
The Volatility Adjusted Weighted Double Exponential Moving Average (VAWDEMA) by BackQuant is a sophisticated technical analysis tool designed for traders seeking to integrate volatility into their moving average calculations. This innovative indicator adjusts the weighting of the Double Exponential Moving Average (DEMA) according to recent volatility levels, offering a more dynamic and responsive measure of market trends.
Primarily, the single Moving average is very noisy, but can be used in the context of strategy development, where as the crossover, is best used in the context of defining a trading zone/ macro uptrend on higher timeframes.
Why Volatility Adjustment is Beneficial
Volatility is a fundamental aspect of financial markets, reflecting the intensity of price changes. A volatility adjustment in moving averages is beneficial because it allows the indicator to adapt more quickly during periods of high volatility, providing signals that are more aligned with the current market conditions. This makes the VAWDEMA a versatile tool for identifying trend strength and potential reversal points in more volatile markets.
Understanding DEMA and Its Advantages
DEMA is an indicator that aims to reduce the lag associated with traditional moving averages by applying a double smoothing process. The primary benefit of DEMA is its sensitivity and quicker response to price changes, making it an excellent tool for trend following and momentum trading. Incorporating DEMA into your analysis can help capture trends earlier than with simple moving averages.
The Power of Combining Volatility Adjustment with DEMA
By adjusting the weight of the DEMA based on volatility, the VAWDEMA becomes a powerful hybrid indicator. This combination leverages the quick responsiveness of DEMA while dynamically adjusting its sensitivity based on current market volatility. This results in a moving average that is both swift and adaptive, capable of providing more relevant signals for entering and exiting trades.
Core Logic Behind VAWDEMA
The core logic of the VAWDEMA involves calculating the DEMA for a specified period and then adjusting its weighting based on a volatility measure, such as the average true range (ATR) or standard deviation of price changes. This results in a weighted DEMA that reflects both the direction and the volatility of the market, offering insights into potential trend continuations or reversals.
Utilizing the Crossover in a Trading System
The VAWDEMA crossover occurs when two VAWDEMAs of different lengths cross, signaling potential bullish or bearish market conditions. In a trading system, a crossover can be used as a trigger for entry or exit points:
Bullish Signal: When a shorter-period VAWDEMA crosses above a longer-period VAWDEMA, it may indicate an uptrend, suggesting a potential entry point for a long position.
Bearish Signal: Conversely, when a shorter-period VAWDEMA crosses below a longer-period VAWDEMA, it might signal a downtrend, indicating a possible exit point or a short entry.
Incorporating VAWDEMA crossovers into a trading strategy can enhance decision-making by providing timely and adaptive signals that account for both trend direction and market volatility. Traders should combine these signals with other forms of analysis and risk management techniques to develop a well-rounded trading strategy.
Alert Conditions For Trading
alertcondition(vwdema>vwdema , title="VWDEMA Long", message="VWDEMA Long - {{ticker}} - {{interval}}")
alertcondition(vwdema<vwdema , title="VWDEMA Short", message="VWDEMA Short - {{ticker}} - {{interval}}")
alertcondition(ta.crossover(crossover, 0), title="VWDEMA Crossover Long", message="VWDEMA Crossover Long - {{ticker}} - {{interval}}")
alertcondition(ta.crossunder(crossover, 0), title="VWDEMA Crossover Short", message="VWDEMA Crossover Short - {{ticker}} - {{interval}}")
Thus following all of the key points here are some sample backtests on the 1D Chart
Disclaimer: Backtests are based off past results, and are not indicative of the future.
INDEX:BTCUSD
INDEX:ETHUSD
BINANCE:SOLUSD
Four WMA Strategy with TP and SLBasically I read a research paper on how they used different moving averages for long entries and short entries, and it kind of dawned on me that I always used the same one for long entry or exit, or even swing trading. So I smashed this together to see what would happen.
The strategy combines the use of four different WMAs for identifying trade entry points, along with a predefined take profit (TP) and stop loss (SL) for risk management. Here's a detailed description of its features and how it operates:
Main Features
1. **WMAs as the Core Indicator**:
- The strategy uses four WMAs with different lengths. Two WMAs (`longM1` and `longM2`) are used for long entry signals, and the other two (`shortM1` and `shortM2`) for short entry signals.
- The lengths of these WMAs are adjustable through input parameters.
2. **Trade Entry Conditions**:
- A long entry is signaled when the shorter WMA crosses under the longer WMA .
- Conversely, a short entry is signaled when the shorter WMA crosses under the longer WMA.
3. **Take Profit and Stop Loss**:
- The strategy includes a take profit and stop loss mechanism.
- The TP and SL levels are set as a percentage of the entry price, with the percentage values being adjustable through input parameters.
4. **Visual Representation**:
- The WMAs are plotted on the chart for visual aid, each with a distinct color for easy identification.
How It Works
- The strategy continuously monitors the crossing of WMAs to detect potential entry points for long and short positions.
- Upon detecting a long or short condition, it automatically enters a trade and sets the corresponding TP and SL levels based on the current price and the specified percentages.
- The strategy then actively manages the trade, exiting the position when either the TP or SL level is reached.
Drawbacks
- **Overreliance on WMAs**: The strategy heavily relies on WMAs for trade signals. While WMAs are useful for identifying trends, they might not always provide timely entry and exit signals.
- **Market Conditions**: It may not perform well in highly volatile or sideways markets where WMA crossovers could lead to false signals.
- **Risk Management**: The fixed percentage for TP and SL might not be suitable for all market conditions. Traders might need to adjust these values frequently based on market volatility and their risk tolerance.
Apparently I need to emphasize to use brains when using indicators and setting them up to achieve the results you can or want. Also risk of 12% is considered very high so I lowered the numbers to 5%, which tanked the profits, try adjusting them on your own. Check the properties settings for more info on comission and slippage.
Conclusion
The "Four WMA Strategy with TP and SL" is suitable for traders who prefer a moving average-based approach to trading, combined with a straightforward mechanism for risk management through take profit and stop loss. However, like all strategies, it should be used with an understanding of its limitations and ideally tested thoroughly in various market conditions before applying it to live trading.
{Gunzo} Trend Sniper (Multiple MAs with coefficient)Updated GUNZO's Trend Sniper script by adding in different MA types to choose from. This can help reduce false signals and sharpen the trend reversal points.
Here's a summary of the key changes:
1. Multiple Moving Average Types: The original script was focused solely on the Weighted Moving Average (WMA) with a coefficient. The updated script introduces flexibility by allowing users to choose from a variety of Moving Average types, including WMA, VWMA (Volume Weighted Moving Average), EMA (Exponential Moving Average), SMA (Simple Moving Average), HullMA (Hull Moving Average), TEMA (Triple Exponential Moving Average), DEMA (Double Exponential Moving Average), T3, and RMA (Running Moving Average).
2. Coefficient Integration: In the original script, the coefficient was specifically designed for the WMA calculation. The updated script extends this concept to all the selected Moving Average types. This coefficient is applied differently depending on the type of MA, often affecting the length of the MA calculation.
3. Dynamic Length Calculation: For MAs that traditionally use an integer length (like SMA, EMA, etc.), the updated script calculates this length dynamically by multiplying the user-defined length by the coefficient and then rounding it to the nearest integer. This ensures compatibility with Pine Script's requirements for these functions.
All credits to GUNZO
original script:
Triple Moving Averages (Gradient, Alarm & Multi TF)Triple Moving Averages
Features:
- 7 Different MA's (RMA, SMA, EMA, 'WMA', HMA, DEMA, EMA)
- Gradient coloring
- Multi timeframe
- Crossover alarm's and alarm delay function
- Forecasting (By removing the last bar in the MA period)
Moving Average to easely identify the trend and trend strength.
Gradient coloring and personal color preferences can be made.
Alert Delay System
When timing is essentially, this helps you get the alarm just in time.
Use it with the triggers ONLY ONCE PER BAR or ONLY ONCE. Then the alarm comes before the close, but you don't have to worry about it triggering just seconds after bar open :)
Default = 15m Recomended for 1h chart
Alarm's
Get the alarms before it's actually crossing or when it crosses
*This is not a selfmade indicator but simply merging from several indicators and added alert delay function and multi timeframe support
// Credits
- BigBitsIO Script : Scripting Tutorial 6 Triple Many Moving Averages Forecasting
- PineCoders Script : Color Gradient Framework PineCoders
maRSI - Moving Averages for RSI with Outer BandsWhat distinguishes this indicator?
This indicator can help to identify a trend at an early stage or as a confirmation - based on a RSI and its Moving Average. It should invite you to experiment and thereby be adapted to your own way of trading.
The type of moving average could be defined: "SMA", "EMA", "DEMA", "TEMA", "SMMA", "LSMA", "HMA", "WMA"
A suggestion for interpretation of “maRSI”:
A cross over the middle line (Signal Line) can be interpreted as a trend change. Is often used for more aggressive trading styles.
Everything above the middle line (Signal Line) could be interpreted as Uptrend. Vice versa.
Depending on how the outer bands were configured, these could be interpreted as earlier signals of a trend change. Is often used for slightly less aggressive trading styles.
Depending on the selected moving average, more or less conservative signals can be output.
The plot "RSI" shows the RSI based on the settings you have made.
The plot "Signal Line" is colored and shows whether the Signal Line is up- or downtrending.
The plot "Direction: RSI to Signal Line" provides clear information about the direction in which the "Signal Line" intersects the RSI and where the RSI is to the "Signal Line". "1" means RSI above "Signal Line" and "-1" means RSI below "Signal Line"
The plot "Direction: Signal Line” provides clear information about the direction of the Signal Line. "1" means uptrending while "-1" means downtrending.
What do I need to consider?
By definition this indicator can be classified as lagging - since it based on historical prices/values. It may be advisable to add further indicators and an analysis of the market structure in order to confirm the signals issued by the indicator. Please note that when you make adjustments to any strategy, you always carry out particularly detailed tests.
Details concerning the crosses of maRSI with its Signal Line and Outer Bands:
#revision: lv07
DCA Simulator---- EN ----
OBJECTIVE:
The aim of this indicator is to simulate the average acquisition price during a DCA from any date, any asset, any amount.
Useful for realizing that short-term volatility is not a problem when taking a long-term view, as only the fundamentals of the asset matter.
USAGE:
The indicator does not seek to reproduce tools to give you the size of your bag or what your absolute profit is. It should be used agnostically to the DCA amount, it allows you to identify whether starting from a date what your average purchase price and therefore whether you are currently in profit or not in relation to the current price.
You can also use it to compare assets against each other, which offers the best ROI via DCA.
NOTES:
The average price of the DCA will always be lower than the simple average price.
---- FR ----
OBJECTIF :
L'objectif de cette indicateur est de simuler le prix moyen d'acquisition lors d'un DCA à partir de n'importe quelle date, n'importe quel actif, peu importe le montant.
Utile pour se rendre compte que la volatilité court terme n'est pas un problème lors d'une vision long terme, seul compte le fondamental de l'actif.
USAGE :
L'indicateur ne cherche pas à reproduire des outils pour vous donner la taille de votre bag ou quel est votre profit absolu. Il doit être utilisé de manière agnostique au montant du DCA, il permet d'identifier si en commençant d'une date quel votre prix moyen d'achat et donc si vous êtes actuellement en profit ou pas par rapport au prix actuel.
Vous pouvez aussi vous en servir pour comparer des actifs entre eux, lequel offre le meilleur ROI via DCA.
NOTES :
L'on peut constater que le prix moyen du DCA sera systématiquement plus bas que la moyenne simple du prix
Weighted Oscillator Convergence DivergenceThe Weighted Oscillator Convergence Divergence (WOCD) aims to help traders identify potential trend reversals or momentum shifts in financial markets by calculating and visualizing the difference between a smoothed oscillator (WMA) value and its exponential moving average (EMA) and simple moving average (SMA) counterparts. This indicator is particularly useful for traders who want an alternative perspective on price momentum and divergence.
Key Features:
Inputs:
Length: The user can specify the number of bars to consider for calculations (default is 9).
Smoothing 1: Defines the smoothing factor for the first smoothed value (default is 5).
Smoothing 2: Specifies the smoothing factor for the second smoothed value (default is 7).
Ma Type: There are three types of moving averages you can choose (Wilder, non-lag, Weighted is by default).
Color Settings: Users can customize the indicator's colors for various elements, such as length, smoothing values, and different sections of the histogram.
Calculation:
WOCD calculates the raw oscillator value by subtracting the close price from a 3-period High, Low, Close (HLC3) moving average.
It then applies smoothing to this raw oscillator value using two different methods: exponential moving average (EMA) and simple moving average (SMA) with user-defined smoothing periods.
Histogram Plot:
The indicator plots a histogram based on the difference between the smoothed oscillator and the first smoothed value.
When the histogram is above zero and rising, it is colored according to the "Above Grow" color setting. When it's above zero and falling, it uses the "Fall" color for visualization.
Similarly, when the histogram is below zero and rising, it is colored according to the "Below Grow" color setting, and when it's below zero and falling, it uses the "Fall" color.
Oscillator and Smoothed Values:
The indicator also plots the smoothed oscillator, smoothed value 1 (EMA-based), and smoothed value 2 (SMA-based) on the chart.
Zero Line:
A horizontal line at zero is drawn on the chart for reference.
How to Use the WOCD Indicator:
Trend Identification: Observe the histogram's direction and color. A rising histogram above zero may indicate bullish momentum, while a falling histogram below zero could signal bearish momentum.
Divergence: Look for divergences between price action and the histogram. When the histogram and price move in opposite directions, it can be a potential reversal signal.
Crossovers: Pay attention to crossovers between the smoothed oscillator and its smoothed counterparts (EMA and SMA). These crossovers can indicate changes in trend strength or direction.
Zero Line: The zero line can act as a reference point. Positive histogram values suggest bullish sentiment, while negative values indicate bearish sentiment.
Comparison to MACD Indicator:
The WOCD indicator shares some similarities with the Moving Average Convergence Divergence (MACD) indicator but also has distinct differences:
Similarities:
Both WOCD and MACD are momentum oscillators designed to identify potential trend reversals and divergences.
They use moving averages (EMA in the case of MACD) to smooth the raw oscillator values.
Both indicators provide histogram representations of the difference between the oscillator and its smoothed counterpart.
Differences:
WOCD uses a 3-period High, Low, Close (HLC3) moving average to calculate the raw oscillator value, whereas MACD uses the difference between two exponential moving averages (usually 12-period and 26-period EMAs).
The smoothing in WOCD employs both EMA and SMA, while MACD exclusively uses EMA.
WOCD allows users to customize colors for various elements, enhancing visual clarity.
VARGAS"VARGAS" is an indicator that can be used in all timeframes on charts in the stock, crypto, and commodity markets. It allows trades to be opened according to the intersections of moving averages in different time periods.
It is an indicator using weighted moving averages. Using a weighted moving average has the following benefits for traders:
1) Precision and Smoothness: The WMA typically gives more weight to recent prices and therefore reacts faster to more recent data. This helps you catch price movements faster and recognize trend changes faster. On the other hand, the WMA is smoother than the simple moving average (SMA), which makes it less likely to generate false signals.
2) Trend Identification: The WMA is used to identify and analyze price trends. It is especially important for traders who want to track short-term movements. The WMA is used to assess the direction and strength of the trend.
3) Trading Signals: The WMA is used as part of various trading strategies. It is especially used in moving average crossover strategies. For example, a short-term WMA crossing the long-term WMA to the upside can be considered a buy signal, while a reversal can be interpreted as a sell signal.
4) Adaptability to Volatility: WMA can adapt to volatility by changing weighting factors. Investors can adopt a more flexible approach by assigning different weights based on market conditions and asset classes.
5) Data Correction: WMA can be helpful in reducing data noise. A single large price fluctuation can cause the SMA to be more affected, while the WMA reduces the impact of these fluctuations.
In our VARGAS coding, the intersection times of the 9-day and 15-day weighted moving averages allow us to decide the direction of the trend. The green and red cloud areas following the price candles make the strategy easy for the user to follow.
At the intersection between the 9-day weighted moving average and the 15-day weighted moving average, we can use buy and sell signals as follows:
If the 9-day weighted moving average crosses the 15-day weighted moving average upwards, buy,
Sell if the 9-day weighted moving average crosses the 15-day weighted moving average downwards.
Within the scope of this strategy, GOLDEN CROSS and DEATH CROSS intersections, which guide us for trend changes, are also included in the coding. Thus, it is aimed to add strength to our WMA 9 and WMA 15 intersection strategy as an idea.
VARGAS indicator gives better results for longer periods of 4 hours and above. As the time period increases, the probability of correct results will increase.
**
"VARGAS" hisse senedi, kripto, ve emtia piyasalarındaki grafiklerde her türlü zaman diliminde kullanılabilen bir indikatördür. Farklı zaman periyotlarındaki hareketli ortalamaların kesişimlerine göre işlem açılmasını sağlar.
Ağırlıklı hareketli ortalamalar kullanılarak hazırlanmış bir göstergedir. Ağırlıklı hareketli ortalama kullanmanın yatırımcılara aşağıdaki gibi faydaları bulunmaktadır:
1) Duyarlılık ve Pürüzsüzlük: WMA, tipik olarak son dönem fiyatlarına daha fazla ağırlık verir ve bu nedenle daha güncel verilere daha hızlı tepki verir. Bu, fiyat hareketlerini daha hızlı yakalamanıza ve daha hızlı trend değişikliklerini tanımanıza yardımcı olur. Diğer yandan, WMA, basit hareketli ortalamaya (SMA) göre daha pürüzsüzdür, bu da yanlış sinyal üretme olasılığını azaltır.
2) Trend Belirleme: WMA, fiyat trendlerini belirlemek ve analiz etmek için kullanılır. Özellikle kısa vadeli hareketleri izlemek isteyen yatırımcılar için önemlidir. WMA, trendin yönünü ve gücünü değerlendirmek için kullanılır.
3) Ticaret Sinyalleri: WMA, çeşitli ticaret stratejilerinin bir parçası olarak kullanılır. Özellikle hareketli ortalama crossover stratejilerinde kullanılır. Örneğin, kısa vadeli WMA'nın uzun vadeli WMA'yı yukarı yönlü kesmesi bir alım sinyali olarak kabul edilebilir, tersine dönmesi ise bir satış sinyali olarak yorumlanabilir.
4) Volatiliteye Uyarlanabilirlik: WMA, ağırlıklandırma faktörlerini değiştirerek volatiliteye uyum sağlayabilir. Yatırımcılar, piyasa koşullarına ve varlık sınıflarına göre farklı ağırlıklar atayarak daha esnek bir yaklaşım benimseyebilirler.
5) Veri Düzeltme: WMA, veri gürültüsünü azaltmada yardımcı olabilir. Tek bir büyük fiyat dalgalanması, SMA'nın daha fazla etkilenmesine neden olabilirken, WMA bu dalgalanmaların etkisini azaltır.
VARGAS isimli kodlamamızda ise 9 günlük ve 15 günlük ağırlıklı hareketli ortalamaların kesişme zamanları trendin yönüne karar vermemizi sağlar. Fiyat mumlarını takip eden yeşil ve kırmızı bulut alanları stratejinin kullanıcı tarafından kolaylıkla takip edilmesini sağlamaktadır.
9 Günlük Ağırlıklı hareketli ortalama, 15 Günlük Ağırlıklı hareketli ortalama arasındaki kesişimde al ve sat sinyallerini şu şekilde kullanabiliriz:
Eğer 9 günlük ağırlıklı hareketli ortalama 15 günlük ağırlıklı hareketli ortalamayı yukarı doğru kesiyorsa al,
Eğer 9 günlük ağırlıklı hareketli ortalama, 15 günlük ağırlıklı hareketli ortalamayı aşağı doğru keserse sat.
Bu strateji kapsamında trend değişimleri için bizlere yön veren GOLDEN CROSS ve DEATH CROSS kesişimleri de kodlamanın içerisinde dahil edilmiştir. Böylelikle WMA 9 ve WMA 15 kesişim stratejimize fikir olarak güç katması hedeflenmiştir.
VARGAS indikatörü 4 saat ve üzeri daha uzun periyotlarda daha iyi sonuçlar vermektedir. Zaman periyodu büyüdükçe doğru sonuç verme olasılığı artacaktır.
[sphx] FWMAI've developed a cool indicator. The indicator calculates a Fibonacci-weighted moving average (FWMA) based on a specific length. What sets it apart is that it assists me in identifying potential trend reversals. When the indicator's color changes - from red to light red or from green to light green - it's an indication that the trend might be shifting.
What makes the indicator even more interesting: While I'm keeping an eye on these color changes, I'm also observing the price behavior. I check whether the price is in a consolidation phase during the color transition. This not only helps me detect potential trend changes but also to see whether the market is in a phase of price consolidation. The combination of this information aids me in making well-informed trading decisions.
I find the indicator so useful that I've decided to make it available to the community. You can use the code and adapt it to your own trading strategies. I hope it's as helpful to you as it has been to me. Wishing all of you successful trades and the best outcomes! Let's understand the market together and trade successfully.
Tillson T3 Moving Average - ScreenerScreener version of Tillson T3 Moving Average:
The T3 Moving Average generally produces entry signals similar to other moving averages and, thus, is mainly traded in the same manner. Here are several assumptions:
Suppose the price action is above the T3 Moving Average, and the indicator is upward. In that case, we have a bullish trend and should only enter long trades (advisable for novice/intermediate traders). If the price is below the T3 Moving Average and edging lower, we have a bearish trend and should limit entries to short.
About Screener Panel:
Users can explore 20 different and user-defined tickers, which can be changed from the SETTINGS (shares, crypto, commodities...) on this screener version.
The screener panel shows up right after the bars on the right side of the chart.
Tickers seen in green are the ones that are in an uptrend, according to T3.
The ones that appear in red are those in the SELL signal, in a downtrend.
The numbers in front of each Ticker indicate how many bars passed after the last BUY or SELL signal of T3.
For example, according to the indicator, when BTCUSDT appears (3) in GREEN, Bitcoin switched to a BUY signal 3 bars ago.
-In this screener version of Tillson T3 Moving Average, users can define the number of demanded tickers (symbols) from 1 to 20 by checking the relevant boxes on the settings tab.
-All selected tickers can be screened in different timeframes.
-Also, different timeframes of the same Ticker can be screened.
IMPORTANT NOTICE:
Screener shows the results in 2 different logic:
-Screener shows the information about the color changes of the T3 Moving Average with default settings.
-Users can check the "Change Screener to show T3 & Price Flips" button to activate the screener giving information about price flips.
If this option is preferred, users are advised to enlarge the length to have better signals.
MavilimW ScreenerScreener version of MavilimW Moving Average :
Short-Term Examples (by decreasing 3 and 5 default values to have trading signals from color changes)
BUY when MavilimW turns blue from red.
SELL when MavW turns red from blue.
Long-Term Examples (with Default values 3 and 5)
BUY when the price crosses over the MavilimW line
SELL when the price crosses below the MavW line
MavilimW can also define significant SUPPORT and RESISTANCE levels in every period with its default values 3 and 5.
Screener Panel:
You can explore 20 different and user-defined tickers, which can be changed from the SETTINGS (shares, crypto, commodities...) on this screener version.
The screener panel shows up right after the bars on the right side of the chart.
Tickers seen in green are the ones that are in an uptrend, according to MavilimW.
The ones that appear in red are those in the SELL signal, in a downtrend.
The numbers in front of each Ticker indicate how many bars passed after the last BUY or SELL signal of MavW.
For example, according to the indicator, when BTCUSDT appears (3) in GREEN, Bitcoin switched to a BUY signal 3 bars ago.
-In this screener version of MavilimW, users can define the number of demanded tickers (symbols) from 1 to 20 by checking the relevant boxes on the settings tab.
-All selected tickers can be screened in different timeframes.
-Also, different timeframes of the same Ticker can be screened.
IMPORTANT NOTICE:
-Screener shows the information about the color changes of MavilimW Moving Average with default settings (as explained in the Short-Term Example section).
-Users can check the "Change Screener to show MavilimW & Price Flips" button to activate the screener as explained in the Short-Term Example section. Then the screener will give information about price flips.
FTR, WMA, OBV & RSI StrategyThis Pine Script code is a trading strategy that uses several indicators such as Fisher Transform (FTR), On-Balance Volume (OBV), Relative Strength Index (RSI), and a Weighted Moving Average (WMA). The strategy generates buy and sell signals based on the conditions of these indicators.
The Fisher Transform function is a technical indicator that uses past prices to determine whether the current market is bullish or bearish. The Fisher Transform function takes in four multipliers and a length parameter. The four multipliers are used to calculate four Fisher Transform values, and these values are used in combination to determine if the market is bullish or bearish.
The Weighted Moving Average (WMA) is a technical indicator that smooths out the price data by giving more weight to the most recent prices.
The Relative Strength Index (RSI) is a momentum indicator that measures the strength of a security's price action. The RSI ranges from 0 to 100 and is typically used to identify overbought or oversold conditions in the market.
The On-Balance Volume (OBV) is a technical indicator that uses volume to predict changes in the stock price. OBV values are calculated by adding volume on up days and subtracting volume on down days.
The strategy uses the Fisher Transform values to generate buy and sell signals when all four Fisher Transform values change color. It also uses the WMA to determine if the trend is bullish or bearish, the OBV to confirm the trend, and the RSI to filter out false signals.
The red and green triangular arrows attempt to indicate that the trend is bullish or bearish and should not be traded against in the opposite direction. This helps with my FOMO :)
All comments welcome!
The script should not be relied upon alone, there are no stop loss or take profit filters. The best results have been back-tested using Tradingview on the 45m - 3 hour timeframes.
GKD-C Vulkan Profit [Loxx]Giga Kaleidoscope GKD-C Vulkan Profit is a Confirmation module included in Loxx's "Giga Kaleidoscope Modularized Trading System".
█ GKD-C Vulkan Profit
What is the Vulkan Profit Indicator?
The Vulkan Profit indicator is a trading tool that helps traders identify potential buy and sell signals in financial markets. It uses a combination of short-term and long-term moving averages to gauge the strength of trends and generate trading signals based on the interaction between these averages. The following explores the workings of the Vulkan Profit indicator, focusing on the concepts and calculations it uses to generate trading signals.
At the core of the Vulkan Profit indicator are two sets of moving averages: the short-term and the long-term. The short-term moving averages are calculated using weighted moving averages (WMA) with periods of 3 and 8. These short-term moving averages, referred to as STL1 and STL2, are designed to track the price movements more closely and respond faster to recent price changes.
The long-term moving averages, on the other hand, are calculated using exponential moving averages (EMA) with periods of 18 and 28. These long-term moving averages, referred to as LTL1 and LTL2, provide a smoother representation of the price movements and are less sensitive to recent price fluctuations. They represent the long-term trend in the market.
The buy and sell signals generated by the Vulkan Profit indicator are based on the relationship between the short-term and long-term moving averages. The indicator monitors the crossover between these two sets of moving averages to identify potential trend reversals.
A buy signal is generated when the minimum value of the short-term moving averages (STL1 and STL2) becomes greater than the maximum value of the long-term moving averages (LTL1 and LTL2), and this condition was not met in the previous candle. This scenario indicates that the short-term trend has shifted upwards, crossing above the long-term trend, and could be a sign of a potential bullish reversal.
Conversely, a sell signal is generated when the maximum value of the short-term moving averages (STL1 and STL2) becomes less than the minimum value of the long-term moving averages (LTL1 and LTL2), and this condition was not met in the previous candle. This indicates that the short-term trend has shifted downwards, crossing below the long-term trend, and could be a sign of a potential bearish reversal.
In summary, the Vulkan Profit indicator is a trading tool that uses a combination of short-term and long-term moving averages to identify potential buy and sell signals in financial markets. By monitoring the crossovers between these two sets of moving averages, the indicator provides traders with an easy-to-understand visual representation of the current trend and potential trend reversals. This information can be valuable for traders looking to time their entries and exits in the market and make more informed trading decisions.
Additional Features
This indicator allows you to select from 33 source types. They are as follows:
Close
Open
High
Low
Median
Typical
Weighted
Average
Average Median Body
Trend Biased
Trend Biased (Extreme)
HA Close
HA Open
HA High
HA Low
HA Median
HA Typical
HA Weighted
HA Average
HA Average Median Body
HA Trend Biased
HA Trend Biased (Extreme)
HAB Close
HAB Open
HAB High
HAB Low
HAB Median
HAB Typical
HAB Weighted
HAB Average
HAB Average Median Body
HAB Trend Biased
HAB Trend Biased (Extreme)
What are Heiken Ashi "better" candles?
Heiken Ashi "better" candles are a modified version of the standard Heiken Ashi candles, which are a popular charting technique used in technical analysis. Heiken Ashi candles help traders identify trends and potential reversal points by smoothing out price data and reducing market noise. The "better formula" was proposed by Sebastian Schmidt in an article published by BNP Paribas in Warrants & Zertifikate, a German magazine, in August 2004. The aim of this formula is to further improve the smoothing of the Heiken Ashi chart and enhance its effectiveness in identifying trends and reversals.
Standard Heiken Ashi candles are calculated using the following formulas:
Heiken Ashi Close = (Open + High + Low + Close) / 4
Heiken Ashi Open = (Previous Heiken Ashi Open + Previous Heiken Ashi Close) / 2
Heiken Ashi High = Max (High, Heiken Ashi Open, Heiken Ashi Close)
Heiken Ashi Low = Min (Low, Heiken Ashi Open, Heiken Ashi Close)
The "better formula" modifies the standard Heiken Ashi calculation by incorporating additional smoothing, which can help reduce noise and make it easier to identify trends and reversals. The modified formulas for Heiken Ashi "better" candles are as follows:
Better Heiken Ashi Close = (Open + High + Low + Close) / 4
Better Heiken Ashi Open = (Previous Better Heiken Ashi Open + Previous Better Heiken Ashi Close) / 2
Better Heiken Ashi High = Max (High, Better Heiken Ashi Open, Better Heiken Ashi Close)
Better Heiken Ashi Low = Min (Low, Better Heiken Ashi Open, Better Heiken Ashi Close)
Smoothing Factor = 2 / (N + 1), where N is the chosen period for smoothing
Smoothed Better Heiken Ashi Open = (Better Heiken Ashi Open * Smoothing Factor) + (Previous Smoothed Better Heiken Ashi Open * (1 - Smoothing Factor))
Smoothed Better Heiken Ashi Close = (Better Heiken Ashi Close * Smoothing Factor) + (Previous Smoothed Better Heiken Ashi Close * (1 - Smoothing Factor))
The smoothed Better Heiken Ashi Open and Close values are then used to calculate the smoothed Better Heiken Ashi High and Low values, resulting in "better" candles that provide a clearer representation of the market trend and potential reversal points.
It's important to note that, like any other technical analysis tool, Heiken Ashi "better" candles are not foolproof and should be used in conjunction with other indicators and analysis techniques to make well-informed trading decisions.
Heiken Ashi "better" candles, as mentioned previously, provide a clearer representation of market trends and potential reversal points by reducing noise and smoothing out price data. When using these candles in conjunction with other technical analysis tools and indicators, traders can gain valuable insights into market behavior and make more informed decisions.
To effectively use Heiken Ashi "better" candles in your trading strategy, consider the following tips:
Trend Identification: Heiken Ashi "better" candles can help you identify the prevailing trend in the market. When the majority of the candles are green (or another color, depending on your chart settings) and there are no or few lower wicks, it may indicate a strong uptrend. Conversely, when the majority of the candles are red (or another color) and there are no or few upper wicks, it may signal a strong downtrend.
Trend Reversals: Look for potential trend reversals when a change in the color of the candles occurs, especially when accompanied by longer wicks. For example, if a green candle with a long lower wick is followed by a red candle, it could indicate a bearish reversal. Similarly, a red candle with a long upper wick followed by a green candle may suggest a bullish reversal.
Support and Resistance: You can use Heiken Ashi "better" candles to identify potential support and resistance levels. When the candles are consistently moving in one direction and then suddenly change color with longer wicks, it could indicate the presence of a support or resistance level.
Stop-Loss and Take-Profit: Using Heiken Ashi "better" candles can help you manage risk by determining optimal stop-loss and take-profit levels. For instance, you can place your stop-loss below the low of the most recent green candle in an uptrend or above the high of the most recent red candle in a downtrend.
Confirming Signals: Heiken Ashi "better" candles should be used in conjunction with other technical indicators, such as moving averages, oscillators, or chart patterns, to confirm signals and improve the accuracy of your analysis.
In this implementation, you have the choice of AMA, KAMA, or T3 smoothing. These are as follows:
Kaufman Adaptive Moving Average (KAMA)
The Kaufman Adaptive Moving Average (KAMA) is a type of adaptive moving average used in technical analysis to smooth out price fluctuations and identify trends. The KAMA adjusts its smoothing factor based on the market's volatility, making it more responsive in volatile markets and smoother in calm markets. The KAMA is calculated using three different efficiency ratios that determine the appropriate smoothing factor for the current market conditions. These ratios are based on the noise level of the market, the speed at which the market is moving, and the length of the moving average. The KAMA is a popular choice among traders who prefer to use adaptive indicators to identify trends and potential reversals.
Adaptive Moving Average
The Adaptive Moving Average (AMA) is a type of moving average that adjusts its sensitivity to price movements based on market conditions. It uses a ratio between the current price and the highest and lowest prices over a certain lookback period to determine its level of smoothing. The AMA can help reduce lag and increase responsiveness to changes in trend direction, making it useful for traders who want to follow trends while avoiding false signals. The AMA is calculated by multiplying a smoothing constant with the difference between the current price and the previous AMA value, then adding the result to the previous AMA value.
T3
The T3 moving average is a type of technical indicator used in financial analysis to identify trends in price movements. It is similar to the Exponential Moving Average (EMA) and the Double Exponential Moving Average (DEMA), but uses a different smoothing algorithm.
The T3 moving average is calculated using a series of exponential moving averages that are designed to filter out noise and smooth the data. The resulting smoothed data is then weighted with a non-linear function to produce a final output that is more responsive to changes in trend direction.
The T3 moving average can be customized by adjusting the length of the moving average, as well as the weighting function used to smooth the data. It is commonly used in conjunction with other technical indicators as part of a larger trading strategy.
█ Giga Kaleidoscope Modularized Trading System
Core components of an NNFX algorithmic trading strategy
The NNFX algorithm is built on the principles of trend, momentum, and volatility. There are six core components in the NNFX trading algorithm:
1. Volatility - price volatility; e.g., Average True Range, True Range Double, Close-to-Close, etc.
2. Baseline - a moving average to identify price trend
3. Confirmation 1 - a technical indicator used to identify trends
4. Confirmation 2 - a technical indicator used to identify trends
5. Continuation - a technical indicator used to identify trends
6. Volatility/Volume - a technical indicator used to identify volatility/volume breakouts/breakdown
7. Exit - a technical indicator used to determine when a trend is exhausted
What is Volatility in the NNFX trading system?
In the NNFX (No Nonsense Forex) trading system, ATR (Average True Range) is typically used to measure the volatility of an asset. It is used as a part of the system to help determine the appropriate stop loss and take profit levels for a trade. ATR is calculated by taking the average of the true range values over a specified period.
True range is calculated as the maximum of the following values:
-Current high minus the current low
-Absolute value of the current high minus the previous close
-Absolute value of the current low minus the previous close
ATR is a dynamic indicator that changes with changes in volatility. As volatility increases, the value of ATR increases, and as volatility decreases, the value of ATR decreases. By using ATR in NNFX system, traders can adjust their stop loss and take profit levels according to the volatility of the asset being traded. This helps to ensure that the trade is given enough room to move, while also minimizing potential losses.
Other types of volatility include True Range Double (TRD), Close-to-Close, and Garman-Klass
What is a Baseline indicator?
The baseline is essentially a moving average, and is used to determine the overall direction of the market.
The baseline in the NNFX system is used to filter out trades that are not in line with the long-term trend of the market. The baseline is plotted on the chart along with other indicators, such as the Moving Average (MA), the Relative Strength Index (RSI), and the Average True Range (ATR).
Trades are only taken when the price is in the same direction as the baseline. For example, if the baseline is sloping upwards, only long trades are taken, and if the baseline is sloping downwards, only short trades are taken. This approach helps to ensure that trades are in line with the overall trend of the market, and reduces the risk of entering trades that are likely to fail.
By using a baseline in the NNFX system, traders can have a clear reference point for determining the overall trend of the market, and can make more informed trading decisions. The baseline helps to filter out noise and false signals, and ensures that trades are taken in the direction of the long-term trend.
What is a Confirmation indicator?
Confirmation indicators are technical indicators that are used to confirm the signals generated by primary indicators. Primary indicators are the core indicators used in the NNFX system, such as the Average True Range (ATR), the Moving Average (MA), and the Relative Strength Index (RSI).
The purpose of the confirmation indicators is to reduce false signals and improve the accuracy of the trading system. They are designed to confirm the signals generated by the primary indicators by providing additional information about the strength and direction of the trend.
Some examples of confirmation indicators that may be used in the NNFX system include the Bollinger Bands, the MACD (Moving Average Convergence Divergence), and the MACD Oscillator. These indicators can provide information about the volatility, momentum, and trend strength of the market, and can be used to confirm the signals generated by the primary indicators.
In the NNFX system, confirmation indicators are used in combination with primary indicators and other filters to create a trading system that is robust and reliable. By using multiple indicators to confirm trading signals, the system aims to reduce the risk of false signals and improve the overall profitability of the trades.
What is a Continuation indicator?
In the NNFX (No Nonsense Forex) trading system, a continuation indicator is a technical indicator that is used to confirm a current trend and predict that the trend is likely to continue in the same direction. A continuation indicator is typically used in conjunction with other indicators in the system, such as a baseline indicator, to provide a comprehensive trading strategy.
What is a Volatility/Volume indicator?
Volume indicators, such as the On Balance Volume (OBV), the Chaikin Money Flow (CMF), or the Volume Price Trend (VPT), are used to measure the amount of buying and selling activity in a market. They are based on the trading volume of the market, and can provide information about the strength of the trend. In the NNFX system, volume indicators are used to confirm trading signals generated by the Moving Average and the Relative Strength Index. Volatility indicators include Average Direction Index, Waddah Attar, and Volatility Ratio. In the NNFX trading system, volatility is a proxy for volume and vice versa.
By using volume indicators as confirmation tools, the NNFX trading system aims to reduce the risk of false signals and improve the overall profitability of trades. These indicators can provide additional information about the market that is not captured by the primary indicators, and can help traders to make more informed trading decisions. In addition, volume indicators can be used to identify potential changes in market trends and to confirm the strength of price movements.
What is an Exit indicator?
The exit indicator is used in conjunction with other indicators in the system, such as the Moving Average (MA), the Relative Strength Index (RSI), and the Average True Range (ATR), to provide a comprehensive trading strategy.
The exit indicator in the NNFX system can be any technical indicator that is deemed effective at identifying optimal exit points. Examples of exit indicators that are commonly used include the Parabolic SAR, the Average Directional Index (ADX), and the Chandelier Exit.
The purpose of the exit indicator is to identify when a trend is likely to reverse or when the market conditions have changed, signaling the need to exit a trade. By using an exit indicator, traders can manage their risk and prevent significant losses.
In the NNFX system, the exit indicator is used in conjunction with a stop loss and a take profit order to maximize profits and minimize losses. The stop loss order is used to limit the amount of loss that can be incurred if the trade goes against the trader, while the take profit order is used to lock in profits when the trade is moving in the trader's favor.
Overall, the use of an exit indicator in the NNFX trading system is an important component of a comprehensive trading strategy. It allows traders to manage their risk effectively and improve the profitability of their trades by exiting at the right time.
How does Loxx's GKD (Giga Kaleidoscope Modularized Trading System) implement the NNFX algorithm outlined above?
Loxx's GKD v1.0 system has five types of modules (indicators/strategies). These modules are:
1. GKD-BT - Backtesting module (Volatility, Number 1 in the NNFX algorithm)
2. GKD-B - Baseline module (Baseline and Volatility/Volume, Numbers 1 and 2 in the NNFX algorithm)
3. GKD-C - Confirmation 1/2 and Continuation module (Confirmation 1/2 and Continuation, Numbers 3, 4, and 5 in the NNFX algorithm)
4. GKD-V - Volatility/Volume module (Confirmation 1/2, Number 6 in the NNFX algorithm)
5. GKD-E - Exit module (Exit, Number 7 in the NNFX algorithm)
(additional module types will added in future releases)
Each module interacts with every module by passing data between modules. Data is passed between each module as described below:
GKD-B => GKD-V => GKD-C(1) => GKD-C(2) => GKD-C(Continuation) => GKD-E => GKD-BT
That is, the Baseline indicator passes its data to Volatility/Volume. The Volatility/Volume indicator passes its values to the Confirmation 1 indicator. The Confirmation 1 indicator passes its values to the Confirmation 2 indicator. The Confirmation 2 indicator passes its values to the Continuation indicator. The Continuation indicator passes its values to the Exit indicator, and finally, the Exit indicator passes its values to the Backtest strategy.
This chaining of indicators requires that each module conform to Loxx's GKD protocol, therefore allowing for the testing of every possible combination of technical indicators that make up the six components of the NNFX algorithm.
What does the application of the GKD trading system look like?
Example trading system:
Backtest: Strategy with 1-3 take profits, trailing stop loss, multiple types of PnL volatility, and 2 backtesting styles
Baseline: Hull Moving Average
Volatility/Volume: Hurst Exponent
Confirmation 1: Vulkan Profit as shown on the chart above
Confirmation 2: Williams Percent Range
Continuation: Vulkan Profit
Exit: Rex Oscillator
Each GKD indicator is denoted with a module identifier of either: GKD-BT, GKD-B, GKD-C, GKD-V, or GKD-E. This allows traders to understand to which module each indicator belongs and where each indicator fits into the GKD protocol chain.
Giga Kaleidoscope Modularized Trading System Signals (based on the NNFX algorithm)
Standard Entry
1. GKD-C Confirmation 1 Signal
2. GKD-B Baseline agrees
3. Price is within a range of 0.2x Volatility and 1.0x Volatility of the Goldie Locks Mean
4. GKD-C Confirmation 2 agrees
5. GKD-V Volatility/Volume agrees
Baseline Entry
1. GKD-B Baseline signal
2. GKD-C Confirmation 1 agrees
3. Price is within a range of 0.2x Volatility and 1.0x Volatility of the Goldie Locks Mean
4. GKD-C Confirmation 2 agrees
5. GKD-V Volatility/Volume agrees
6. GKD-C Confirmation 1 signal was less than 7 candles prior
Volatility/Volume Entry
1. GKD-V Volatility/Volume signal
2. GKD-C Confirmation 1 agrees
3. Price is within a range of 0.2x Volatility and 1.0x Volatility of the Goldie Locks Mean
4. GKD-C Confirmation 2 agrees
5. GKD-B Baseline agrees
6. GKD-C Confirmation 1 signal was less than 7 candles prior
Continuation Entry
1. Standard Entry, Baseline Entry, or Pullback; entry triggered previously
2. GKD-B Baseline hasn't crossed since entry signal trigger
3. GKD-C Confirmation Continuation Indicator signals
4. GKD-C Confirmation 1 agrees
5. GKD-B Baseline agrees
6. GKD-C Confirmation 2 agrees
1-Candle Rule Standard Entry
1. GKD-C Confirmation 1 signal
2. GKD-B Baseline agrees
3. Price is within a range of 0.2x Volatility and 1.0x Volatility of the Goldie Locks Mean
Next Candle:
1. Price retraced (Long: close < close or Short: close > close )
2. GKD-B Baseline agrees
3. GKD-C Confirmation 1 agrees
4. GKD-C Confirmation 2 agrees
5. GKD-V Volatility/Volume agrees
1-Candle Rule Baseline Entry
1. GKD-B Baseline signal
2. GKD-C Confirmation 1 agrees
3. Price is within a range of 0.2x Volatility and 1.0x Volatility of the Goldie Locks Mean
4. GKD-C Confirmation 1 signal was less than 7 candles prior
Next Candle:
1. Price retraced (Long: close < close or Short: close > close )
2. GKD-B Baseline agrees
3. GKD-C Confirmation 1 agrees
4. GKD-C Confirmation 2 agrees
5. GKD-V Volatility/Volume Agrees
1-Candle Rule Volatility/Volume Entry
1. GKD-V Volatility/Volume signal
2. GKD-C Confirmation 1 agrees
3. Price is within a range of 0.2x Volatility and 1.0x Volatility of the Goldie Locks Mean
4. GKD-C Confirmation 1 signal was less than 7 candles prior
Next Candle:
1. Price retraced (Long: close < close or Short: close > close)
2. GKD-B Volatility/Volume agrees
3. GKD-C Confirmation 1 agrees
4. GKD-C Confirmation 2 agrees
5. GKD-B Baseline agrees
PullBack Entry
1. GKD-B Baseline signal
2. GKD-C Confirmation 1 agrees
3. Price is beyond 1.0x Volatility of Baseline
Next Candle:
1. Price is within a range of 0.2x Volatility and 1.0x Volatility of the Goldie Locks Mean
2. GKD-C Confirmation 1 agrees
3. GKD-C Confirmation 2 agrees
4. GKD-V Volatility/Volume Agrees
]█ Setting up the GKD
The GKD system involves chaining indicators together. These are the steps to set this up.
Use a GKD-C indicator alone on a chart
1. Inside the GKD-C indicator, change the "Confirmation Type" setting to "Solo Confirmation Simple"
Use a GKD-V indicator alone on a chart
**nothing, it's already useable on the chart without any settings changes
Use a GKD-B indicator alone on a chart
**nothing, it's already useable on the chart without any settings changes
Baseline (Baseline, Backtest)
1. Import the GKD-B Baseline into the GKD-BT Backtest: "Input into Volatility/Volume or Backtest (Baseline testing)"
2. Inside the GKD-BT Backtest, change the setting "Backtest Special" to "Baseline"
Volatility/Volume (Volatility/Volume, Backte st)
1. Inside the GKD-V indicator, change the "Testing Type" setting to "Solo"
2. Inside the GKD-V indicator, change the "Signal Type" setting to "Crossing" (neither traditional nor both can be backtested)
3. Import the GKD-V indicator into the GKD-BT Backtest: "Input into C1 or Backtest"
4. Inside the GKD-BT Backtest, change the setting "Backtest Special" to "Volatility/Volume"
5. Inside the GKD-BT Backtest, a) change the setting "Backtest Type" to "Trading" if using a directional GKD-V indicator; or, b) change the setting "Backtest Type" to "Full" if using a directional or non-directional GKD-V indicator (non-directional GKD-V can only test Longs and Shorts separately)
6. If "Backtest Type" is set to "Full": Inside the GKD-BT Backtest, change the setting "Backtest Side" to "Long" or "Short
7. If "Backtest Type" is set to "Full": To allow the system to open multiple orders at one time so you test all Longs or Shorts, open the GKD-BT Backtest, click the tab "Properties" and then insert a value of something like 10 orders into the "Pyramiding" settings. This will allow 10 orders to be opened at one time which should be enough to catch all possible Longs or Shorts.
Solo Confirmation Simple (Confirmation, Backtest)
1. Inside the GKD-C indicator, change the "Confirmation Type" setting to "Solo Confirmation Simple"
1. Import the GKD-C indicator into the GKD-BT Backtest: "Input into Backtest"
2. Inside the GKD-BT Backtest, change the setting "Backtest Special" to "Solo Confirmation Simple"
Solo Confirmation Complex without Exits (Baseline, Volatility/Volume, Confirmation, Backtest)
1. Inside the GKD-V indicator, change the "Testing Type" setting to "Chained"
2. Import the GKD-B Baseline into the GKD-V indicator: "Input into Volatility/Volume or Backtest (Baseline testing)"
3. Inside the GKD-C indicator, change the "Confirmation Type" setting to "Solo Confirmation Complex"
4. Import the GKD-V indicator into the GKD-C indicator: "Input into C1 or Backtest"
5. Inside the GKD-BT Backtest, change the setting "Backtest Special" to "GKD Full wo/ Exits"
6. Import the GKD-C into the GKD-BT Backtest: "Input into Exit or Backtest"
Solo Confirmation Complex with Exits (Baseline, Volatility/Volume, Confirmation, Exit, Backtest)
1. Inside the GKD-V indicator, change the "Testing Type" setting to "Chained"
2. Import the GKD-B Baseline into the GKD-V indicator: "Input into Volatility/Volume or Backtest (Baseline testing)"
3. Inside the GKD-C indicator, change the "Confirmation Type" setting to "Solo Confirmation Complex"
4. Import the GKD-V indicator into the GKD-C indicator: "Input into C1 or Backtest"
5. Import the GKD-C indicator into the GKD-E indicator: "Input into Exit"
6. Inside the GKD-BT Backtest, change the setting "Backtest Special" to "GKD Full w/ Exits"
7. Import the GKD-E into the GKD-BT Backtest: "Input into Backtest"
Full GKD without Exits (Baseline, Volatility/Volume, Confirmation 1, Confirmation 2, Continuation, Backtest)
1. Inside the GKD-V indicator, change the "Testing Type" setting to "Chained"
2. Import the GKD-B Baseline into the GKD-V indicator: "Input into Volatility/Volume or Backtest (Baseline testing)"
3. Inside the GKD-C 1 indicator, change the "Confirmation Type" setting to "Confirmation 1"
4. Import the GKD-V indicator into the GKD-C 1 indicator: "Input into C1 or Backtest"
5. Inside the GKD-C 2 indicator, change the "Confirmation Type" setting to "Confirmation 2"
6. Import the GKD-C 1 indicator into the GKD-C 2 indicator: "Input into C2"
7. Inside the GKD-C Continuation indicator, change the "Confirmation Type" setting to "Continuation"
8. Inside the GKD-BT Backtest, change the setting "Backtest Special" to "GKD Full wo/ Exits"
9. Import the GKD-E into the GKD-BT Backtest: "Input into Exit or Backtest"
Full GKD with Exits (Baseline, Volatility/Volume, Confirmation 1, Confirmation 2, Continuation, Exit, Backtest)
1. Inside the GKD-V indicator, change the "Testing Type" setting to "Chained"
2. Import the GKD-B Baseline into the GKD-V indicator: "Input into Volatility/Volume or Backtest (Baseline testing)"
3. Inside the GKD-C 1 indicator, change the "Confirmation Type" setting to "Confirmation 1"
4. Import the GKD-V indicator into the GKD-C 1 indicator: "Input into C1 or Backtest"
5. Inside the GKD-C 2 indicator, change the "Confirmation Type" setting to "Confirmation 2"
6. Import the GKD-C 1 indicator into the GKD-C 2 indicator: "Input into C2"
7. Inside the GKD-C Continuation indicator, change the "Confirmation Type" setting to "Continuation"
8. Import the GKD-C Continuation indicator into the GKD-E indicator: "Input into Exit"
9. Inside the GKD-BT Backtest, change the setting "Backtest Special" to "GKD Full w/ Exits"
10. Import the GKD-E into the GKD-BT Backtest: "Input into Backtest"
Baseline + Volatility/Volume (Baseline, Volatility/Volume, Backtest)
1. Inside the GKD-V indicator, change the "Testing Type" setting to "Baseline + Volatility/Volume"
2. Inside the GKD-V indicator, make sure the "Signal Type" setting is set to "Traditional"
3. Import the GKD-B Baseline into the GKD-V indicator: "Input into Volatility/Volume or Backtest (Baseline testing)"
4. Inside the GKD-BT Backtest, change the setting "Backtest Special" to "Baseline + Volatility/Volume"
5. Import the GKD-V into the GKD-BT Backtest: "Input into C1 or Backtest"
6. Inside the GKD-BT Backtest, change the setting "Backtest Type" to "Full". For this backtest, you must test Longs and Shorts separately
7. To allow the system to open multiple orders at one time so you can test all Longs or Shorts, open the GKD-BT Backtest, click the tab "Properties" and then insert a value of something like 10 orders into the "Pyramiding" settings. This will allow 10 orders to be opened at one time which should be enough to catch all possible Longs or Shorts.
Requirements
Inputs
Confirmation 1: GKD-V Volatility / Volume indicator
Confirmation 2: GKD-C Confirmation indicator
Continuation: GKD-C Confirmation indicator
Solo Confirmation Simple: GKD-B Baseline
Solo Confirmation Complex: GKD-V Volatility / Volume indicator
Solo Confirmation Super Complex: GKD-V Volatility / Volume indicator
Stacked 1: None
Stacked 2+: GKD-C, GKD-V, or GKD-B Stacked 1
Outputs
Confirmation 1: GKD-C Confirmation 2 indicator
Confirmation 2: GKD-C Continuation indicator
Continuation: GKD-E Exit indicator
Solo Confirmation Simple: GKD-BT Backtest
Solo Confirmation Complex: GKD-BT Backtest or GKD-E Exit indicator
Solo Confirmation Super Complex: GKD-C Continuation indicator
Stacked 1: GKD-C, GKD-V, or GKD-B Stacked 2+
Stacked 2+: GKD-C, GKD-V, or GKD-B Stacked 2+ or GKD-BT Backtest
Additional features will be added in future releases.
GKD-C Coppock Curve [Loxx]Giga Kaleidoscope GKD-C Coppock Curve Indicator is a Confirmation module included in Loxx's "Giga Kaleidoscope Modularized Trading System".
█ Giga Kaleidoscope Modularized Trading System
What is Loxx's "Giga Kaleidoscope Modularized Trading System"?
The Giga Kaleidoscope Modularized Trading System is a trading system built on the philosophy of the NNFX (No Nonsense Forex) algorithmic trading.
What is the NNFX algorithmic trading strategy?
The NNFX (No-Nonsense Forex) trading system is a comprehensive approach to Forex trading that is designed to simplify the process and remove the confusion and complexity that often surrounds trading. The system was developed by a Forex trader who goes by the pseudonym "VP" and has gained a significant following in the Forex community.
The NNFX trading system is based on a set of rules and guidelines that help traders make objective and informed decisions. These rules cover all aspects of trading, including market analysis, trade entry, stop loss placement, and trade management.
Here are the main components of the NNFX trading system:
1. Trading Philosophy: The NNFX trading system is based on the idea that successful trading requires a comprehensive understanding of the market, objective analysis, and strict risk management. The system aims to remove subjective elements from trading and focuses on objective rules and guidelines.
2. Technical Analysis: The NNFX trading system relies heavily on technical analysis and uses a range of indicators to identify high-probability trading opportunities. The system uses a combination of trend-following and mean-reverting strategies to identify trades.
3. Market Structure: The NNFX trading system emphasizes the importance of understanding the market structure, including price action, support and resistance levels, and market cycles. The system uses a range of tools to identify the market structure, including trend lines, channels, and moving averages.
4. Trade Entry: The NNFX trading system has strict rules for trade entry. The system uses a combination of technical indicators to identify high-probability trades, and traders must meet specific criteria to enter a trade.
5. Stop Loss Placement: The NNFX trading system places a significant emphasis on risk management and requires traders to place a stop loss order on every trade. The system uses a combination of technical analysis and market structure to determine the appropriate stop loss level.
6. Trade Management: The NNFX trading system has specific rules for managing open trades. The system aims to minimize risk and maximize profit by using a combination of trailing stops, take profit levels, and position sizing.
Overall, the NNFX trading system is designed to be a straightforward and easy-to-follow approach to Forex trading that can be applied by traders of all skill levels.
Core components of an NNFX algorithmic trading strategy
The NNFX algorithm is built on the principles of trend, momentum, and volatility. There are six core components in the NNFX trading algorithm:
1. Volatility - price volatility; e.g., Average True Range, True Range Double, Close-to-Close, etc.
2. Baseline - a moving average to identify price trend
3. Confirmation 1 - a technical indicator used to identify trends
4. Confirmation 2 - a technical indicator used to identify trends
5. Continuation - a technical indicator used to identify trends
6. Volatility/Volume - a technical indicator used to identify volatility/volume breakouts/breakdown
7. Exit - a technical indicator used to determine when a trend is exhausted
What is Volatility in the NNFX trading system?
In the NNFX (No Nonsense Forex) trading system, ATR (Average True Range) is typically used to measure the volatility of an asset. It is used as a part of the system to help determine the appropriate stop loss and take profit levels for a trade. ATR is calculated by taking the average of the true range values over a specified period.
True range is calculated as the maximum of the following values:
-Current high minus the current low
-Absolute value of the current high minus the previous close
-Absolute value of the current low minus the previous close
ATR is a dynamic indicator that changes with changes in volatility. As volatility increases, the value of ATR increases, and as volatility decreases, the value of ATR decreases. By using ATR in NNFX system, traders can adjust their stop loss and take profit levels according to the volatility of the asset being traded. This helps to ensure that the trade is given enough room to move, while also minimizing potential losses.
Other types of volatility include True Range Double (TRD), Close-to-Close, and Garman-Klass
What is a Baseline indicator?
The baseline is essentially a moving average, and is used to determine the overall direction of the market.
The baseline in the NNFX system is used to filter out trades that are not in line with the long-term trend of the market. The baseline is plotted on the chart along with other indicators, such as the Moving Average (MA), the Relative Strength Index (RSI), and the Average True Range (ATR).
Trades are only taken when the price is in the same direction as the baseline. For example, if the baseline is sloping upwards, only long trades are taken, and if the baseline is sloping downwards, only short trades are taken. This approach helps to ensure that trades are in line with the overall trend of the market, and reduces the risk of entering trades that are likely to fail.
By using a baseline in the NNFX system, traders can have a clear reference point for determining the overall trend of the market, and can make more informed trading decisions. The baseline helps to filter out noise and false signals, and ensures that trades are taken in the direction of the long-term trend.
What is a Confirmation indicator?
Confirmation indicators are technical indicators that are used to confirm the signals generated by primary indicators. Primary indicators are the core indicators used in the NNFX system, such as the Average True Range (ATR), the Moving Average (MA), and the Relative Strength Index (RSI).
The purpose of the confirmation indicators is to reduce false signals and improve the accuracy of the trading system. They are designed to confirm the signals generated by the primary indicators by providing additional information about the strength and direction of the trend.
Some examples of confirmation indicators that may be used in the NNFX system include the Bollinger Bands, the MACD (Moving Average Convergence Divergence), and the MACD Oscillator. These indicators can provide information about the volatility, momentum, and trend strength of the market, and can be used to confirm the signals generated by the primary indicators.
In the NNFX system, confirmation indicators are used in combination with primary indicators and other filters to create a trading system that is robust and reliable. By using multiple indicators to confirm trading signals, the system aims to reduce the risk of false signals and improve the overall profitability of the trades.
What is a Continuation indicator?
In the NNFX (No Nonsense Forex) trading system, a continuation indicator is a technical indicator that is used to confirm a current trend and predict that the trend is likely to continue in the same direction. A continuation indicator is typically used in conjunction with other indicators in the system, such as a baseline indicator, to provide a comprehensive trading strategy.
What is a Volatility/Volume indicator?
Volume indicators, such as the On Balance Volume (OBV), the Chaikin Money Flow (CMF), or the Volume Price Trend (VPT), are used to measure the amount of buying and selling activity in a market. They are based on the trading volume of the market, and can provide information about the strength of the trend. In the NNFX system, volume indicators are used to confirm trading signals generated by the Moving Average and the Relative Strength Index. Volatility indicators include Average Direction Index, Waddah Attar, and Volatility Ratio. In the NNFX trading system, volatility is a proxy for volume and vice versa.
By using volume indicators as confirmation tools, the NNFX trading system aims to reduce the risk of false signals and improve the overall profitability of trades. These indicators can provide additional information about the market that is not captured by the primary indicators, and can help traders to make more informed trading decisions. In addition, volume indicators can be used to identify potential changes in market trends and to confirm the strength of price movements.
What is an Exit indicator?
The exit indicator is used in conjunction with other indicators in the system, such as the Moving Average (MA), the Relative Strength Index (RSI), and the Average True Range (ATR), to provide a comprehensive trading strategy.
The exit indicator in the NNFX system can be any technical indicator that is deemed effective at identifying optimal exit points. Examples of exit indicators that are commonly used include the Parabolic SAR, the Average Directional Index (ADX), and the Chandelier Exit.
The purpose of the exit indicator is to identify when a trend is likely to reverse or when the market conditions have changed, signaling the need to exit a trade. By using an exit indicator, traders can manage their risk and prevent significant losses.
In the NNFX system, the exit indicator is used in conjunction with a stop loss and a take profit order to maximize profits and minimize losses. The stop loss order is used to limit the amount of loss that can be incurred if the trade goes against the trader, while the take profit order is used to lock in profits when the trade is moving in the trader's favor.
Overall, the use of an exit indicator in the NNFX trading system is an important component of a comprehensive trading strategy. It allows traders to manage their risk effectively and improve the profitability of their trades by exiting at the right time.
How does Loxx's GKD (Giga Kaleidoscope Modularized Trading System) implement the NNFX algorithm outlined above?
Loxx's GKD v1.0 system has five types of modules (indicators/strategies). These modules are:
1. GKD-BT - Backtesting module (Volatility, Number 1 in the NNFX algorithm)
2. GKD-B - Baseline module (Baseline and Volatility/Volume, Numbers 1 and 2 in the NNFX algorithm)
3. GKD-C - Confirmation 1/2 and Continuation module (Confirmation 1/2 and Continuation, Numbers 3, 4, and 5 in the NNFX algorithm)
4. GKD-V - Volatility/Volume module (Confirmation 1/2, Number 6 in the NNFX algorithm)
5. GKD-E - Exit module (Exit, Number 7 in the NNFX algorithm)
(additional module types will added in future releases)
Each module interacts with every module by passing data between modules. Data is passed between each module as described below:
GKD-B => GKD-V => GKD-C(1) => GKD-C(2) => GKD-C(Continuation) => GKD-E => GKD-BT
That is, the Baseline indicator passes its data to Volatility/Volume. The Volatility/Volume indicator passes its values to the Confirmation 1 indicator. The Confirmation 1 indicator passes its values to the Confirmation 2 indicator. The Confirmation 2 indicator passes its values to the Continuation indicator. The Continuation indicator passes its values to the Exit indicator, and finally, the Exit indicator passes its values to the Backtest strategy.
This chaining of indicators requires that each module conform to Loxx's GKD protocol, therefore allowing for the testing of every possible combination of technical indicators that make up the six components of the NNFX algorithm.
What does the application of the GKD trading system look like?
Example trading system:
Backtest: Strategy with 1-3 take profits, trailing stop loss, multiple types of PnL volatility, and 2 backtesting styles
Baseline: Hull Moving Average
Volatility/Volume: Hurst Exponent
Confirmation 1: Coppock Curve Indicator as shown on the chart above
Confirmation 2: Williams Percent Range
Continuation: Fisher Transform
Exit: Rex Oscillator
Each GKD indicator is denoted with a module identifier of either: GKD-BT, GKD-B, GKD-C, GKD-V, or GKD-E. This allows traders to understand to which module each indicator belongs and where each indicator fits into the GKD protocol chain.
Giga Kaleidoscope Modularized Trading System Signals (based on the NNFX algorithm)
Standard Entry
1. GKD-C Confirmation 1 Signal
2. GKD-B Baseline agrees
3. Price is within a range of 0.2x Volatility and 1.0x Volatility of the Goldie Locks Mean
4. GKD-C Confirmation 2 agrees
5. GKD-V Volatility/Volume agrees
Baseline Entry
1. GKD-B Baseline signal
2. GKD-C Confirmation 1 agrees
3. Price is within a range of 0.2x Volatility and 1.0x Volatility of the Goldie Locks Mean
4. GKD-C Confirmation 2 agrees
5. GKD-V Volatility/Volume agrees
6. GKD-C Confirmation 1 signal was less than 7 candles prior
Volatility/Volume Entry
1. GKD-V Volatility/Volume signal
2. GKD-C Confirmation 1 agrees
3. Price is within a range of 0.2x Volatility and 1.0x Volatility of the Goldie Locks Mean
4. GKD-C Confirmation 2 agrees
5. GKD-B Baseline agrees
6. GKD-C Confirmation 1 signal was less than 7 candles prior
Continuation Entry
1. Standard Entry, Baseline Entry, or Pullback; entry triggered previously
2. GKD-B Baseline hasn't crossed since entry signal trigger
3. GKD-C Confirmation Continuation Indicator signals
4. GKD-C Confirmation 1 agrees
5. GKD-B Baseline agrees
6. GKD-C Confirmation 2 agrees
1-Candle Rule Standard Entry
1. GKD-C Confirmation 1 signal
2. GKD-B Baseline agrees
3. Price is within a range of 0.2x Volatility and 1.0x Volatility of the Goldie Locks Mean
Next Candle:
1. Price retraced (Long: close < close or Short: close > close )
2. GKD-B Baseline agrees
3. GKD-C Confirmation 1 agrees
4. GKD-C Confirmation 2 agrees
5. GKD-V Volatility/Volume agrees
1-Candle Rule Baseline Entry
1. GKD-B Baseline signal
2. GKD-C Confirmation 1 agrees
3. Price is within a range of 0.2x Volatility and 1.0x Volatility of the Goldie Locks Mean
4. GKD-C Confirmation 1 signal was less than 7 candles prior
Next Candle:
1. Price retraced (Long: close < close or Short: close > close )
2. GKD-B Baseline agrees
3. GKD-C Confirmation 1 agrees
4. GKD-C Confirmation 2 agrees
5. GKD-V Volatility/Volume Agrees
1-Candle Rule Volatility/Volume Entry
1. GKD-V Volatility/Volume signal
2. GKD-C Confirmation 1 agrees
3. Price is within a range of 0.2x Volatility and 1.0x Volatility of the Goldie Locks Mean
4. GKD-C Confirmation 1 signal was less than 7 candles prior
Next Candle:
1. Price retraced (Long: close < close or Short: close > close)
2. GKD-B Volatility/Volume agrees
3. GKD-C Confirmation 1 agrees
4. GKD-C Confirmation 2 agrees
5. GKD-B Baseline agrees
PullBack Entry
1. GKD-B Baseline signal
2. GKD-C Confirmation 1 agrees
3. Price is beyond 1.0x Volatility of Baseline
Next Candle:
1. Price is within a range of 0.2x Volatility and 1.0x Volatility of the Goldie Locks Mean
2. GKD-C Confirmation 1 agrees
3. GKD-C Confirmation 2 agrees
4. GKD-V Volatility/Volume Agrees
]█ Setting up the GKD
The GKD system involves chaining indicators together. These are the steps to set this up.
Use a GKD-C indicator alone on a chart
1. Inside the GKD-C indicator, change the "Confirmation Type" setting to "Solo Confirmation Simple"
Use a GKD-V indicator alone on a chart
**nothing, it's already useable on the chart without any settings changes
Use a GKD-B indicator alone on a chart
**nothing, it's already useable on the chart without any settings changes
Baseline (Baseline, Backtest)
1. Import the GKD-B Baseline into the GKD-BT Backtest: "Input into Volatility/Volume or Backtest (Baseline testing)"
2. Inside the GKD-BT Backtest, change the setting "Backtest Special" to "Baseline"
Volatility/Volume (Volatility/Volume, Backte st)
1. Inside the GKD-V indicator, change the "Testing Type" setting to "Solo"
2. Inside the GKD-V indicator, change the "Signal Type" setting to "Crossing" (neither traditional nor both can be backtested)
3. Import the GKD-V indicator into the GKD-BT Backtest: "Input into C1 or Backtest"
4. Inside the GKD-BT Backtest, change the setting "Backtest Special" to "Volatility/Volume"
5. Inside the GKD-BT Backtest, a) change the setting "Backtest Type" to "Trading" if using a directional GKD-V indicator; or, b) change the setting "Backtest Type" to "Full" if using a directional or non-directional GKD-V indicator (non-directional GKD-V can only test Longs and Shorts separately)
6. If "Backtest Type" is set to "Full": Inside the GKD-BT Backtest, change the setting "Backtest Side" to "Long" or "Short
7. If "Backtest Type" is set to "Full": To allow the system to open multiple orders at one time so you test all Longs or Shorts, open the GKD-BT Backtest, click the tab "Properties" and then insert a value of something like 10 orders into the "Pyramiding" settings. This will allow 10 orders to be opened at one time which should be enough to catch all possible Longs or Shorts.
Solo Confirmation Simple (Confirmation, Backtest)
1. Inside the GKD-C indicator, change the "Confirmation Type" setting to "Solo Confirmation Simple"
1. Import the GKD-C indicator into the GKD-BT Backtest: "Input into Backtest"
2. Inside the GKD-BT Backtest, change the setting "Backtest Special" to "Solo Confirmation Simple"
Solo Confirmation Complex without Exits (Baseline, Volatility/Volume, Confirmation, Backtest)
1. Inside the GKD-V indicator, change the "Testing Type" setting to "Chained"
2. Import the GKD-B Baseline into the GKD-V indicator: "Input into Volatility/Volume or Backtest (Baseline testing)"
3. Inside the GKD-C indicator, change the "Confirmation Type" setting to "Solo Confirmation Complex"
4. Import the GKD-V indicator into the GKD-C indicator: "Input into C1 or Backtest"
5. Inside the GKD-BT Backtest, change the setting "Backtest Special" to "GKD Full wo/ Exits"
6. Import the GKD-C into the GKD-BT Backtest: "Input into Exit"
Solo Confirmation Complex with Exits (Baseline, Volatility/Volume, Confirmation, Exit, Backtest)
1. Inside the GKD-V indicator, change the "Testing Type" setting to "Chained"
2. Import the GKD-B Baseline into the GKD-V indicator: "Input into Volatility/Volume or Backtest (Baseline testing)"
3. Inside the GKD-C indicator, change the "Confirmation Type" setting to "Solo Confirmation Complex"
4. Import the GKD-V indicator into the GKD-C indicator: "Input into C1 or Backtest"
5. Import the GKD-C indicator into the GKD-E indicator: "Input into Exit"
6. Inside the GKD-BT Backtest, change the setting "Backtest Special" to "GKD Full w/ Exits"
7. Import the GKD-E into the GKD-BT Backtest: "Input into Backtest"
Full GKD without Exits (Baseline, Volatility/Volume, Confirmation 1, Confirmation 2, Continuation, Backtest)
1. Inside the GKD-V indicator, change the "Testing Type" setting to "Chained"
2. Import the GKD-B Baseline into the GKD-V indicator: "Input into Volatility/Volume or Backtest (Baseline testing)"
3. Inside the GKD-C 1 indicator, change the "Confirmation Type" setting to "Confirmation 1"
4. Import the GKD-V indicator into the GKD-C 1 indicator: "Input into C1 or Backtest"
5. Inside the GKD-C 2 indicator, change the "Confirmation Type" setting to "Confirmation 2"
6. Import the GKD-C 1 indicator into the GKD-C 2 indicator: "Input into C2"
7. Inside the GKD-C Continuation indicator, change the "Confirmation Type" setting to "Continuation"
8. Inside the GKD-BT Backtest, change the setting "Backtest Special" to "GKD Full wo/ Exits"
9. Import the GKD-E into the GKD-BT Backtest: "Input into Exit"
Full GKD with Exits (Baseline, Volatility/Volume, Confirmation 1, Confirmation 2, Continuation, Exit, Backtest)
1. Inside the GKD-V indicator, change the "Testing Type" setting to "Chained"
2. Import the GKD-B Baseline into the GKD-V indicator: "Input into Volatility/Volume or Backtest (Baseline testing)"
3. Inside the GKD-C 1 indicator, change the "Confirmation Type" setting to "Confirmation 1"
4. Import the GKD-V indicator into the GKD-C 1 indicator: "Input into C1 or Backtest"
5. Inside the GKD-C 2 indicator, change the "Confirmation Type" setting to "Confirmation 2"
6. Import the GKD-C 1 indicator into the GKD-C 2 indicator: "Input into C2"
7. Inside the GKD-C Continuation indicator, change the "Confirmation Type" setting to "Continuation"
8. Import the GKD-C Continuation indicator into the GKD-E indicator: "Input into Exit"
9. Inside the GKD-BT Backtest, change the setting "Backtest Special" to "GKD Full w/ Exits"
10. Import the GKD-E into the GKD-BT Backtest: "Input into Backtest"
Baseline + Volatility/Volume (Baseline, Volatility/Volume, Backtest)
1. Inside the GKD-V indicator, change the "Testing Type" setting to "Baseline + Volatility/Volume"
2. Inside the GKD-V indicator, make sure the "Signal Type" setting is set to "Traditional"
3. Import the GKD-B Baseline into the GKD-V indicator: "Input into Volatility/Volume or Backtest (Baseline testing)"
4. Inside the GKD-BT Backtest, change the setting "Backtest Special" to "Baseline + Volatility/Volume"
5. Import the GKD-V into the GKD-BT Backtest: "Input into C1 or Backtest"
6. Inside the GKD-BT Backtest, change the setting "Backtest Type" to "Full". For this backtest, you must test Longs and Shorts separately
7. To allow the system to open multiple orders at one time so you can test all Longs or Shorts, open the GKD-BT Backtest, click the tab "Properties" and then insert a value of something like 10 orders into the "Pyramiding" settings. This will allow 10 orders to be opened at one time which should be enough to catch all possible Longs or Shorts.
█ GKD-C Coppock Curve Indicator
What is the Coppock Curve Indicator?
The Coppock Curve is a technical analysis indicator developed by economist Edwin Sedgwick Coppock in 1962. It is primarily used to identify long-term buying opportunities in the stock market, particularly for identifying the start of bull markets after significant market declines. The Coppock Curve is a momentum-based oscillator that aims to signal the end of a bear market and the beginning of a new uptrend.
The calculation of the Coppock Curve involves a few steps:
Calculate the 14-month Rate of Change (ROC) for the price index. ROC is the percentage change in the price index over a specific period (14 months in this case).
Calculate the 11-month Rate of Change (ROC) for the price index.
Add the 14-month ROC and the 11-month ROC.
Apply a 10-period weighted moving average (WMA) to the sum of the two ROCs. The weighted moving average places more emphasis on recent data points.
The Coppock Curve generates a buy signal when it crosses above the zero line, indicating the start of a new bull market or a recovery from a bear market. Conversely, a sell signal is not explicitly provided by the indicator, as its primary purpose is to identify long-term buying opportunities rather than short-term trading signals. However, some traders might use a cross below the zero line as a signal to sell or exit long positions.
It is essential to note that the Coppock Curve is a lagging indicator, meaning that it is based on historical data and may not be the most timely predictor of market trends. Furthermore, like any technical analysis tool, the Coppock Curve should be used in conjunction with other indicators and analysis methods to maximize its effectiveness and minimize the risk of false signals.
Requirements
Inputs
Confirmation 1: GKD-V Volatility / Volume indicator
Confirmation 2: GKD-C Confirmation indicator
Continuation: GKD-C Confirmation indicator
Solo Confirmation Simple: GKD-B Baseline
Solo Confirmation Complex: GKD-V Volatility / Volume indicator
Solo Confirmation Super Complex: GKD-V Volatility / Volume indicator
Stacked 1: None
Stacked 2+: GKD-C, GKD-V, or GKD-B Stacked 1
Outputs
Confirmation 1: GKD-C Confirmation 2 indicator
Confirmation 2: GKD-C Continuation indicator
Continuation: GKD-E Exit indicator
Solo Confirmation Simple: GKD-BT Backtest
Solo Confirmation Complex: GKD-BT Backtest or GKD-E Exit indicator
Solo Confirmation Super Complex: GKD-C Continuation indicator
Stacked 1: GKD-C, GKD-V, or GKD-B Stacked 2+
Stacked 2+: GKD-C, GKD-V, or GKD-B Stacked 2+ or GKD-BT Backtest
Additional features will be added in future releases.
Bollinger Bands Weighted Alert System (BBWAS)The idea of this indicator is very similar to my previous published script called BBAS (Bollinger Bands Alert System).
Just with little additions. In this case, we're using a Weighted Moving Average (ta.wma) instead of Simple Moving Average to calculate the basis line.
A breakout in trading refers to a situation where the price of a security or asset moves beyond a defined level of support or resistance, which is typically indicated by technical analysis tools like Bollinger Bands. Bollinger Bands consist of three lines: the upper band, the lower band, and the middle band (or basis). The upper and lower bands are set at a specified number of standard deviations away from the middle band, and they help to define the range within which the price of an asset is expected to fluctuate.
When the price of the asset moves beyond the upper or lower band, it is said to have "broken out" of the range. If the price closes below the lower band, it is considered a bearish breakout, and if it closes above the upper band, it is considered a bullish breakout.
Once a breakout occurs, traders may look for a confirmation signal before entering a trade. In this case, crossing the middle line (or basis) after a breakout may signal a potential trend reversal and a good opportunity to enter a long or short trade, depending on the direction of the breakout.
Dear traders, while we strive to provide you with the best trading tools and resources, we want to remind you to exercise caution and diligence in your investing decisions.
It is important to always do your own research and analysis before making any trades. Remember, the responsibility for your investments ultimately lies with you.
Happy trading!