ETH/USD Perpetual – Market Assessment
Key Zones
Demand: 4737 – 4895
Supply: 3818 – 3994
Fair Value Gaps (FVGs): 4433, 4326
Anchored Volume Node: 4300 (significant liquidity cluster)
Psychological Levels: 4000, 4500, 5000
Recent Swing Points: High 4753, Low 3821
Technical Structure
High-Time Frame (HTF) Analysis:
Pattern: Bullish flag
Interpretation: Indicates potential continuation to the upside if price breaks above the flag resistance.
Daily-Time Frame (DTF) Analysis:
Pattern: Bearish channel
Interpretation: Suggests a slightly bearish pressure on the daily trend; caution required for long positions.
Volume and Liquidity:
Anchored volume node at 4300 aligns closely with FVGs at 4326 and 4433 – this area may act as strong support on pullbacks.
Scenario Planning
Bullish Scenario:
Price holds above demand zone (4737–4895).
Break above recent swing high at 4753 confirms bullish momentum.
Potential targets: 4895, 5000 psychological resistance.
Pullbacks likely to find support at FVGs (4433, 4326) or volume node (4300).
Bearish Scenario:
Price fails to hold demand zone and breaks below recent swing low 3821.
Next support: supply zone 3818–3994, then psychological level at 4000.
FVGs and volume node may temporarily slow the downside movement.
Summary / Notes
HTF indicates bullish continuation potential; daily trend shows bearish pressure.
Demand and supply zones, FVGs, and volume nodes are key levels for trade planning.
Monitor price reactions at swing points, psychological levels, and liquidity clusters to confirm trade setups.
Trade management should consider both bullish and bearish contingencies, with SLs placed near key FVGs or volume nodes.
Nota
Price rejected perfectly off the 50% line in the First FVG - This is showing a strong recovery however there is still the resistance it must test. Nota
Eth has tagged both FVG's and converted one of them into an IFVG. Price now looks bullish with a quick surge to the resistance. However we are still to await the close.. Eth tested the POC line perfectly, this was a good entry for quick longs/scalps.
Trade chiuso: obiettivo raggiunto
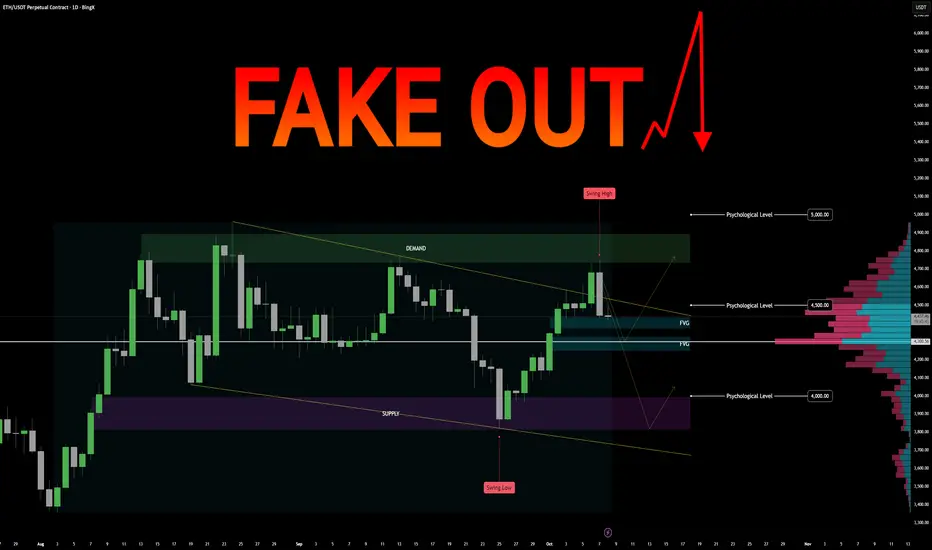
As PREDICTED! (Also thanks to trumps 100% tarrif)ETH CRASHED, with a MAJOR FAKEOUT
Declinazione di responsabilità
Le informazioni ed i contenuti pubblicati non costituiscono in alcun modo una sollecitazione ad investire o ad operare nei mercati finanziari. Non sono inoltre fornite o supportate da TradingView. Maggiori dettagli nelle Condizioni d'uso.
Declinazione di responsabilità
Le informazioni ed i contenuti pubblicati non costituiscono in alcun modo una sollecitazione ad investire o ad operare nei mercati finanziari. Non sono inoltre fornite o supportate da TradingView. Maggiori dettagli nelle Condizioni d'uso.