1. Current Price Structure
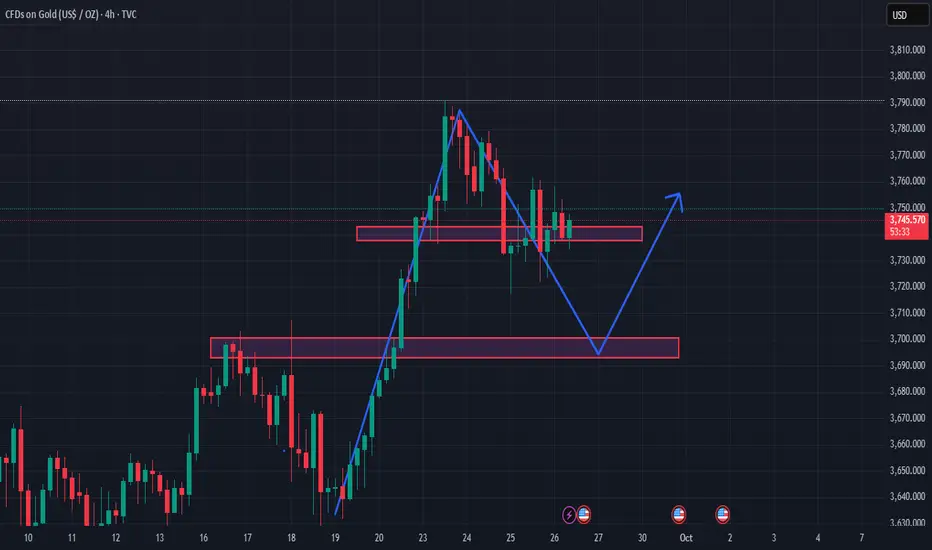
Gold has formed a strong bullish wave (rallying from the 3,680 zone to nearly 3,790).
Afterwards, a sharp decline occurred → creating a new high but quickly rejected.
At present, the price is consolidating sideways within a narrow support–resistance zone around 3,740 – 3,755.
2. Key Support – Resistance Levels
Near-term resistance: 3,755 – 3,760 (recent minor high).
Near-term support: 3,735 – 3,740 (area repeatedly tested).
Stronger support: 3,695 – 3,705 (potential retracement target with liquidity and previous accumulation zone).
3. Price Scenarios
Scenario 1 (primary): Price breaks below the current support → drops to retest the 3,695 – 3,705 zone → then bounces back up. This is a potential “demand zone” where buyers may return.
Scenario 2 (less likely): Price holds the 3,740 support and rallies immediately → however, current buying pressure seems insufficient to sustain this move.
4. Trading Implications
The 3,695 – 3,705 zone is a potential buy area if bullish reversal candlestick patterns appear.
If price clearly breaks below 3,695, the short-term trend could turn bearish with a target toward 3,660.
In the short term, the market is still in a corrective phase after the previous bullish rally → not ideal to “chase buys” around 3,740.
👉 In summary: The chart suggests the price is more likely to dip toward the 3,700 demand zone before bouncing back up. The 3,740 zone is only a temporary buffer, not strong enough for a major reversal.
✅MY FREE FOREX & XAUUSD SIGNALS TELEGRAM CHANNEL:
t.me/+xkPoUfOB8BsyMzRl
🔴9-12 signals per day
🔴Free knowledge support
🔴24/7 support for newbies.
🔴You always have priority.
FXWARRIOR 😘
t.me/+xkPoUfOB8BsyMzRl
🔴9-12 signals per day
🔴Free knowledge support
🔴24/7 support for newbies.
🔴You always have priority.
FXWARRIOR 😘
Pubblicazioni correlate
Declinazione di responsabilità
Le informazioni e le pubblicazioni non sono intese come, e non costituiscono, consulenza o raccomandazioni finanziarie, di investimento, di trading o di altro tipo fornite o approvate da TradingView. Per ulteriori informazioni, consultare i Termini di utilizzo.