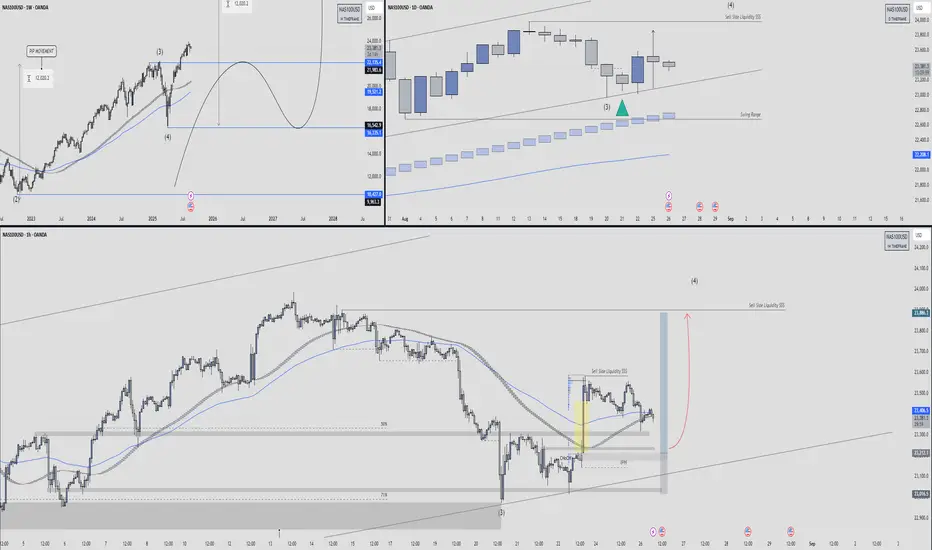
🕰 Weekly Structure
Price has completed a Wave (3) high and is now transitioning into a corrective Wave (4) phase.
The broader market cycle suggests sell-side liquidity is being targeted before any new impulsive leg higher.
The EMA structure is still bullish long-term, but retracements are healthy after extended rallies.
Key downside zones:
21,985 – 22,135 (mid-support pocket)
16,962 – 16,353 (deeper retracement if correction extends)
📉 Daily Timeframe
Current daily candles are rejecting the upper levels after tagging swing-high liquidity.
Price is consolidating near the swing range support line (~22,700–23,200).
Buyers are defending the level marked by the green triangle, aligning with a previous Wave (3) pivot.
If this level holds, we may see a relief rally targeting 23,800–24,200 before deciding the next move.
⏱ 1H Short-Term View
Price recently tapped into sell-side liquidity (SSS) and bounced from the 71% fib retracement + demand zone.
A change of character (ChoCH) is visible from the highlighted yellow candle, indicating buyers are stepping in.
Expect a possible bullish leg toward 23,800 – 24,000 if higher-low structure confirms.
If 23,200 fails, downside liquidity sits at 23,000 → 22,700.
🎯 Trade Plan
Bias: Short-term bullish relief rally inside larger corrective Wave (4).
Entry Zone: 23,200 – 23,400 demand retest.
Target 1: 23,800 (SS liquidity pocket)
Target 2: 24,000–24,200 (daily resistance)
Invalidation: Sustained close below 23,000 → opens path to 22,200.
📌 Summary
NAS100 looks corrective after a strong multi-month bullish wave. Near-term, liquidity sweep setups favor a bounce into 23,800+ as long as 23,000 holds. Medium-term, Wave (4) correction could extend deeper into 22k–20k levels before the next major bullish wave.
Declinazione di responsabilità
Le informazioni ed i contenuti pubblicati non costituiscono in alcun modo una sollecitazione ad investire o ad operare nei mercati finanziari. Non sono inoltre fornite o supportate da TradingView. Maggiori dettagli nelle Condizioni d'uso.
Declinazione di responsabilità
Le informazioni ed i contenuti pubblicati non costituiscono in alcun modo una sollecitazione ad investire o ad operare nei mercati finanziari. Non sono inoltre fornite o supportate da TradingView. Maggiori dettagli nelle Condizioni d'uso.