ROE ValuationAn indicator that can be used to study ROE Valuation for stocks.
Red color means the market price is higher than the valuation whereas green color means the market price is below the valuation and it might be a good opportunity for value traders. Gray color indicates non-applicable results, when valuation is below zero for example.
Analysis

PE ValuationAn indicator that can be used to study PE Valuation for stocks.
When the reported EPS for a company is non-positive the line turns gray. Red color means the market price is higher than the valuation whereas green color means the market price is below the valuation and it might be a good opportunity for value traders.

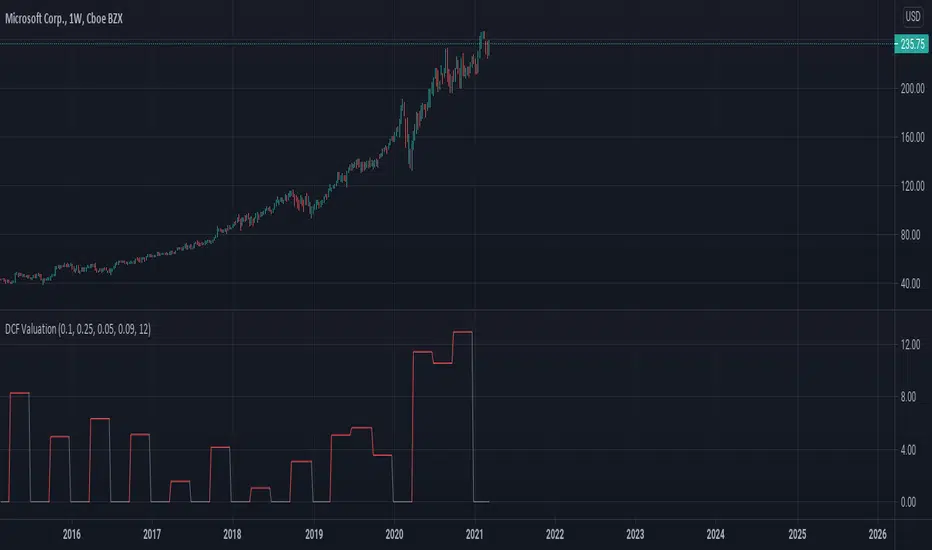
DCF ValuationAn indicator that can be used to study Discounted Cash Flow Valuation for stocks.
When the reported Free Cash Flow for a company is non-positive the line turns gray. Red color means the market price is higher than the valuation whereas green color means the market price is below the valuation and it might be a good opportunity for value traders.
Financial Highlights [Fundamentals]█ OVERVIEW
This indicator plot basic key financial data to imitate the presentation format of several popular finance site, make it easier for a quick glance of overall company financial health without switching tabs for every single stocks.
█ Financial Data Available:
- Revenue & PAT (Profit after Tax)
- Net Profit Margin (%)
- Gross Profit Margin (%)
- Earnings Per Share (EPS)
- Dividend
█ Features:
- Toggle between Quarter/Annual Financial Data (Notes: For Dividends, it will always be plotted based on Annual data, at Financial Year ending period)
- Options to plot at either at Quarter/Yearly ending period OR Financial Data published date
█ Limitation
- The accuracy of the data subject to Tradingview's source, but from my observation it's accurate 95% of the time
- Recently published data might not be available immediately. e.g. MYX exchange tends to have 1-3 days lag
- More information on Tradingview's financial data can be read here -> www.tradingview.com
█ Disclaimer
Past performance is not an indicator of future results.
My opinions and research are my own and do not constitute financial advice in any way whatsoever.
Nothing published by me constitutes an investment recommendation, nor should any data or Content published by me be relied upon for any investment/trading activities.
I strongly recommends that you perform your own independent research and/or speak with a qualified investment professional before making any financial decisions.
Any ideas to further improve this indicator are welcome :)

Volume Treshold [UTS]Volume Treshold
Helps to identify periods of high and low volume.
This information can be used to evaluate market trends and to determine trade entries and exits.
Note: this only works on charts with volume information available
Treshold line changes color if a candle is more than x percent of the average volume of the last n candles
Treshold line changes color back to gray again if volume falls below the treshold
A lookback period defines how many bars should be taken into consideration
% that causes it to be triggered settable in decimals up to 3.5 where 1.0 equals to 100%
Colour to change the volume bar to can be set via menu
Ability to show the treshold as visualized drawing over the histogram as line or area
Ability to choose smoothing method for treshold calculation (SMA | EMA)
An optional Simple Moving Average of the volume data can be added to the chart.

Statistical and Financial MetricsGood morning traders!
This time I want to share with you a little script that, thanks to the use of arrays, allows you to have interesting statistical and financial insights taken from the symbol on chart and compared to those of another symbol you desire (in this case the metrics taken from the perpetual future ETHUSDT are compared to those taken from the perpetual future BTCUSDT, used as a proxy for the direction of cryptocurrency market)
By enabling "prevent repainting", the data retrieved from the compared symbol won't be on real time but they will static since they will belong to the previous closed candle
Here are the metrics you can have by storing data from a variable period of candles (by default 51):
✓ Variance (of the symbol on chart in GREEN; of the compared symbol in WHITE)
✓ Standard Deviation (of the symbol on chart in OLIVE; of the compared symbol in SILVER)
✓ Yelds (of the symbol on chart in LIME; of the compared symbol in GRAY) → yelds are referred to the previous close, so they would be calculated as the the difference between the current close and the previous one all divided by the previous close
✓ Covariance of the two datasets (in BLUE)
✓ Correlation coefficient of the two datasets (in AQUA)
✓ β (in RED) → this insight is calculated in three alternative ways for educational purpose (don't worry, the output would be the same).
WHAT IS BETA (β)?
The BETA of an asset can be interpretated as the representation (in relative terms) of the systematic risk of an asset: in other terms, it allows you to understand how big is the risk (not eliminable with portfolio diversification) of an asset based on the volatilty of its yelds.
We say that this representation is made in relative terms since it is expressed according to the market portfolio: this portfolio is hypothetically the portfolio which maximizes the diversification effects in order to kill all the specific risk of that portfolio; in this way the standard deviation calculated from the yelds of this portfolio will represent just the not-eliminable risk (the systematic risk), without including the eliminable risk (the specific risk).
The BETA of an asset is calculated as the volatilty of this asset around the volatilty of the market portfolio: being more precise, it is the covariance between the yelds of the current asset and those of the market portfolio all divided by the variance of the yelds of market portfolio.
Covariance is calculated as the product between correlation coefficient, standard deviation of the first dataset and standard deviation of the second asset.
So, as the correlation coefficient and the standard deviation of the yelds of our asset increase (it means that the yelds of our asset are very similiar to those of th market portfolio in terms of sign and intensity and that the volatility of these yelds is quite high), the value of BETA increases as well
According to the Capital Asset Pricing Model (CAPM) promoted by William Sharpe (the guy of the "Sharpe Ratio") and Harry Markowitz, in efficient markets the yeld of an asset can be calculated as the sum between the risk-free interest rate and the risk premium. The risk premium of the specific asset would be the risk premium of the market portfolio multiplied with the value of beta. It is simple: if the volatility of the yelds of an asset around the yelds of market protfolio are particularly high, investors would ask for a higher risk premium that would be translated in a higher yeld.
In this way the expected yeld of an asset would be calculated from the linear expression of the "Security Market Line": r_i = r_f + β*(r_m-r_f)
where:
r_i = expected yeld of the asset
r_f = risk free interest rate
β = beta
r_m = yeld of market portfolio
I know that considering Bitcoin as a proxy of the market portfolio involved in the calculation of Beta would be an inaccuracy since it doesn't have the property of maximum diversification (since it is a single asset), but there's no doubt that it's tying the prices of altcoins (upward and downward) thanks to the relevance of its dominance in the capitalization of cryptocurrency market. So, in the lack of a good index of cryptocurrencies (as the FTSE MIB for the italian stock market), and as long the dominance of Bitcoin will persist with this intensity, we can use Bitcoin as a proxy of the market portfolio

The WWG Plan Indicator V2█ OVERALL
This indicator was specifically created for the Walsh Wealth Group.
In short it is a fusion of some of the most basic and widely used indicators to show overbought patterns and trend reversals.
Its best usage is with LTF scalping and agressive profit taking but can also be used to find HTF dips and buy-zones.
█ FEATURES
Buy Signal (Buy):
Printed only with all confirmations triggered
Small Buy Signal (B1 & B2)
Printed if some of the confirmations are triggered and can be treated as DCA entries or for further
confirmation with other indicators and basic TA.
Crayons (Color Bars):
Blue: RSI is oversold
Olive: RSI and Stoch RSI are oversold
Yellow: RSI, Stoch RSI are oversold and lower Bollinger Bands are crossed by Low
Orange: RSI, Stoch RSI and CCI are oversold
Trailing SL:
If activated in the config, a trailing SL can be displayed on the chart based on ATR.
█ SETTINGS
The underlying indicators used are RSI, Stoch RSI, Bollinger Bands, MACD and CCI.
All possible configs can be changed in the config settings.
█ GENERAL INFORMATION
Depending on the settings, the indicator performance will be highly affected.
This indicator is only displaying highly oversold areas and events of trend reversal it is not a *God*-Signal and will print false positives.
█ ALERTS
An alert for the main buy-signal is implemented and can be used via the TV alert functionality.

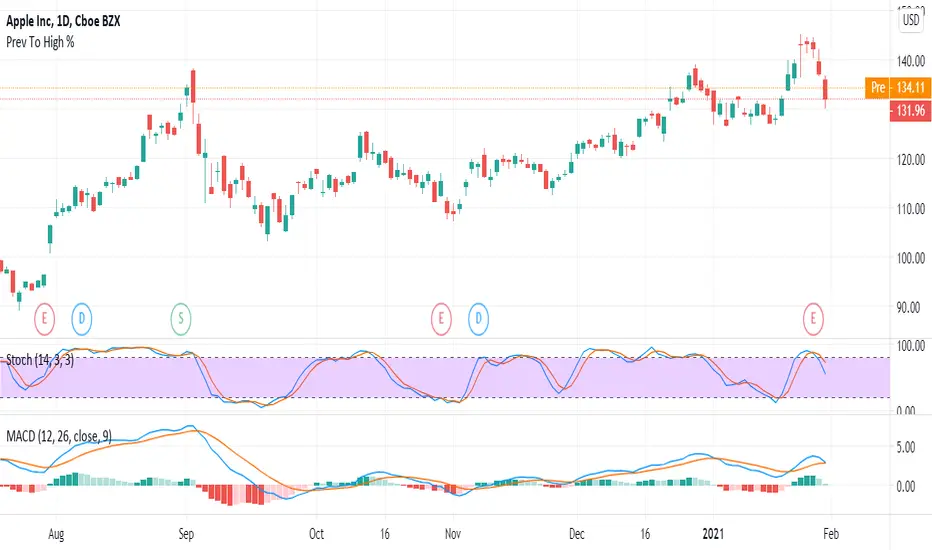
Previous Close To Current High Percentage Per CandleGet the percentage of previous candle price to current high candle price.
This script will make your life easier to get percentage without you calculating it.
Hope you enjoy the tool and let me know if there is any feedback or improvement request.
Thank you very much. :D
--------------------------------
Formula:
Previous To High Percentage Per Candle = (high - previous / previous) * 100%
--------------------------------
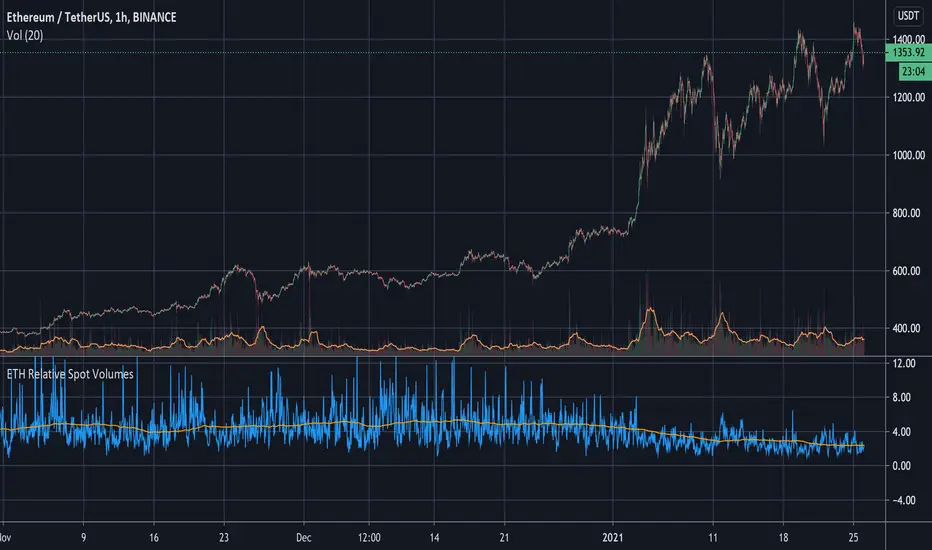
ETH Relative Spot VolumesCompares ETHUSD spot market volumes to ETHUSD perpetual swap volumes.
A higher ratio indicates higher spot buying interest and a more sustained growth overall.
Rallies-driven by spot are deemed more resilient to being affected by high funding rates on futures markets. The long-term trend seems to be increased derivatives volume on ETHUSD contracts making spikes of spot interest more noticeable.
A 200-period Simple Moving Average is applied to indicate a long-term trend.
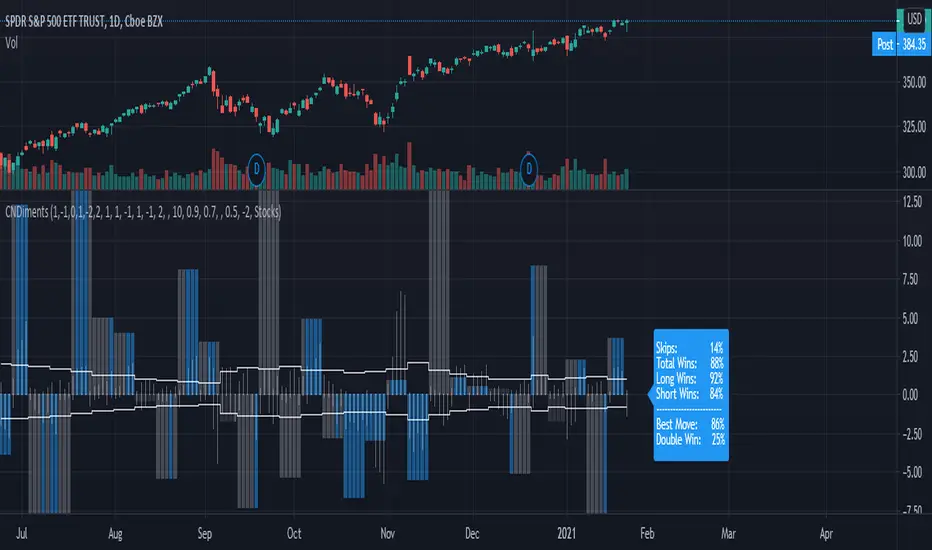
Weekly Sentiment AnalysisThis script plots weekly scores derived from sentiment analysis and computes some stats on the history.
While this can be viewed on any timeframe, the stats are best viewed on the Daily timeframe, weekly and intraday charts produce some discrepancies.
Columns show the weekly score. If the column is blue, the high/low of that candle surpassed the target price.
White bars in the columns show the % change from the open price to the high of that candle.
Horizontal line shows the % above the weekly open that must be reached for a win.
The display after the most recent week shows stats across all weeks.
Skips is the percent of weeks that were skipped because they didn't meet the score threshold
Total Wins is the number of wins divided by the number of non-skipped weeks
Long Wins is the number of long wins divided by the number of non-skipped weeks
Short Wins is the number of short wins divided by the number of non-skipped weeks
Best Move is the number of weeks where the score predicted the biggest move, even if target wasn't hit, divided by the total number of weeks
Double Win is the number of weeks where both the Long and Short targets were hit, divided by the total number of weeks
Settings
The first section of inputs define how much each type of sentiment is weighted.
The second section defines the win criteria. By default the daily ATR(average true range) is used to define a percent above or below the opening price that the price much reach during the week in order to be considered a win.
ATR Lookback : How many days back the ATR is average over.
Long ATR Multiplier : ATR is multiplied by this value and added to the opening price to get the target price for longs.
Short ATR Multiplier ATR is multiplied by this value and subtracted from the opening price to get the target price for shorts.
Use Multipliers as fixed % targets : If true, uses the multipliers as a fixed % above/below the opening price to define the target price.
The third section is everything else...
Score Threshold for Longs : The week is skipped if the score is less than the threshold.
Score Threshold for Shorts : The week is skipped if the score is greater than threshold.
Instrument Type : To accurately track session opens and closes, the value must be set to Stocks if looking at stock tickers, Futures if looking at futures or forex tickers, and Crypto if looking at crypto tickers.
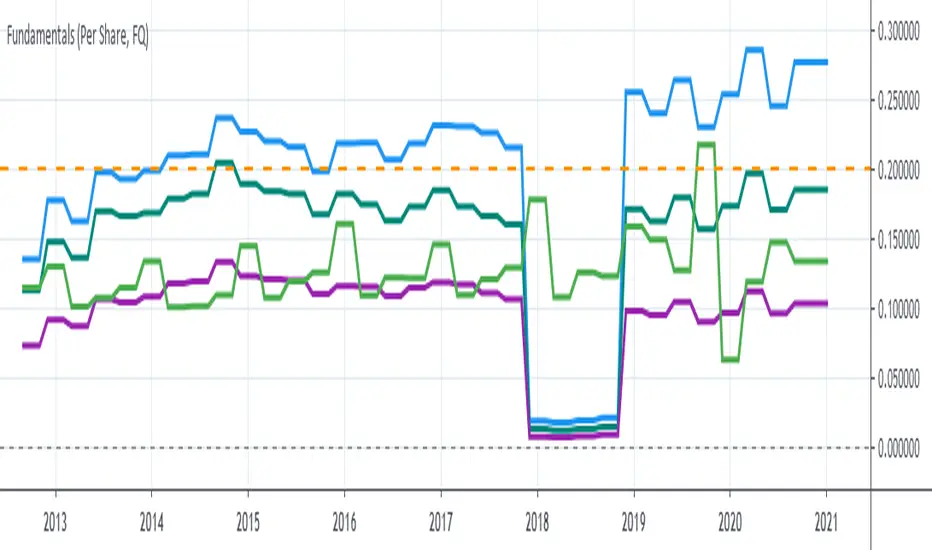
P1 FundamentalsP1 is because to me, this is a priority 1 indicator, so I have P1 and P2 indicators ordered on the favorite list.
What can you check on the selection pane?
On “period”, you can show the data related to:
the fiscal quarters
or the fiscal years.
You can select a pack of financial data that I have organized in sections:
Revenue & earnings
EPS & DPS (EPS, EPS estimate, DPS and dividend payout ratio )
Debt (total debt, total equity and cash & equivalents)
Returns (ROE, ROIC, ROA and R&D revenue to ratio)
I recommend to just select one of them, in other case the chart is a mess.
Any feedback on the code is welcome!!
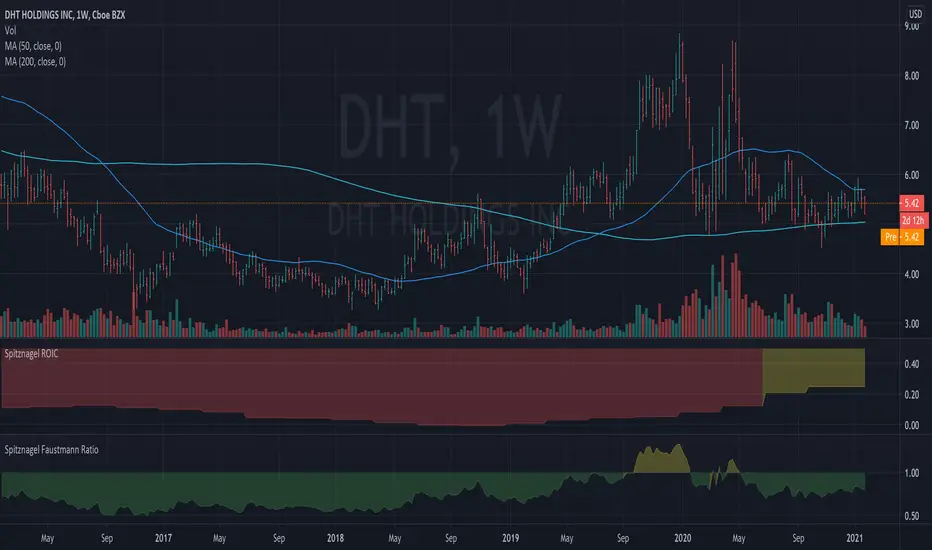
Spitznagel Faustmann RatioThis is a rough version of the Faustmann Ratio metric that Mark Spitznagel presents in The Dao of Capital. The purpose is to conservatively calculate the price of the company (market cap) relative to net worth. Over a medium term horizon, the theory is that companies which have a high ROIC (see my other script) combined with a low Faustmann Ratio (color coded to give you a rough idea) should generally outperform. Please don't take this short summary as an excuse to not read the full book. It's well worth your time. (I am not affiliated with the author in any way.)

Spitznagel ROICThis is a rough version of the Return on Invested Capital metric that Mark Spitznagel presents in The Dao of Capital. The purpose is to calculate the return on real invested capital, conservatively calculated. Over a medium term horizon, the theory is that companies which have a high ROIC (presented here as a decimal value where 0.5 = 50%, 1 = 100%, etc., and color coded as a general guide) combined with a low Faustmann Ratio (see my other script) should generally outperform. Please don't take this short summary as an excuse to not read the full book. It's well worth your time. (I am not affiliated with the author in any way.)
Consolidation Ranges [kingthies] Consolidation Range Analysis
Published by Eric Thies, January 2021
█ Indicator Summary
This tool calculates, analyzes and plots the visualization of a relative range over a given period of time
By adding to charts, users are enabled to see the impulsive nature of market cycles, along with their efforts to consolidate thereafter
The default period is 30, and should be adjusted to users preference
The default input is the current close price, on the chosen timeframe of the chart
█ Script Source
//
//@version=4
//© kingthies || This source code is subject to the terms of the Mozilla Public License 2.0 at mozilla.org
study("Consolidation Ranges ", shorttitle="CR ", overlay=true)
// !<------ User Inputs ----->
src = input(close, title='Range Input (Default set to Close'), lengthEMA=input(30,title='Length'),zoneToggle = input(true, title="Toggle Zone Highlights"), iCol = color.new(#FFFFFF, 100),
// !<---- Declarations & Calculations ---- >
trndUp = float(na),trndDwn = float(na), mid = float(na), e = ema(src, lengthEMA)
trndUp := src < nz(trndUp ) and src > trndDwn ? nz(trndUp ) : high, trndDwn := src < nz(trndUp ) and src > trndDwn ? nz(trndDwn ) : low, mid := avg(trndUp, trndDwn)
// !< ---- Plotting ----->
highRange = plot(trndUp == nz(trndUp ) ? trndUp : na, color=color.white, linewidth=2, style=plot.style_linebr, title="Top of Period Range")
lowRange = plot(trndDwn == nz(trndDwn ) ? trndDwn : na, color=color.white, linewidth=2, style=plot.style_linebr, title="Bottom of Period Range")
xzone = plot(zoneToggle ? src > e ? trndDwn : trndUp : na, color=iCol, style=plot.style_circles, linewidth=0, editable=false)
fill(highRange, xzone, color=color.lime,transp=70), fill(xzone, lowRange, color=color.red,transp=70)
//

[Steve Woods Float Analysis ] Volume Float Indicator This Indicator is developed as mentioned in Steve Woods Book
"Float Analysis, Powerful technical Indicators using Price and Volume"
Overview
Float analysis is a holistic approach to studying the technical behavior
of stocks. By this I mean it treats the shares actually being traded as equal in importance to price and volume activity. Thus, price and volume are seen as only two-thirds of the picture, with the number of shares actually traded being the final third that completes the picture. The power of looking at stocks this way is that it demonstrates a direct relationship between the volume of shares traded in the past and subsequent future movements in price. Thus, float analysis is a powerful tool to predict future stock price movements. In addition, by studying stocks holistically, float analysis expands and clarifies the definition of several technical terms. These include bottoms and tops, support and resistance, and accumulation and distribution.
Float analysis also allows us to create a model of price, volume, and tradeable shares activity. As a model it does not claim to be the “truth” of all stock price and volume activity. It is, of course, just one point of view among many. But like any valid model, it has the ring of truth; and to all who listen, float analysis rings rather loudly. Its appeal as a model of stock behavior is three- fold. First, it is based on several discoveries that are easy to understand. Second, it is backed up by hard data. And third, it makes common sense.
The first and most important discovery, made in 1993, is a simple concept with profound implications. In order to understand this discovery, we need to know two key terms: float and float turnover. The float is well known to knowledgeable market players. I coined the term float turnover to explain the discovery.
The Float
Any given stock has only a certain number of shares that are actually avail- able for trading. These freely traded shares in the hands of the public are called the float, a shortened version of the floating supply of shares. For big companies, like Intel or Microsoft, the number can be over a billion shares. For a small, obscure company, it may be a few hundred thousand. But every company has a specific number of shares that is actually traded by the pub- lic. The float should not be confused with the shares outstanding, which includes both the floating supply of shares and those shares held tightly by the company’s management. The float number for any given company can change periodically; the management might issue more shares, they might sell their shares, or the shares might go through a stock split. The number of shares in a company’s float is not a secret. It is a publicly accessible from a number of sources
A Float Turnover
A float turnover is the amount of time it takes for a number of shares to trade that cumulatively corresponds with the number of shares in the stock’s float. For example, if a company’s float has 100 million shares that are actively trading and the total cumulative volume of shares traded over the last year was 100 million shares, then a single float turnover would be a one-year span starting from the current date and going back to the day when the cumulative total of the volume equaled 100 million shares. In other words, all we’ve done is add the volume numbers from a starting point back to a date when the total equals the float number. There is in this definition an important point that needs to be noted. Although the company’s float is 100 million shares and 100 million shares were traded in a one-year span, we cannot say that all the shares in the float have been traded. This is because it is impossible to know the intentions of all the market participants. There may be short-term day traders who buy and sell several times during a float turnover, and there may be long-term investors who are holding their shares and not trading at all. This being the case, we can only say approximately all the shares in the float were traded. We can, however, quite correctly say that the total number of shares that were traded corresponds to the number of shares in the stock’s float. This is because we can add up the number of shares that were traded during any time frame and compare it to the stock’s float number. When the number of shares traded in any time frame is the same as the float number, we can say that by our definition we have a float turnover.
To some degree, a complete change of ownership in the company is implied by a float turnover, but it can never be measured with any degree of precision.
Real Life Applications
One can make a good strategy out of it
Can be used as confirmations to the old school patterns observed
Useful in deciding recovery points
Useful in deciding reverse trade points
Useful in deciding catastrophic Exit Plan
Some more Visual Examples
Which Timeframes it can be used
Can be used in any timeframes
like : 15s, 30s, 1m, 3m .... 1D, 1W, 1M,
Only to be used for securities for which tradingview provides volume data
How can you get this Indicator
You get this indicator only by messaging me privately , do not use the comment box for requesting access to the indicator, as it is against the house rules of Tradingview community. Use comments only for adding or suggesting constructive stuffss.
Last but not the least Thanks to TradingView for providing us such an awesome platform!

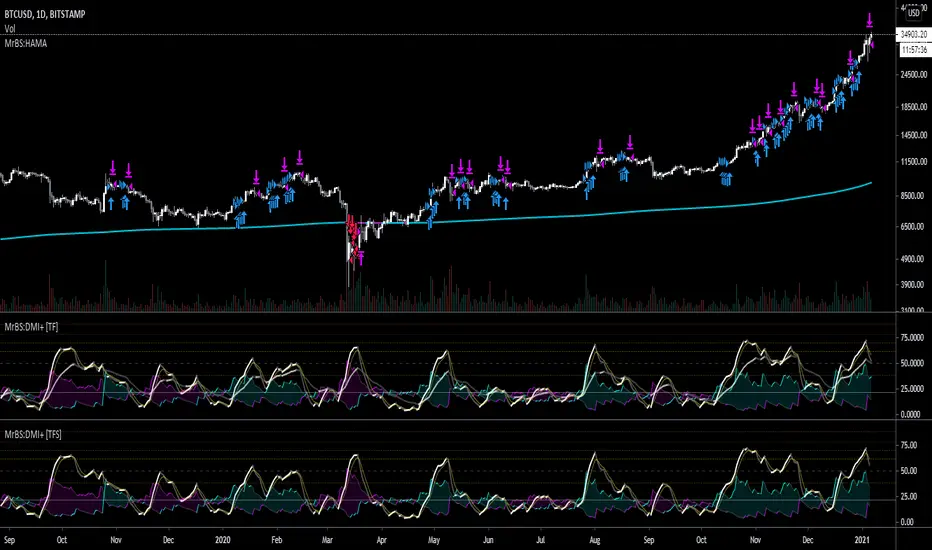
MrBS:EMA/SMA/HMA (Heikin Ashi Calc)This indicator allows you to base the MA calculation from Heikin Ashi values on normal charts and/or the real OHLC values while looking at Heikin Ashi.
There are 3 MA types you can select - EMA / SMA / HMA
The colour is based on the slope.
I made this to help me visualize my DMI+ strategy, when I was looking at taking signals from Heikin Ashi but looking at candlesticks. Turns out, I was going down the wrong road. Now I'm looking into using the real OHLC values for generating signals but watching the Heikin Ashi chart as I find it easier to see trends on it.
Hopefully its useful to some people, and if you have any suggestions for improvements I'd love to know.
[fareid] Quick Backtest Framework█ OVERVIEW
This Framework allows Pine Coders to quickly code Study() based signal/strategy and validate its viability before proceed to code with more advance/complex customized rules for entry, exit, trailstop, risk management etc..
This is somewhat an upgraded version of my earlier personal template with different strategy used, cleaner code
and additional features.
█ USE CASES
- You have an idea for trade signal and need a quick way to verify its potential before writing lengthy/complicated code
- You found a study script for trading signal in public library and want to validate it profitability with minimum effort before including it in your trading playbook
█ FEATURES
- Alert: Ready to use alert function based on signals from your custom indicator.
- Visual Backtest: Auto-plot entry, stop-loss and take profit for simple strategy performance analysis
- Backtest Statistic: Provide basic key metrics based on backtest strategy
- BTE External Signal Protocol: Ready to use code that will supply required state to PineCoders Backtesting & Trading Engine if you wish to have more advance and sophisticated backtesting engine
Notes: All of the above features have On/Off toggle
█ Description & How To Use
This Framework consist of 5 Modules but you only need to edit the first 2 Modules:
Module1: Indicator
Module2: Framework Input Protocol
Module3: Alert
Module4: Backtest
Module5: Backtest & Trading Engine
Tips: The source-code includes collapsible block by module for easy navigating
Module1: Indicator:
-----------------------------------------------------------------------------------
Main Module. Place custom indicator input parameter/calculation/indicator plotting here
Sample Strategy: Double MACD Crossover
MACD Signal: 1st MACD Cross above signal line indicate Buy Signal
1st MACD Cross below signal line indicate Sell Signal
MACD Filter: 2nd MACD is above 0 line indicate Uptrend
2nd MACD is below 0 line indicate Downtrend
Module2: Framework Input Protocol:
-----------------------------------------------------------------------------------
Use this module to connect main indicator/signal calculated in Module1 to the rest of the framework's module
4 variables needed to be defined here:
1. Uptrend
2. Dntrend
3. BuySignal
4. SellSignal
i'm not sure how to place a code snippet here to show you example so in the source code i already put a comment in Module2 on which part u need to edit. I hope its pretty simple to use.
Module3: Alert Module Description:
-----------------------------------------------------------------------------------
As long as the variables in Module2 properly defined, the alert module is ready to use without any further modification.
Input:
Enable Alert --> Enable TV's alert and plot signal to chart
Alert Type --> Set to take Buy only, Sell only or Both alert
Module4: Backtest Module Description:
-----------------------------------------------------------------------------------
As long as the variables in Module2 properly defined, the backtest module is ready to use without any further modification.
Input:
Backtest Stat --> Enable Backtest Statistic Label
Backtest Visual --> Enable Backtest visual simulation
Backtest Type --> Set to take Buy only or Sell only or both
SL Type -->
ATR : Set SL in ATR times Multiplier below entry price
Fixed : Set SL in fixed point below entry point (in 'Dollar'). e.g. for Stocks -> 0.5 equals to 50cent while for EURUSD currency -> 0.005 equal to 50 pips
HiLo Bar: Set SL at highest/lowest wick of previous bar plus/minus Fixed point. e.g. EURUSD HiLo=3 and Fixed Point = 0.0005, buy trade will place SL 5 Pips below lowest of previous 3 bar
SL ATR Multi --> Set Lookback Period used for SL's ATR calculation
SL ATR Multi --> Set ATR Multiplier for SL
SL Fixed --> Set Fixed Level for SL
SL Bar --> Set Number of previous bar to check for SL placement
TP RR Ratio --> Set TP based on RR multiplier. e.g. 2 means TP level will be twice further from entry point compared to Entry-SL distance.
Notes: The point is for preliminary testing, so it only supports 1 trade at a time and no Trailing Stop
Module5: Backtest & Trading Engine Description:
-----------------------------------------------------------------------------------
As long as the variables in Module2 properly defined, the Pinecoders BTE module is ready to use without any further modification.
Input:
External Signal Protocol --> Set ESP State to send to "Backtesting & Trading Engine "
Signal With Filter --> Use this to send entry signal that already filtered by this study indicator (without stoploss level)
Signal Without Filter --> Use this to send raw entry signal that are NOT YET FILTERED by this study indicator (without stoploss level)
Signal and Stop With Filter --> Use this to send entry signal WITH StopLoss that already filtered by this study indicator (with stoploss level)
Signal and Stop Without Filter --> Use this to send raw entry signal WITH StopLoss that are NOT YET FILTERED by this study indicator (with stoploss level)
Notes: Backtesting & Trading Engine already have built-in Filter, Entries and Stop Level. e.g. Unselect all their filter state if only want to use custom filter and make sure send Signal with Filter (with or without SL level)
█ DISCLAIMER:
This framework main objective is to create my personal indicator template so that i just have to modify the indicator module for preliminary testing in future.
The sample strategy included are for educational purpose only. Use at your own risk
credit: LucF/PineCoders for a lot of his scripts that i use as a guide to complete this

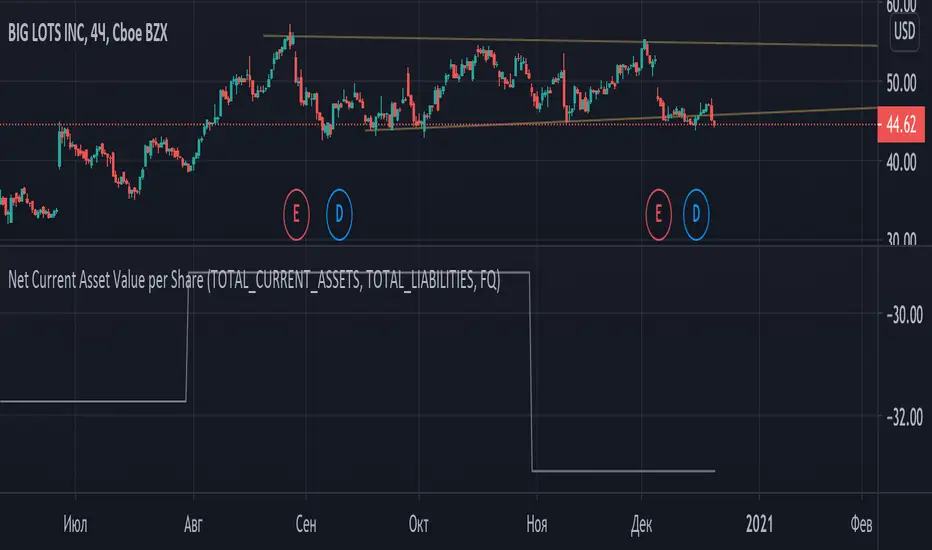
Graham Net Current Asset Value per ShareNet current asset value per share (NCAVPS) is a measure created by Benjamin Graham as one means of gauging the attractiveness of a stock. A key metric for value investors, NCAVPS is calculated by taking a company's current assets and subtracting total liabilities.
NCAVPS = Current Assets - (Total Liabilities + Preferred Stock) ÷ Shares Outstanding.
According to Graham, investors will benefit greatly if they invest in companies where the stock prices are no more than 67% (or 2/3) of their NCAV per share (price <= (2/3)*NCAV).
Coloring pattern:
- price <= (1/3)*ncav -> light green
- (1/3)*ncav < price <= (2/3)*ncav -> green
- (2/3)*ncav < price <= ncav -> dim red
- price > ncav -> red
Long RSIThe RSI is a technical indicator generally used with the general setting being 14 days, and often shorter.
The accepted view is that a level of 70 indicates overbought conditions, and 30 indicates oversold conditions.
A short RSI setting will give signals quite often, and they might sometimes contradict each other.
As a individual investor, perhaps with a background in fundamental analysis, the RSI might be overlooked for other fundamental metrics.
But the idea here is that longer RSI settings can be used for investing.
The problem that arises is how to know when the indicator has reached a level that is either overbought or oversold.
This script solves that by using a specific look back period (selectable, but the standard is 1 year), and plotting the highest/lowest value that the RSI has had for that time period.
The idea is that a buy signal occurs when the indicator is at a 'historic' low, and a sell signal occurs when it at its 'historic' high.
Since you generally want to buy when the indicator is at its low, and has stopped decreasing, the script comes with a function that shows you when yesterdays value reached a historic low, but todays value is higher than yesterday.
This is shown by a color change of the background to green. The same is true, but opposite, for sell signals and then the background turns red.
THIS IS NOT TRADING ADVICE, AND YOU SHOULD ALWAYS DO YOUR OWN RESEARCH
GOOD LUCK AND HAPPY TRADING

Fundamental Metric to MarketThis script is supposed to be a quite basic way to find, from a fundamental standpoint, overvalue or undervalued stocks.
The script shows either Book to Market (inverse of P/B), EV /EBITDA, Earnings Yield (inverse of P/E) or Sales to Market (inverse of P/S).
For example, P/B is calculated as Close price / Book Value per share. As a contrarian investor you generally want to buy low P/B stocks and sell high P/B stocks. The problem is when a company has a negative Book Value. This might be the case when a company has written of a large amount of goodwill, which in turn wiped out their Book Value.
Instead you can use Book to Market, which is simply the inverse of P/B. It is calculated as Book Value per share / Close price. When using Book to Market you, generally, want to buy shares with high Book to Market values and sell those with low values. Because of the calculation, companies with negative Book Value will have negative Book to Market values and is therefore easy to identify.
The Fundamental Metric to Market indicator shows a colored background between the highest / lowest point of earlier values and the current value. When the background is mainly green the stock is probably undervalued, and the opposite is true when the background is red.
THIS IS NOT TRADING ADVICE, AND YOU SHOULD ALWAYS DO YOUR OWN RESEARCH
GOOD LUCK AND HAPPY TRADING

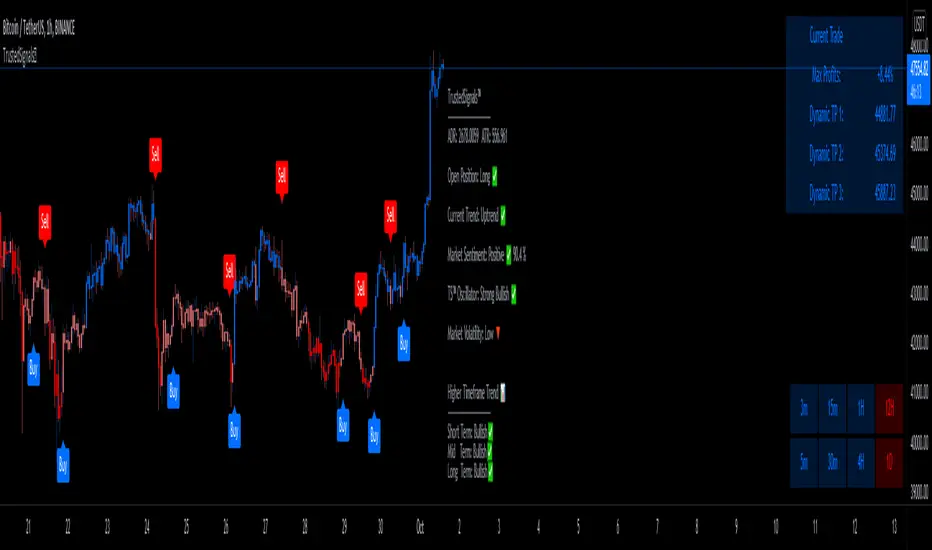
TrustedSignals™TrustedSignals Indicator includes standard Buy and Sell signals on the chart, Support & Resistance lines, Auto-Trendlines, AutoFibs and an All-in-One Market Dashboard.
(All these signals can be set up as Live Alerts directly in Tradingview)
The 2 main Input options for this algorithm are ' Reactivity ' and ' Depth '. By default, the indicator is added to your chart with the best settings we've found so far.
-The ' Reactivity ' controls how quickly the algorithm reacts to trend changes. The higher the reactivity, the fewer trades on the chart. If the Reactivity input is low, the algorithm will react more quickly, and show more frequent trades.
-The ' Depth ' controls the position of the signals relative to the trend swing. A lower Depth will allow for more frequent and earlier entries, while a higher Depth will give slower entries.
Our third (secondary) input is ' Trend Length ' (the Lookback of the ' Current Trend ' indicator). TrustedSignals™ is coloring the candles based on the current trend direction. The blue color shows an uptrend, while the red color shows a downtrend. Buy and Sell signals alerted while the current trend is showing pink (Sideways Market) should be taken carefully, as the market direction is not decided.
Since we believe in the idea of an ' All-in-One ' Indicator, we have included 3 more extremely useful and powerful trading tools.
-The first optional feature is the ' Support and Resistance ' lines. This feature can be activated to draw the key levels of Support and Resistance, easing your decision making and reinforcing the entry signals. Those levels can also be used as Stop Loss or Take Profit
-The second optional feature is the ' Auto-Trendlines '. This part of our amazing indicator automatically draws Trendlines based on the Lookback period the user inputs.
-The last and most important optional feature is the ' AutoFibs '. TrustedSignals™ will automatically draw Fibonacci Retracement levels from trend swing key points. (the lookback length can be adjusted by the user)
- Market Dashboard -
Within one simple panel on your chart, our Dashboard displays the most relevant data from all of our features in real-time.
Current Trend
(The bar color) is an indicator based on Murrey Math's lines. These lines are based on the idea that according to Gann, price moves in 1/8's that act as points of support and resistance. Given this 1/8 characteristic of price action, we assigned properties to each of the lines in a given octave, obtaining a perfect Trend Indicator shown by the candle color, ranging from red to orange to blue.
Market Sentiment
Market Sentiment is a zero lag, 'noise-free', custom improved version of the old 'Relative Strength Indicator ( RSI )' It measures trend velocity and momentum, while it charts the current and historical strength or weakness of the market. It is a much more accurate and vastly superior than the usual RSI.
Trusted Sginals Oscillator
TS Oscillator is our own branded indicator used to measure market momentum and determines whether bullish or bearish trend dominates the market. It measures the market momentum, with the aim to detect potential trend direction. Helping you to identify if the price is high or low in comparison to the recent price behavior.
Outputs: "Strong Bearish ", "Weak Bearish", "Strong Bullish ", "Weak Bullish"
Higher Timeframe Trend is a trend indicator based on our own non-repainting calculation of higher timeframe trend. It is based on a custom method that builds synthetic support and resistance lines from higher time, without repainting, while keeping the output extremely accurate.
Use the link below to obtain access to this indicator
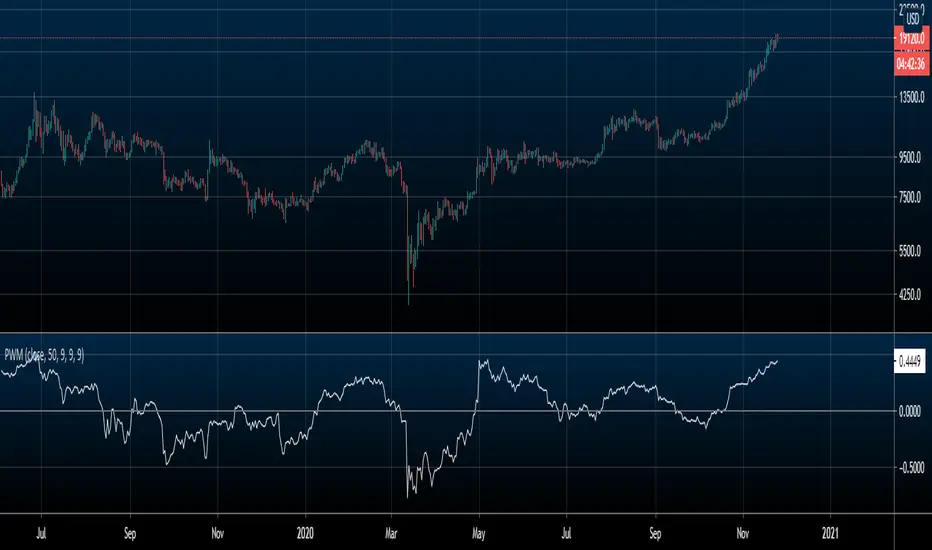
Price Weighted MomentumThis indicator is a momentum indicator that is standardized by price. A.K.A (momentum / price)
The purpose of this indicator is to compare momentum between different assets regardless of price.
EX: Bitcoin will always have more momentum than XLE because it's price is $19000 (as of writing this) compared to XLE's price of $40 (as of writing this). But if you divide the momentum by price, you get a standardized value to better compare the 2.
This indicator can be used to compare everything on TradingView.
HOW TO USE/INTERPRET
Positive values denote an uptrend
Negative values denote a downtrend
A value of 0 (or very very close to 0) denotes sideways price action
WHAT'S INCLUDED
Price Weighted Momentum (Unsmoothed by default)
Optional smoothing with either a simple or exponential moving average
Side note: I only added functionality of smoothing for EMA and SMA for my personal uses, but if you want a version of this with another way of smoothing (e.g. HMA, SSMA, etc.) that you would like, the cost of me adding that for you is a follow on Twitter. Just DM me there :)
BUY/SELL_Strategy_Paydar_V.07BUY/SELL_Strategy_Paydar_V.07
Hello dear friends
This system can be considered as a signal system.
*** This system just Suggests you for points. ***
My suggestion is not to use this system alone and conclude about entry and exit points according to charts, news, market fluctuations and trend direction.
The agenda of this system is as follows:
- Buy signal means:
Time to enter the trade / buy / take a long position and ...
- Sell signal means:
Time to leave the trade / sell / exit the long position
* I suggest you use this system in trading for cryptocurrency and especially for bitcoin.
* My suggested time frame is 1 minute, because during this time and according to the settings of this system, a better result was obtained for me.
* I suggest using this system first in spot trading and then in future trading.
System function:
This system is based on the analysis of 74 different systems, which are:
> 19 indicators and oscillators separately which include:
MACD, RSI, STOCHASTIC, STOCHASTIC RSI, BOLLINGER BANDs, PARABOLIC SAR, VOLATILITY and ...
(All of which can be used on the Trading View site as a public domain and open source)
> 11 cases of previous oscillators and indicators in combination
(All of which can be used in public view and open source on the Trading View site)
> 27 items MA, EMA, VMA, WM, MSM, etc. in combination and separately
> 9 lines and areas of automatic support and resistance
(All of which can be used in public view and open source on the Trading View site)
> 8 different strategies, all of which can be used in public view and open source on the Trading View site
Points.
*** All indicators, oscillators, lines and areas of automatic support and resistance, strategies, etc. can be used as a public domain and open source on the Trading View site. ***
Comment on using this system as well as how to use it.
_______________________________________________________________________________
* In this system, the main and basic indicators and oscillators are used, all of which are in the public view and open source site in Trading View *
I am very grateful and very loyal to Trading View, which built all the indicators, oscillators and strategies, because I used them to build this strategy system.
_______________________________________________________________________________
Be successful and profitable.
