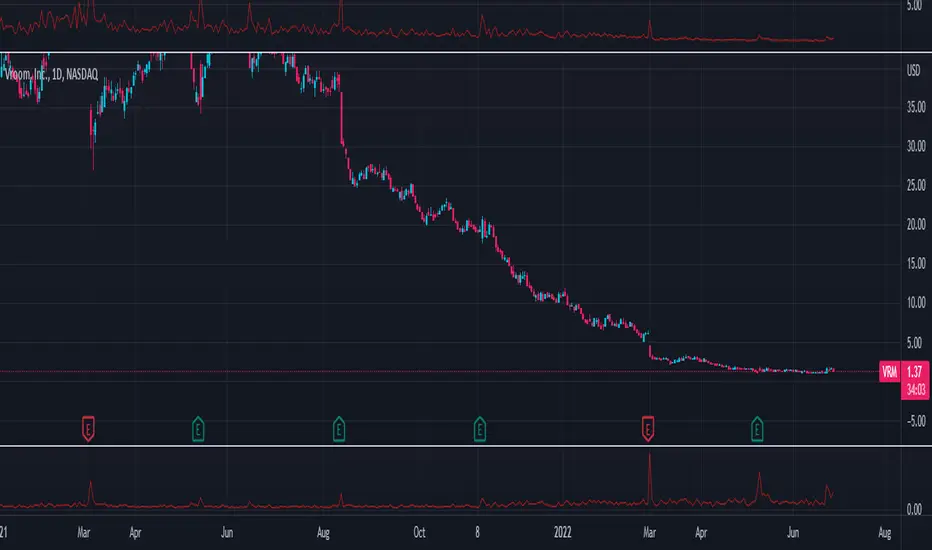
Percentage Average True RangeCalculates the percentage movement of an instrument per day.
Default is 1 period ATR (ATR(1)) but this can be changed in the settings.
Maths - (ATR (1)/closing price)*100
Above is the ATR (1)
Below is the %ATR(1)
Average True Range (ATR)
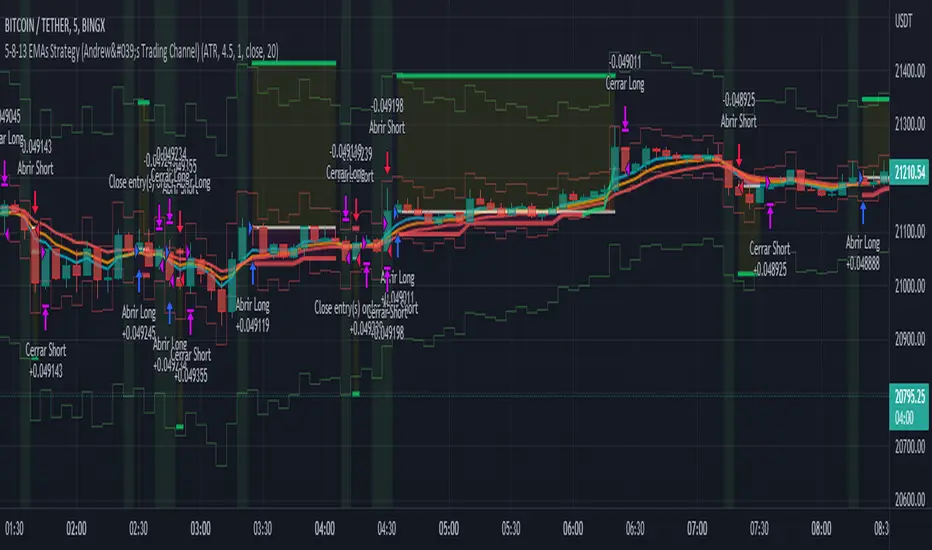
5-8-13 EMAs Strategy (Andrew's Trading Channel)============
ENGLISH
============
- Description:
This strategy was designed by "Andrew's Trading Channel" (credits to him for the base strategy).
A lot of improvements have been added to the strategy, more conditions, trailing stop, custom stop loss and take profit, everything explained below.
- CONDITIONS FOR ENTERING A LONG:
EMA 5 crossovers EMA 8.
- EXIT LONG:
EMA 8 crossovers EMA 8 and closing price goes below EMA 13.
- CONDITIONS FOR ENTERING SHORT:
EMA 8 crossovers EMA 5.
- EXIT SHORT:
EMA 5 crossovers EMA 8 and closing price goes above EMA 13.
- Visual:
All EMAs are visible (5, 8 and 13 periods) with different and customizable colors/width.
Position start price, take profit, stop loss and trailing stop (if present) are shown automatically.
Background color shows green when LONG conditions are met (and of course, position is opened on the next candle), same for SHORT but red.
- Usage and recommendations:
As this is a coded strategy, you don't even have to check for indicators, just open and close trades as the strategy shows.
There're various customizable settings like optional take profit/stop loss, trailing stop (both based on ATR or any of the EMAs), open only LONGs/SHORTs or both, date range...
Take profit and stop loss ATR default values have been tested for scalping on 5 min charts, however feel free to check strategy results and increase the winning rate/profit for your favorite asset.
- Customization:
As usual I like to make as many aspects of my indicators/strategies customizable, indicators, colors etc., feel free to ask if you feel that something that should be configurable is missing or if you have any ideas to optimize the strategy.
============
ESPAÑOL
============
- Descripción:
Esta estrategia fue diseñada por "Andrew's Trading Channel" (créditos a él por la estrategia base).
Se han añadido muchas mejoras a la estrategia, más condiciones, trailing stop, stop loss y take profit personalizados, todo explicado a continuación.
- CONDICIONES PARA ENTRAR EN LONG:
Cruce de EMA 5 con EMA 8 ascendente.
- SALIR DE LONG:
Cruce de EMA 8 con EMA 5 ascendente y el precio de cierre se sitúa por debajo de la EMA 13.
- CONDICIONES PARA ENTRAR EN SHORT:
Cruce de EMA 8 con EMA 5 ascendente.
- SALIR DE SHORT:
Cruce de EMA 5 con EMA 8 ascendente y el precio de cierre se sitúa por encima de la EMA 13.
- Visual:
Todas las EMAs son visibles (5, 8 y 13 períodos) con colores/anchos y personalizables.
El precio de inicio de la posición, el take profit, el stop loss y el trailing stop (si están presentes) se muestran automáticamente.
El color de fondo es verde cuando se cumplen las condiciones de LONG (y por supuesto, la posición se abre en la siguiente vela), lo mismo para SHORT pero en rojo.
- Uso y recomendaciones:
Como esta es una estrategia programada, ni siquiera tienes que comprobar los indicadores, sólo abrir y cerrar las operaciones como te muestra la estrategia.
Hay varios ajustes personalizables como el take profit/stop loss opcional, el trailing stop (ambos basados en el ATR o en cualquiera de las EMAs), abrir sólo LONGs/SHORTs o ambos, rango de fechas...
Los valores por defecto del take profit y el stop loss ATR han sido probados para scalping en gráficos de 5 minutos, sin embargo, siéntase libre de comprobar los resultados de la estrategia y aumentar la tasa de ganancia / beneficio para su activo favorito.
- Personalización:
Como siempre me gusta hacer personalizables todos los aspectos de mis indicadores/estrategias, indicadores, colores, etc., siéntase libre de preguntar si cree que falta algo que debería ser configurable o si tiene alguna idea para optimizar la estrategia.
Average True Range MultipliedModified version of an Average True Range indicator. You could adjust the multiplication of the ATR value on the settings. I personally use this indicator for a turtle trading strategy so I don't have to use calcuator to manually multiply the ATR value by two.

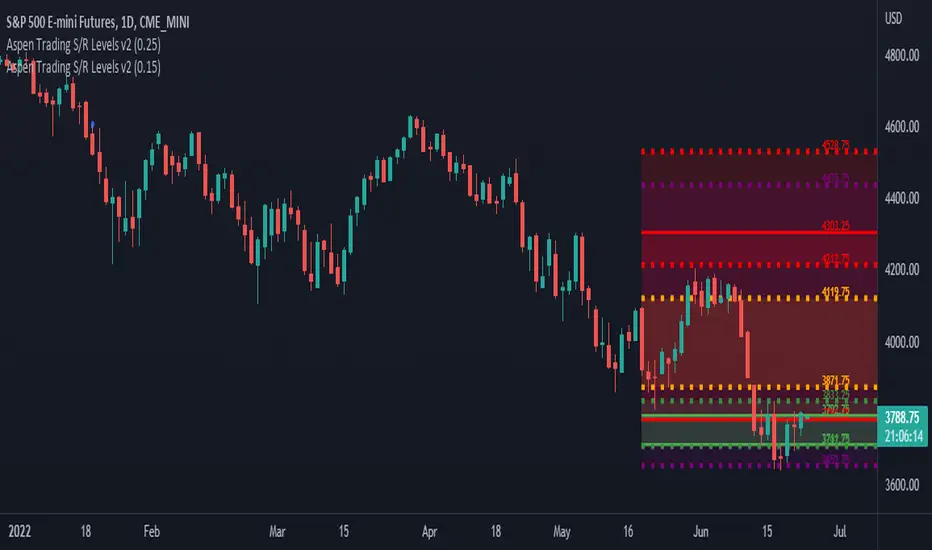
Aspen Trading S/R Levels v2In Trading, Objectivity Trumps Subjectivity
“Every trader is a steaming hot bowl of bias stew and must maintain self-awareness and lucidity behind the screens as the trading day oscillates between boredom and terror.”
The above quote is from a good friend of mine and veteran FX trader Brent Donnelly. It completely nails the biggest challenge for new and even experienced traders: being as objective as possible when making trading decisions.
Yes, as you become more experienced, subjectivity, market feel and experience are part of one’s decision-making matrix, but early on you do not have that luxury.
If you start each day knowing that price action in the market is random it will remind you to think objectively. There are, however, repeatable patterns that occur again and again…..it’s your job to identify them.
That’s where Support & Resistance levels come in.
Definitions: “Support” and “Resistance” Levels
Many technical indicators and tools can be subjective and challenging to learn. This is not the case with support and resistance levels.
Support and resistance are terms for two price levels on a chart that appear to limit the security’s range of movement.
The “support level” is where the price regularly stops falling and bounces up.
The “resistance level” is where the price normally stops rising and dips back down.
The more frequently a price hits either level, the more reliable that level is likely to be in predicting future price movements.
Understanding Support and Resistance Levels
Remember, the more informed and objective we can be with numbers, the more confident we can be with our trades. That’s important because, although price action is random (a fact that has been proven time and time again), there are repeatable patterns we can use to get an edge.
Two of those objective data points we can use to gain an edge are support and resistance levels. These are two of the best tools we have when it comes to swing trading. Why? Because they give us strong data points that suggest where an instrument is likely (and unlikely) to go.
But this is really key: Arbitrarily cataloging each price level that appears to be relevant as a support or resistance level isn’t going to get you far. That’s why Aspen Trading takes a unique approach to support and resistance levels.
With Aspen’s Support & Resistance Levels, we measure where trades (prices) occur in terms of frequency. This gives us a sense of where market participants are wagering prices may go.
That’s about as raw and unfiltered as you can get in terms of displaying what has taken place. There’s no room for interpretation - this is raw data that can be used to get a sense of where prices may be heading.
Learning The “Four Sets” of Support and Resistance Levels
There are four sets of support and resistance levels that are part of Aspen Trading’s S/R framework.
Each set of support and resistance levels is unique to a specified period of time. We display each of them in different colors on our charts when we analyze trades to make it easy for us to understand the data as we get comfortable reading charts.
You’ll see each of these levels on display in the charts that follow below. The four sets of support and resistance levels are classified as follows:
There are four sets of support and resistance levels that are displayed by Aspen Trading’s S/R Analysis Tool. Each one is unique to a specified period of time that we then display directly on the chart. The levels are classified as follows
GREEN: displays 2 dotted lines (upper/lower)
ORANGE: displays 2 dotted lines (upper/lower)
RED: displays 2 dotted lines (upper/lower)
PURPLE: displays 2 dotted lines (upper/lower)
IMPORTANT:
What’s the distinction between the 4 color levels?
Essentially think of these levels on a rising scale of importance. While GREEN levels are certainly key, they do not hold the same level of significance as the PURPLE levels.
To get access to Aspen's S/R Levels - simply purchase an annual license for $595 at the link below. Once the transaction is complete, we will email you asking you for your TradingView username and get you permisisoned within 12-hours.
Adaptive ATR Keltner Channels [Loxx]Adaptive ATR Channels are adaptive Keltner channels. ATR is calculated using a rolling signal-to-noise ratio making this indicator flex more to changes in price volatility than the fixed Keltner Channels.
What is Average True Range (ATR)?
The average true range (ATR) is a technical analysis indicator, introduced by market technician J. Welles Wilder Jr. in his book New Concepts in Technical Trading Systems, that measures market volatility by decomposing the entire range of an asset price for that period.1
The true range is taken as the greatest of the following: current high less the current low; the absolute value of the current high less the previous close; and the absolute value of the current low less the previous close. The ATR is then a moving average, generally using 14 days, of the true ranges.
What are Keltner Channel (ATR)?
Keltner Channels are volatility-based bands that are placed on either side of an asset's price and can aid in determining the direction of a trend.
The Keltner channel uses the average-true range (ATR) or volatility, with breaks above or below the top and bottom barriers signaling a continuation.

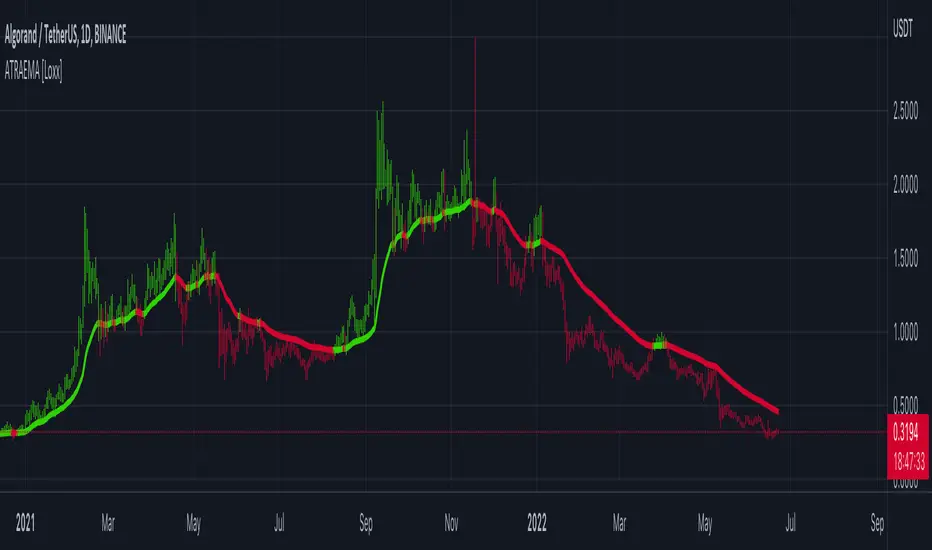
ATR Adaptive EMA [Loxx]ATR adaptive EMA is an exponential moving average with dynamic ATR-adjusted length inputs.
What is Average True Range (ATR)?
The average true range (ATR) is a technical analysis indicator, introduced by market technician J. Welles Wilder Jr. in his book New Concepts in Technical Trading Systems, that measures market volatility by decomposing the entire range of an asset price for that period.1
The true range is taken as the greatest of the following: current high less the current low; the absolute value of the current high less the previous close; and the absolute value of the current low less the previous close. The ATR is then a moving average, generally using 14 days, of the true ranges.
Price Abnormality IndicatorIt shows abnormalities in the price. It calculates using ATR value by using the current price. The default value is the last 7 bars, but you can change it. It takes values between 0-100. High value shows that the price is too much volatile.
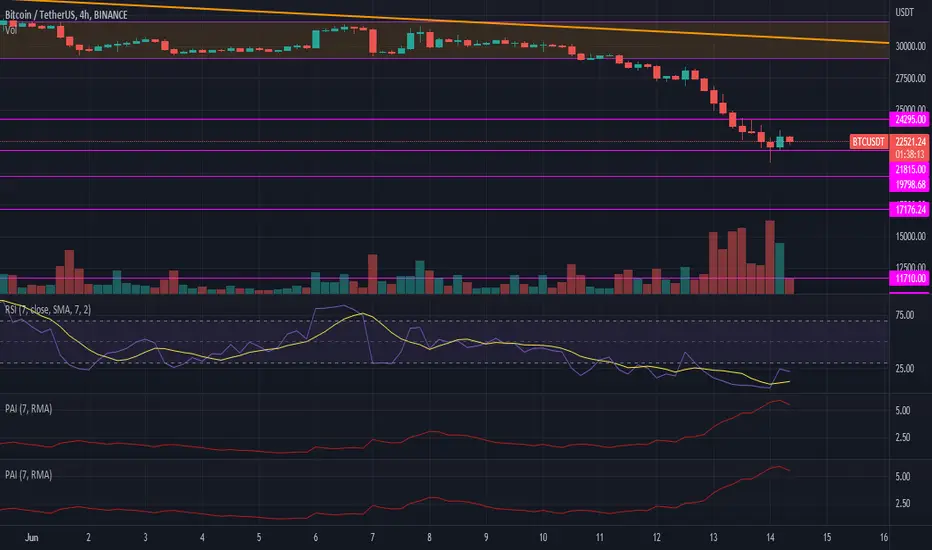
ATR GainThis indicator shows the amount, in terms of a percentage, that the ATR is currently above or below the current ATR average.
This can be translated to the amount of volatility in the market compared to the current "standard" volatility.
See also "Average True Range" technical indicator

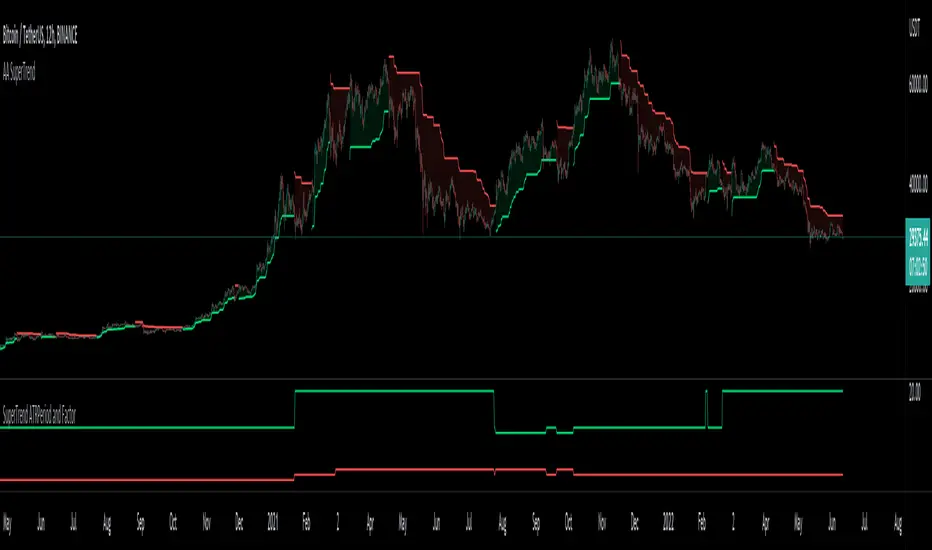
Auto Adjust SuperTrend Indicator SuperTrend
It is a standard ATR (Average True Range)-based Trailing Indicator. The indicator takes two default values ATR Period and Factor. The standard settings for Super Trend I have seen are 10,3 or 10,2. These settings will not work for all the instruments, and we end up manually changing these settings. This is where Auto-Adjust Supertrend adds value. Auto-Adjust SuperTrend finds the optimized settings for ATRPeriod and Multiple using a defined algorithm to check all the different ATR Periods and Factors. It backtests different combinations of ATR Period and Factors and Indicator switches to these profitable settings as soon as it detects most profitable setting among given range in the settings.
Default ATR Period : 10 to 20
Default Factor : 2 to 5
The above settings can be altered in the indicator settings. Please do keep in mind that the performance of the indicator reduces as we increase the default settings range.
Alerts are available as well
Pls contact me for access.
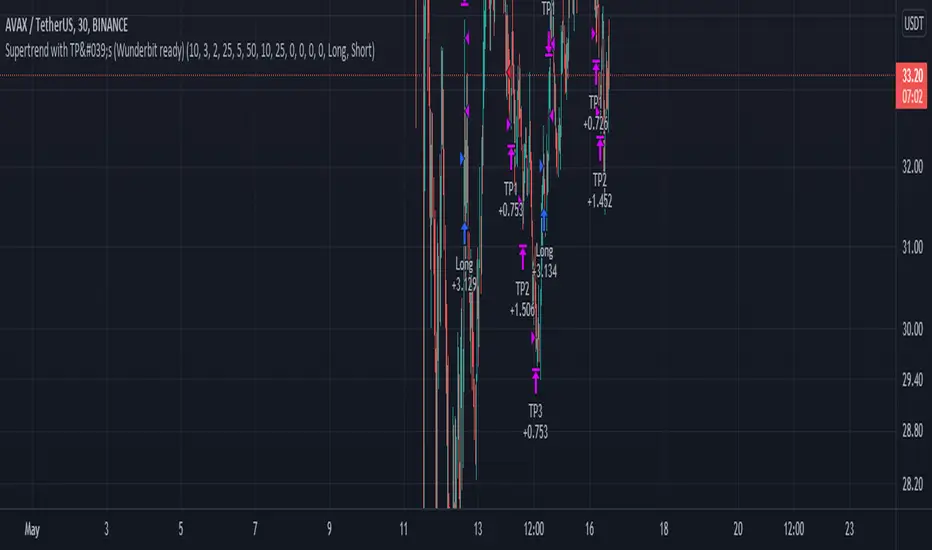
Customizable Non-Repainting HTF MACD MFI Scalper Bot Strategy v2Customizable Non-Repainting HTF MACD MFI Scalper Bot Strategy v2
This script was originally shared by Wunderbit as a free open source script for the community to work with. This is my second published iteration of this idea.
WHAT THIS SCRIPT DOES:
It is intended for use on an algorithmic bot trading platform but can be used for scalping and manual trading.
This strategy is based on the trend-following momentum indicator . It includes the Money Flow index as an additional point for entry.
This is a new and improved version geared for lower timeframes (15-5 minutes), but can be run on larger ones as well. I am testing it live as my high frequency trader.
HOW IT DOES IT:
It uses a combination of MACD and MFI indicators to create entry signals. Parameters for each indicator have been surfaced for user configurability.
Take profits are now trailing profits, and the stop loss is now fixed. Why? I found that the trailing stop loss with ATR in the previous version yields very good results for back tests but becomes very difficult to deploy live due to transaction fees. As you can see the average trade is a higher profit percentage than the previous version.
HOW IS MY VERSION ORIGINAL:
Now instead of using ATR stop loss, we have a fixed stop loss - counter intuitively to what some may believe this performs better in live trading scenarios since it gives the strategy room to move. I noticed that the ATR trailing stop was stopping out too fast and was eating away balance due to transaction fees.
The take profit on the other hand is now a trailing profit with a customizable deviation. This ensures that you can have a minimum profit you want to take in order to exit.
I have depracated the old ATR trailing stop as it became too confusing to have those as different options. I kept the old version for others that want to experiment with it. The source code still requires some cleanup, but its fully functional.
I added in a way to show RSI values and ATR values with a checkbox so that you can use the new an improved ATR Filter (and grab the right RSI values for the RSI filter). This will help to filter out times of very low volatility where we are unlikely to find a profitable trade. Use the "Show Data" checkbox to see what the values are on the indicator pane, then use those values to gauge what you want to filter out.
Both versions
Delayed Signals : The script has been refactored to use a time frame drop down. The higher time frame can be run on a faster chart (recommended on one minute chart for fastest signal confirmation and relay to algotrading platform.)
Repainting Issues : All indicators have been recoded to use the security function that checks to see if the current calculation is in realtime, if it is, then it uses the previous bar for calculation. If you are still experiencing repainting issues based on intended (or non intended use), please provide a report with screenshot and explanation so I can try to address.
Filtering : I have added to additional filters an ABOVE EMA Filter and a BELOW RSI Filter (both can be turned on and off)
Customizable Long and Close Messages : This allows someone to use the script for algorithmic trading without having to alter code. It also means you can use one indicator for all of your different alterts required for your bots.
HOW TO USE IT:
It is intended to be used in the 5-30 minute time frames, but you might be able to get a good configuration for higher time frames. I welcome feedback from other users on what they have found.
Find a pair with high volatility (example KUCOIN:ETH3LUSDT ) - I have found it works particularly well with 3L and 3S tokens for crypto. although it the limitation is that confrigurations I have found to work typically have low R/R ratio, but very high win rate and profit factor.
Ideally set one minute chart for bots, but you can use other charts for manual trading. The signal will be delayed by one bar but I have found configurations that still test well.
Select a time frame in configuration for your indicator calculations.
Select the strategy config for time frame (resolution). I like to use 5 and 15 minutes for scalping scenarios, but I am interested in hearing back from other community memebers.
Optimize your indicator without filters : customize your settings for MACD and MFI that are profitable with your chart and selected time frame calculation. Try different Take Profits (try about 2-5%) and stop loss (try about 5-8%). See if your back test is profitable and continue to optimize.
Use the Trend, RSI, ATR Filter to further refine your signals for entry. You will get less entries but you can increase your win ratio.
You can use the open and close messages for a platform integration, but I choose to set mine up on the destination platform and let the platform close it. With certain platforms you cannot be sure what your entry point actually was compared to Trading View due to slippage and timing, so I let the platform decide when it is actually profitable.
Limitations: this works rather well for short term, and does some good forward testing but back testing large data sets is a problem when switching from very small time frame to large time frame. For instance, finding a configuration that works on a one minute chart but then changing to a 1 hour chart means you lose some of your intra bar calclulations. There are some new features in pine script which might be able to address, this, but I have not had a chance to work on that issue.

Customizable Non-Repainting HTF MACD MFI Scalper Bot StrategyThis script was originally shared by Wunderbit as a free open source script for the community to work with.
WHAT THIS SCRIPT DOES:
It is intended for use on an algorithmic bot trading platform but can be used for scalping and manual trading.
This strategy is based on the trend-following momentum indicator . It includes the Money Flow index as an additional point for entry.
HOW IT DOES IT:
It uses a combination of MACD and MFI indicators to create entry signals. Parameters for each indicator have been surfaced for user configurability.
Take profits are fixed, but stop loss uses ATR configuration to minimize losses and close profitably.
HOW IS MY VERSION ORIGINAL:
I started trying to deploy this script myself in my algorithmic trading but ran into some issues which I have tried to address in this version.
Delayed Signals : The script has been refactored to use a time frame drop down. The higher time frame can be run on a faster chart (recommended on one minute chart for fastest signal confirmation and relay to algotrading platform.)
Repainting Issues : All indicators have been recoded to use the security function that checks to see if the current calculation is in realtime, if it is, then it uses the previous bar for calculation. If you are still experiencing repainting issues based on intended (or non intended use), please provide a report with screenshot and explanation so I can try to address.
Filtering : I have added to additional filters an ABOVE EMA Filter and a BELOW RSI Filter (both can be turned on and off)
Customizable Long and Close Messages : This allows someone to use the script for algorithmic trading without having to alter code. It also means you can use one indicator for all of your different alterts required for your bots.
HOW TO USE IT:
It is intended to be used in the 5-30 minute time frames, but you might be able to get a good configuration for higher time frames. I welcome feedback from other users on what they have found.
Find a pair with high volatility (example KUCOIN:ETH3LUSDT ) - I have found it works particularly well with 3L and 3S tokens for crypto. although it the limitation is that confrigurations I have found to work typically have low R/R ratio, but very high win rate and profit factor.
Ideally set one minute chart for bots, but you can use other charts for manual trading. The signal will be delayed by one bar but I have found configurations that still test well.
Select a time frame in configuration for your indicator calculations.
Select the strategy config for time frame. I like to use 5 and 15 minutes for scalping scenarios, but I am interested in hearing back from other community memebers.
Optimize your indicator without filters (trendFilter and RSI Filter)
Use the TrendFilter and RSI Filter to further refine your signals for entry. You will get less entries but you can increase your win ratio.
I will add screenshots and possibly a video provided that it passes community standards.
Limitations: this works rather well for short term, and does some good forward testing but back testing large data sets is a problem when switching from very small time frame to large time frame. For instance, finding a configuration that works on a one minute chart but then changing to a 1 hour chart means you lose some of your intra bar calclulations. There are some new features in pine script which might be able to address, this, but I have not had a chance to work on that issue.

Bollinger Bands + Keltner Channel Refurbished█ Goals
This is an indicator that brings together Bollinger Bands and Keltner's Channels in one thing.
Both are very similar, so I decided to make a merge of the best features I found out there.
Here there is the possibility of choosing one of these two as needed.
In addition, I added the following resources:
1. Pre-Defined intermediate bands with Fibonacci values;
2. Detachment of the bands in which the price was present;
3. Choice of Moving Average:
"Simple", "Exponential", "Regularized Exponential", "Hull", "Arnaud Legoux", "Weighted Moving Average", "Least Squares Moving Average (Linear Regression)", "Volume Weighted Moving Average", "Smoothed Moving Average", "Median", "VWAP");
4. Statistics: bars count within the bands.
█ Concepts
Keltner Channels vs. Bollinger Bands
"These two indicators are quite similar.
Keltner Channels use ATR to calculate the upper and lower bands while Bollinger Bands use standard deviation instead.
The interpretation of the indicators is similar, although since the calculations are different the two indicators may provide slightly different information or trade signals."
(Investopedia)
Bollinger Bands (BB)
"Bollinger Bands (BB) are a widely popular technical analysis instrument created by John Bollinger in the early 1980’s.
Bollinger Bands consist of a band of three lines which are plotted in relation to security prices.
The line in the middle is usually a Simple Moving Average (SMA) set to a period of 20 days (the type of trend line and period can be changed by the trader; however a 20 day moving average is by far the most popular).
The SMA then serves as a base for the Upper and Lower Bands which are used as a way to measure volatility by observing the relationship between the Bands and price.
Typically the Upper and Lower Bands are set to two standard deviations away from the SMA (The Middle Line); however the number of standard deviations can also be adjusted by the trader."
(TradingView)
Keltner Channels (KC)
"The Keltner Channels (KC) indicator is a banded indicator similar to Bollinger Bands and Moving Average Envelopes.
They consist of an Upper Envelope above a Middle Line as well as a Lower Envelope below the Middle Line.
The Middle Line is a moving average of price over a user-defined time period.
Either a simple moving average or an exponential moving average are typically used. The Upper and Lower Envelopes (user defined) are set a range away from the Middle Line.
This can be a multiple of the daily high/low range, or more commonly a multiple of the Average True Range."
(TradingView)
█ Examples
Bollinger Bands with 200 REMA:
Keltner Channel with 200 REMA:
Bollinger Bands with 55 ALMA:
Keltner Channel with 55 ALMA:
Bollinger Bands with 55 Least Squares Moving Average:
█ Thanks
- TradingView (BB, KC, ATR, MA's)
- everget (Regularized Exponential Moving Average)
- TimeFliesBuy ("Triple Bollinger Bands")
- Rashad ("Fibonacci Bollinger Bands")
- Dicargo_Beam ("Is the Bollinger Bands assumption wrong?")

WGMI Bands, ATR & Standard Deviation TableCreated this indicator for option premium selling.
Bands based on 2 to 3 Average True Range or Standard Deviation (whichever is higher).
Table with ATR and Standard Deviation values.

No Climactic BarsThis script can be used to detect large candles, similiar to ATR, using the variance of a sliding windows and certain threshold.

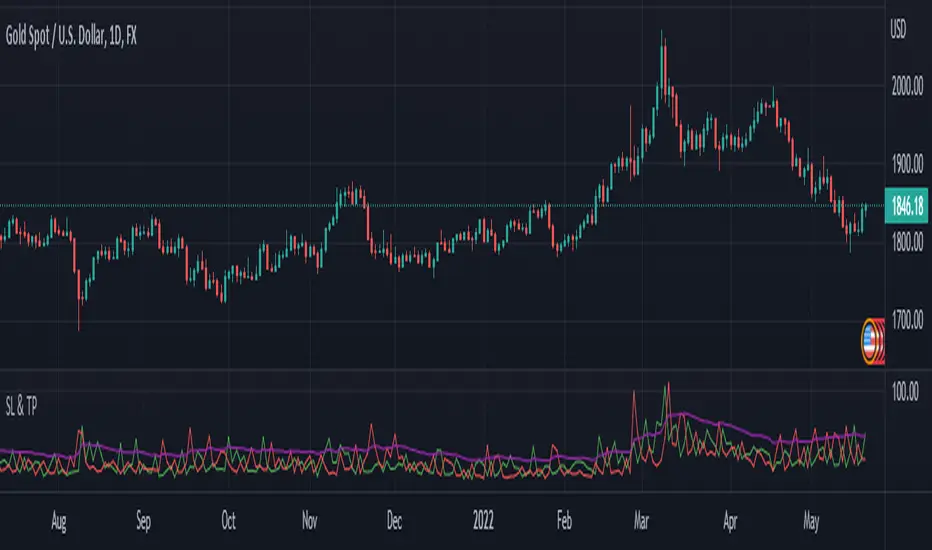
SL and TP - ATRThis indicator is using ATR ( Average True Range ) to set the Target point and Stop loss.
Use the pink number as target, always.
If you are in Long position, use the green number as stop loss, so the red number is not useful in Buys.
If you are in Short position, use the Red number as stop loss, so the green number is not useful in Sells.
** Need to enter the numbers in ticks --> VERY IMPORTANT: Write it completely, even the numbers after the point sign but DO NOT WRITE the point sign itself. e.g. : if the target tick on indicator is 123.75, you have to write 12375 ticks for your TP. ( one more example: If the number is 0.0001203 , write 1203 ticks. )
Enter the information of the opening candle.
Most of the times, risk/reward ratio is a bit higher than 1.
Works on multi timeframes. P.S: Haven't checked the weekly timeframe.
Not trying to oversell the indicator, but this is perhaps the best TP/SL specifier.
For beauty purposes, change (Sl @ buy) and (TP @ sell) to histograms.
Histograms are only for visual purposes. Customize the indicator as you want :)) Hope you enjoy
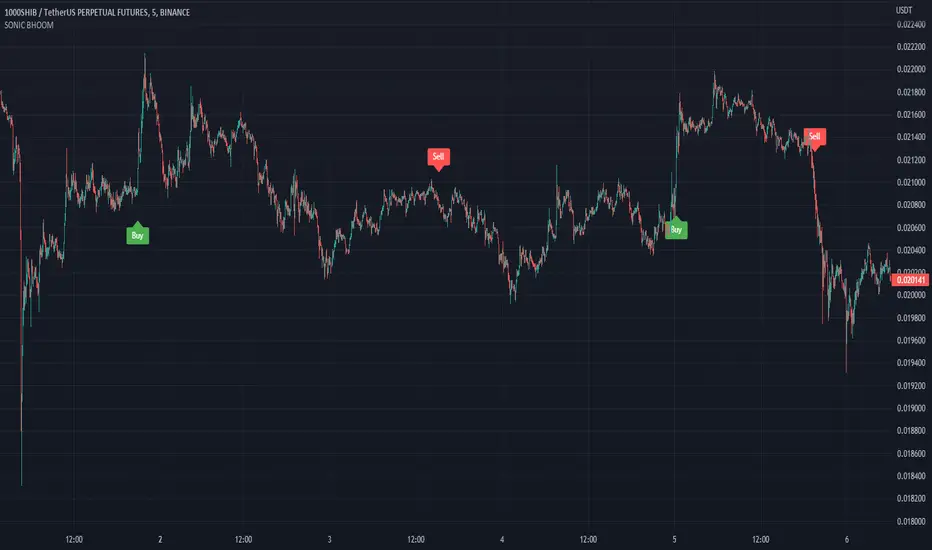
SONIC BHOOM👉 What is this indicator ?
This indicator is made up of Trend and Moving Average, The idea used in this indicator is to understand the current trend and take buy sell entry based on moving average
👉 How many alarms does this indicator have ?
This indicator has two types of alarm for buy signal and sell signal, and it is best to set the alarm by selecting the Alert Once Bar Close option to avoid repaint.
👉 On which coins can this indicator be used ?
This indicator is best used on all cryptocurrencies and forex markets, You can use this indicator with any Time Frame, and this indicator is set to the 1000SHIBUSDT Coin, 5min Time Frame by default. Use appropriate values when using other coins. If you have any difficulty in finding the Value, you can contact us.
Default Setup Instructions 👇
Duration: 5 Minute
Default Coin : 1000SHIBUSDT
The following settings can be found in this indicator
Trend Length :This is an average True change value, Average True Range (ATR) is the average of True ranges over the specified period. ATR measures volatility, taking into account any gaps in the price movement.
Trend High : This is the ATR Factor Value. You can change this value according to the volatility, the ATR Factor value is also used to reduce the chance of a fake signal
Threshold :
The Threshold is the difference between price and moving average. Changing the value of this option will change the accuracy of the trading signal
ATR with MAOVERVIEW
The Average True Range Moving Average (ATRMA) is a technical indicator that gauges the amount of volatility currently present in the market, relative to the historical average volatility that was present before. It adds a moving average to the Average True Range (ATR) indicator.
This indicator is extremely similar to the VOXI indicator, but instead of measuring volume, it measures volatility. Volume measures the amount of shares/lots/units/contracts exchanged per unit of time. Volatility, on the other hand, measures the range of price movement per unit of time.
The purpose of this indicator is to help traders filter between non-volatile periods in the market from volatile periods in the market without introducing subjectivity. It can also help long-term investors to determine market regime using volatility without introducing subjectivity.
CONCEPTS
This indicator assumes that trends are more likely to start during periods of high volatility, and consolidation is more likely to persist during periods of low volatility. The indicator also assumes that the average true range (ATR) of the last 14 candles is reflective of the current volatility in the market. ATR is the average height of all the candles, where height = |high - low|.
Suppose the ATR of the last 14 candles is greater than a moving average of the ATR(14) of the last 20 candles (this occurs whenever the indicator's filled region is colored BLUE). In that case, we can assume that the current volatility in the market is high.
Suppose the ATR of the last 14 candles is less than the moving average of the ATR(14) of the last 20 candles (this occurs whenever the indicator's filled region is colored RED). In that case, we can assume that the current volatility in the market is low.
HOW DO I READ THIS INDICATOR?
If the ATR line is above the ATR MA line (indicated by the blue color), the current volatility is greater than the historical average volatility.
If the ATR line is above the ATR MA line (indicated by the red color), the current volatility is less than the historical average volatility.

Supertrend with TP by Furkan SancuSimple Supertrend strategy with Take Profit levels.
Note: Make sure TP amounts add up to 100.
Opens a position with Supertrends strategy then adds Take Profit points with certain amounts of current position.
Multiple MAs + No Trend Zone + ATR WidgetThis is my first Pine Script attempt. Nothing special, just an "all in one" for the most common things I use, and what I have found to be the most common in a lot of strategies.
Great for free and limited accounts as it combines 7 total indicators into one.
-- First 5 indicators are Independant Moving Averages:
-Each one can be set for length, as well as source and type (SMA, EMA, SMMA, WMA, VWMA) individually
-- Second type (6th) of indicator is one I find extremly useful for staying OUT of consolidation trading. It's called a "No Trend Zone" indicator I swipped from the Hoffman Startegy. Basically, its set for a small deviation (0.5) of a 35 EMA, which creates a "Band" around the 35 line. When you have this "Band" flat or with no discernable incline/decline, with price action OR some or multiple moving averages inside this banded zone, it typically indicates a zone of consolidation. This will help you identify when you may be in one of those zones, that way you don't get trapped "waiting for paint to dry" before the market starts to move again with your position, and keep you from entering should you be considering the market at that time.
The last indicator is my favorite, and one I will refine a little deeper soon.
-- The ATR widget finishes us out. This widget can be customized for colors, turned on or off, and automatically rounds the ATR (ATR period based on the chart timeframe) to a nice readable number for what you're trading. It has settings to show or not, the length, what rounding style to use (forex pip 0.0001, forex/stock/etf/indicies 0.01) where to show it on the pane, a Multiplier Factor (for stop loss calculations automatically) and the colors.
***NOTE ABOUT ATR WIDGET:
I am primarily a forex trader, so the defaults are for Forex 0.0001. If you see some odd numbers (like 55798 on a current chart), check the inputs tab on the settings, and change the "ATR Style" from "Forex 0.0001" to "Forex/Stock/ETF/Indicies 0.01", and you should arrive with the correct number.

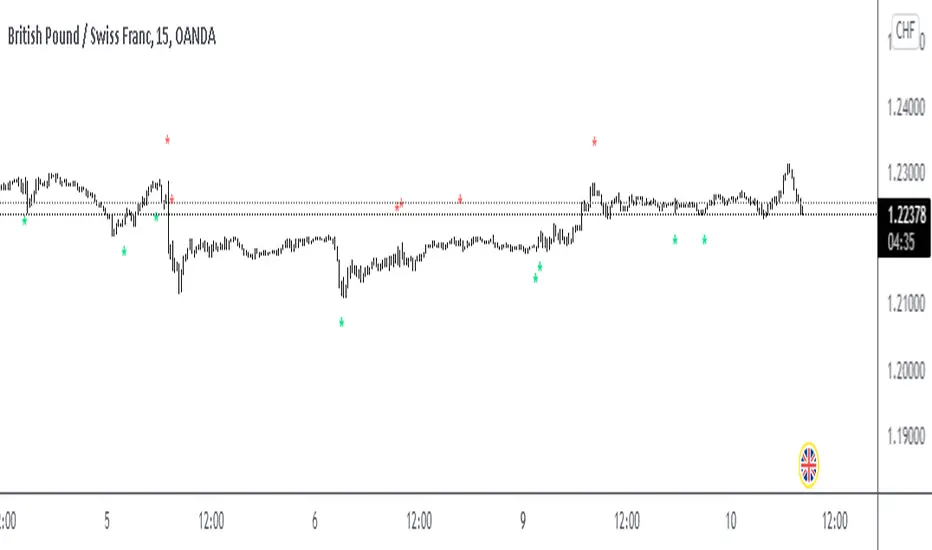
Trend MasterThis is a trend aggregator for confirmation and trend signals. It basically aggregates many buy/sell signals and confirmation and by combining them provides a strong buy/sell signal or trend confirmation.
The actual layout idea and trend confirmation is derived from Trend Meter and this indicator uses few other indicator, such as Chandelier Exit, WaveTrend, QQE Signals, Parabolic SAR and AlphaTrend. This indicator aggregates signal from different methods to find out more powerful and confirmed Trend and combines them into one Signal. It also uses Technical Ratings from TradingView team to filter out false signal, it tremendously opts out false signals and improve profitability.
The first seven dots are these
All 3 Trend Meters Now Align
MACD Crossover - Fast - 8, 21, 5
RSI 13: > or < 50
RSI 5: > or < 50
MA Crossover
MA Crossover
Chaikin Money Flow
Alphatrend
Technical Ratings
Then trend
Chandelier Exit
WaveTrend
QQE Signals
Parabolic Sar
All 3 Trend Meters aligns and A signal from trend i
Instructions
Change buy/sell policy based on market trend
Works on all TimeFrame but gives more accuracy on 4H, 1D.
Buy when green big dot appears at the bottom.
Sell when red big dot appears at the bottom.
Red/green dot at the top line appears when three trend meter is aligned and this is a good confirmation.
Any red/green dot below horizontal bars are trend signals.
Big red/green got at the bottom appears whenever there's a good confirmation from trend meter and a buy/sell signal comes from any trend signals.
Also look on the technical ratings bar, green means buy, red means sell and yellow means neutral.
Look for Support or Resistance Levels for price to be attracted to.
Find confluence with other indicators.
The more Trend meters are lit up the better.
Alert
01 Buy Signal = Strong Buy Signal
02 Sell Signal = Strong Sell Signal
03 Buy Signal = Strong Buy Signal
04 Sell Signal = Strong Sell Signal
Thanks to TradingView Technical Ratings authors, evergot, Lij_MC, KivancOzbilgic for their work. This indicator was heavily inspired from their work.

Stop Hunt MMMConcept to detect candle with body and tail ratio and filter by ATR.
Detect Stop hunt, normally use in TF15 min
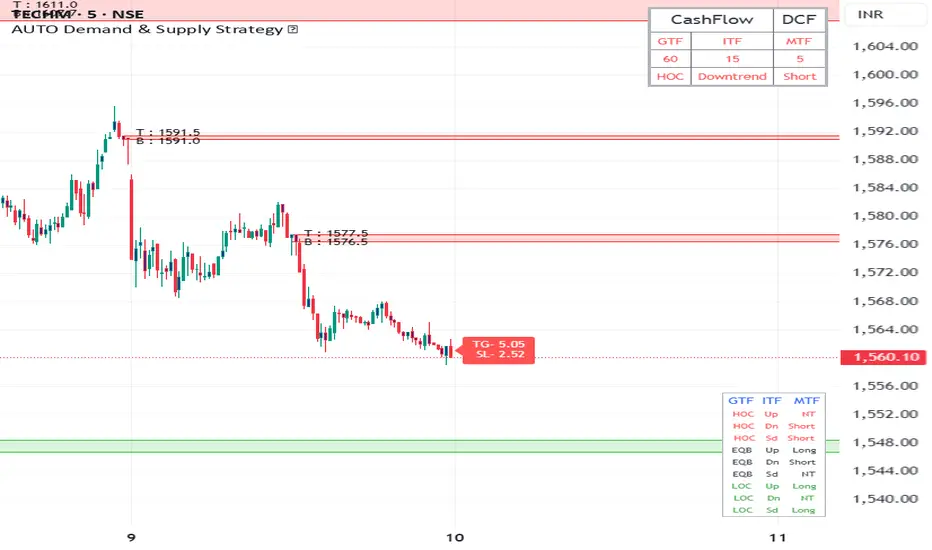
AUTO Demand & Supply Strategy * This Indicator is based on Demand and Supply Zone Strategy.
How does this Indicator Works ?
1. This Indicator Provides Option to choose the Cashflow type, which you wanted to trade in next session, like Daily Cashflow, Weekly Cashflow, Monthly Cashflow, Quarterly Cashflow, so that Indicator does not mess in other timeframes except chosen cashflow, so chart looks clean.
2. This Indicator will Automatically Identifies Demand & Supply Zones based on Price Action in Lower time frame and higher timeframes and Plot them on chart, with option to show the Entry Price of the zone. you can Change the color, thickness and background color of the Zones.
3. This Indicator also shows Demand & Supply Zones which are Tested Today, which means price touches the previous Demand & Supply zones today . indicator gives option to hide tested zone and their price.
4. Indicator will automatically plots vertical and horizontal line over 50days MA to Indicates Trend in Intermediate Timeframe(ITF) of the chosen cashflow. you can change the color and thickness of the line
5. Indicator will Automatically Calculate ATR multiplier Stop-loss and Target in Minor Time Frame of Chosen Cashflow, Indicator gives option choose ATR multiplied value and Target Ratio, You have to consider this Stop-loss & Target value only when the candle retest(touches) the zone.
6. Automatically Draws Demand and Supply zones of overnight Gaps. Indicator shows Entry Price of Proximal Line of zones, which can be turned off in the settings .
8. Indicator shows Warning in other timeframe except chosen Cashflow type to chose the proper time frame, also show warning if zones Plotting is off.
9. This Indicator shows information table on right side of the chart about the chosen Cashflow Type, Trend in ITF and Entry Decisions according to conditions .
Stochastic ATR Volatility OscillatorNOTES: As x, k and d use;
21-10-3 for 1 Hour candles
5-4-2 for 4 Hour candles
21-21-3 for 1 Day candles
Yellow plot is the main oscillator. Orange plot, and hlines at 20, 50 and 80 can be used as signal lines.
I personally use hlines as the signal in 1H as it's the best timeframe for the indicator.
If you are in a long position, sell when yellow plot crosses 80 or 50 line downwards;
and buy when the line crosses 20, 50 or 75 upwards while you are not in a trade.
