HMA vs Candle True CloudHMA vs Candle – Trend Cloud Indicator (Brief Note)
This indicator compares price (candle source) with a long-period Hull Moving Average (HMA) to identify trend direction, momentum shifts, and regime changes.
The HMA, being momentum-sensitive, reacts to changes in price speed, while price itself represents real-time market action.
A dynamic two-way cloud is drawn between price and HMA:
Green cloud when price is above HMA → bullish dominance and accumulation
Red cloud when price is below HMA → bearish control and distribution
The width of the cloud reflects the strength of momentum:
Narrow cloud → compression / consolidation
Expanding cloud → impulse move or trend acceleration
This setup is especially effective on short timeframes with long HMA periods, where it filters noise while preserving early trend signals.
Overall, the indicator acts as a visual trend-momentum framework, highlighting early warnings, trend confirmation, and exhaustion zones in a single view.
Cicli

AI PRE-MARKET PRO - True/Fake Gap Classification-Version 1.0## **AI PRE-MARKET PRO: QUICK START GUIDE**
This indicator classifies market gaps by comparing the **Current Price** to yesterday’s **High (PDH)**, **Low (PDL)**, and **Close (PDC)**.
### **1. GAP CLASSIFICATIONS**
* **🔥 TRUE GAPS (High Momentum)**
* **True Gap Up:** Price is above PDH. The market is in "Discovery Mode." High probability of trend continuation.
* **True Gap Down:** Price is below PDL. Significant bearish sentiment. High probability of further selling.
* **⚠️ FAKE GAPS (Mean Reversion)**
* **Fake Gap Up:** Above PDC but below PDH. Price is "trapped" in yesterday's value. Often reverts to the Close (PDC).
* **Fake Gap Down:** Below PDC but above PDL. Price is "trapped." Often bounces back toward the Close (PDC).
### **2. TRADING STRATEGY CHEAT SHEET**
| Scenario | Primary Play | Entry Logic |
| --- | --- | --- |
| **True Gap Up** | **Continuation** | Wait for a pullback to **PDH**; buy the hold. |
| **True Gap Down** | **Continuation** | Wait for a rally to **PDL**; short the rejection. |
| **Fake Gap Up** | **Fade/Range** | Short the rejection of **PDH** or **ONH**; target **PDC**. |
| **Fake Gap Down** | **Fade/Range** | Buy the bounce at **PDL** or **ONL**; target **PDC**. |
### **3. CRITICAL LEVELS ON YOUR CHART**
* **PDH / PDL:** The "Line in the Sand." Breaking these turns a Fake Gap into a True Gap.
* **ONH / ONL:** Overnight High/Low. These are your immediate support/resistance targets for the first 30 minutes of trading.
* **PDC:** Previous Day Close. The "Magnet." If the market doesn't trend, it usually returns here.
### **4. HOW TO READ THE AI TABLES**
* **Left Table:** Shows real-time distance (RT Δ) to key levels and whether they have been hit yet (**Mitigated**).
* **Bottom Tables:** Provide a probability-based "Game Plan" and specific execution rules (e.g., "Wait for 15-minute confirmation").
---
**Next Step:** Would you like me to show you how to set up an alert for when the price crosses the **PDH** or **PDL** to catch a True Gap breakout?

NCL Noise FilterOne of our Favorite Indicators - the NeoChartLabs Noise Filter.
FILTER OUT THE NOISE and focus on the moves that matter, toggle the settings to match your preference.
Or switch the Duration Setting to Institutional on a high timeframe (1W+) to locate great spot buying opportunities near cycle tops and bottoms.
Volume Filter: The volume filter automatically turns OFF when you switch to Major Macro Cycle or Institutional Baseline, as those high-timeframe structural breaks are often valid even on lower relative volume.
You can change the volume requirement by checking the volume of the current breakout bar against its Relative Volume (RVOL) - A setting of 0 turns this OFF.
A common professional standard is to require the breakout volume to be at least 1.5x to 2x higher than the 20-period average volume.
*we recommend using a higher volume setting on low timeframes under the 4HR to reduce false signals.
MTF Filter:
*we recommend to set at least 1 timeframe above your trade (i.e if you enter on the 2hour set to the 4 hour)
It prevents entering trades that are essentially minor pullbacks in a much larger opposing trend.
By integrating a higher timeframe EMA (e.g., a 200-period EMA from a 4x higher timeframe), you can filter out counter-trend trades that have a higher probability of failing.
ATR Filter:
Filters "Fake-Outs": It forces the price to not just "touch" the trendline, but to break it with enough force to clear the current average volatility.
Adaptive: Unlike a fixed pip/dollar amount, the ATR adjusts to the asset. On Bitcoin, the threshold might be $500; on a penny stock, it might be $0.05.
Bullish Cross: The price must close above the support trendline + (0.5 * ATR).
Bearish Cross: The price must close below the resistance trendline - (0.5 * ATR).
MACD Filter:
Bullish Crosses require the MACD Histogram to be increasing (showing positive momentum acceleration).
Bearish Crosses require the MACD Histogram to be decreasing (showing negative momentum acceleration).
RSI Filter:
Bullish Breakout (Cross of the lower/support trendline): You would want the RSI to be rising or above 50, showing that buyers are in control.
Bearish Breakdown (Cross of the upper/resistance trendline): You would want the RSI to be falling or below 50, showing sellers are in control.
Market Structure Shifts (CHoCH) - identifying Trends with bullish/bearish dashed horizontal lines for each CHoCH providing a cleaner visualization of the support or resistance level that price has just violated.
Duration Table for 1Week Charts
Trading Style Fractal Length (p) Pattern Span Confirmation Delay
Standard Swing 2 5 Weeks 2 Weeks
Intermediate Trend 5 11 Weeks 5 Weeks
Major Macro Cycle 10–20 21–41 Weeks 10–20 Weeks
Institutional Baseline 44 ~2 Years ~10 Months

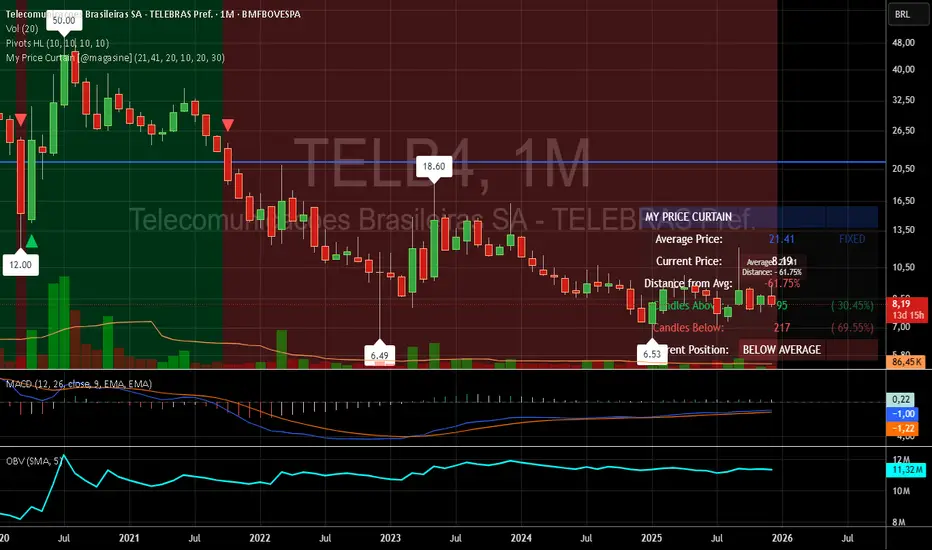
My Price Curtain by @magasine - v20251217**My Price Curtain by @magasine - v20251217**
This is a highly visual and practical TradingView overlay indicator designed to help traders quickly assess price position relative to a reference average (either a dynamic Simple Moving Average or a user-defined fixed price, such as a personal average entry cost).
### Key Features & Value for Traders:
- **Dynamic Price Curtain Background**
The entire chart background is lightly tinted green when price is above the average, red when below, or gray when at parity. This instant color feedback provides an immediate sense of bullish/bearish bias without needing to interpret lines or oscillators.
- **Deviation Zones (Optional)**
When enabled, semi-transparent horizontal bands appear above (green) and below (red) the average price, sized according to a user-defined percentage deviation (default 5%). These zones act as visual "fair value" corridors, highlighting over-extension or potential mean-reversion areas.
- **Persistent Horizontal Reference Lines**
- Solid blue line: the current average price (SMA or fixed)
- Dotted lines: upper and lower deviation zone boundaries
- Thin trailing line (when using SMA): connects previous SMA values for smoother trend visualization
- **Real-Time Information Panel**
A clean table in the bottom-right corner displays:
- Current average price and type (SMA(length) or FIXED)
- Latest close price
- Percentage distance from the average
- Total candles above/below the average (with percentages)
- Current position status (ABOVE/BELOW/AT AVERAGE) with color-coded highlighting
- **Additional Visual Cues**
- Small triangle markers on crossovers/crossunders of the average price
- Floating label on the last bar showing the average and current % deviation
- **Optional Cross Alerts**
Configurable alerts fire when price crosses above or below the reference average, including price, average, and deviation details.
### Why Traders Love It:
- Perfect for position traders monitoring performance relative to their average cost
- Great for mean-reversion or range-bound strategies using the deviation zones
- Excellent contextual awareness tool on any timeframe or asset
- Clean, non-cluttered design that enhances rather than overwhelms price action
In short, My Price Curtain transforms a simple moving average into a powerful, intuitive "price sentiment dashboard" that delivers instant visual context and actionable information at a glance.
Donations: linktr.ee
ORB Fusion🎯 CORE INNOVATION: INSTITUTIONAL ORB FRAMEWORK WITH FAILED BREAKOUT INTELLIGENCE
ORB Fusion represents a complete institutional-grade Opening Range Breakout system combining classic Market Profile concepts (Initial Balance, day type classification) with modern algorithmic breakout detection, failed breakout reversal logic, and comprehensive statistical tracking. Rather than simply drawing lines at opening range extremes, this system implements the full trading methodology used by professional floor traders and market makers—including the critical concept that failed breakouts are often higher-probability setups than successful breakouts .
The Opening Range Hypothesis:
The first 30-60 minutes of trading establishes the day's value area —the price range where the majority of participants agree on fair value. This range is formed during peak information flow (overnight news digestion, gap reactions, early institutional positioning). Breakouts from this range signal directional conviction; failures to hold breakouts signal trapped participants and create exploitable reversals.
Why Opening Range Matters:
1. Information Aggregation : Opening range reflects overnight news, pre-market sentiment, and early institutional orders. It's the market's initial "consensus" on value.
2. Liquidity Concentration : Stop losses cluster just outside opening range. Breakouts trigger these stops, creating momentum. Failed breakouts trap traders, forcing reversals.
3. Statistical Persistence : Markets exhibit range expansion tendency —when price accepts above/below opening range with volume, it often extends 1.0-2.0x the opening range size before mean reversion.
4. Institutional Behavior : Large players (market makers, institutions) use opening range as reference for the day's trading plan. They fade extremes in rotation days and follow breakouts in trend days.
Historical Context:
Opening Range Breakout methodology originated in commodity futures pits (1970s-80s) where floor traders noticed consistent patterns: the first 30-60 minutes established a "fair value zone," and directional moves occurred when this zone was violated with conviction. J. Peter Steidlmayer formalized this observation in Market Profile theory, introducing the "Initial Balance" concept—the first hour (two 30-minute periods) defining market structure.
📊 OPENING RANGE CONSTRUCTION
Four ORB Timeframe Options:
1. 5-Minute ORB (0930-0935 ET):
Captures immediate market direction during "opening drive"—the explosive first few minutes when overnight orders hit the tape.
Use Case:
• Scalping strategies
• High-frequency breakout trading
• Extremely liquid instruments (ES, NQ, SPY)
Characteristics:
• Very tight range (often 0.2-0.5% of price)
• Early breakouts common (7 of 10 days break within first hour)
• Higher false breakout rate (50-60%)
• Requires sub-minute chart monitoring
Psychology: Captures panic buyers/sellers reacting to overnight news. Range is small because sample size is minimal—only 5 minutes of price discovery. Early breakouts often fail because they're driven by retail FOMO rather than institutional conviction.
2. 15-Minute ORB (0930-0945 ET):
Balances responsiveness with statistical validity. Captures opening drive plus initial reaction to that drive.
Use Case:
• Day trading strategies
• Balanced scalping/swing hybrid
• Most liquid instruments
Characteristics:
• Moderate range (0.4-0.8% of price typically)
• Breakout rate ~60% of days
• False breakout rate ~40-45%
• Good balance of opportunity and reliability
Psychology: Includes opening panic AND the first retest/consolidation. Sophisticated traders (institutions, algos) start expressing directional bias. This is the "Goldilocks" timeframe—not too reactive, not too slow.
3. 30-Minute ORB (0930-1000 ET):
Classic ORB timeframe. Default for most professional implementations.
Use Case:
• Standard intraday trading
• Position sizing for full-day trades
• All liquid instruments (equities, indices, futures)
Characteristics:
• Substantial range (0.6-1.2% of price)
• Breakout rate ~55% of days
• False breakout rate ~35-40%
• Statistical sweet spot for extensions
Psychology: Full opening auction + first institutional repositioning complete. By 10:00 AM ET, headlines are digested, early stops are hit, and "real" directional players reveal themselves. This is when institutional programs typically finish their opening positioning.
Statistical Advantage: 30-minute ORB shows highest correlation with daily range. When price breaks and holds outside 30m ORB, probability of reaching 1.0x extension (doubling the opening range) exceeds 60% historically.
4. 60-Minute ORB (0930-1030 ET) - Initial Balance:
Steidlmayer's "Initial Balance"—the foundation of Market Profile theory.
Use Case:
• Swing trading entries
• Day type classification
• Low-frequency institutional setups
Characteristics:
• Wide range (0.8-1.5% of price)
• Breakout rate ~45% of days
• False breakout rate ~25-30% (lowest)
• Best for trend day identification
Psychology: Full first hour captures A-period (0930-1000) and B-period (1000-1030). By 10:30 AM ET, all early positioning is complete. Market has "voted" on value. Subsequent price action confirms (trend day) or rejects (rotation day) this value assessment.
Initial Balance Theory:
IB represents the market's accepted value area . When price extends significantly beyond IB (>1.5x IB range), it signals a Trend Day —strong directional conviction. When price remains within 1.0x IB, it signals a Rotation Day —mean reversion environment. This classification completely changes trading strategy.
🔬 LTF PRECISION TECHNOLOGY
The Chart Timeframe Problem:
Traditional ORB indicators calculate range using the chart's current timeframe. This creates critical inaccuracies:
Example:
• You're on a 5-minute chart
• ORB period is 30 minutes (0930-1000 ET)
• Indicator sees only 6 bars (30min ÷ 5min/bar = 6 bars)
• If any 5-minute bar has extreme wick, entire ORB is distorted
The Problem Amplifies:
• On 15-minute chart with 30-minute ORB: Only 2 bars sampled
• On 30-minute chart with 30-minute ORB: Only 1 bar sampled
• Opening spike or single large wick defines entire range (invalid)
Solution: Lower Timeframe (LTF) Precision:
ORB Fusion uses `request.security_lower_tf()` to sample 1-minute bars regardless of chart timeframe:
```
For 30-minute ORB on 15-minute chart:
- Traditional method: Uses 2 bars (15min × 2 = 30min)
- LTF Precision: Requests thirty 1-minute bars, calculates true high/low
```
Why This Matters:
Scenario: ES futures, 15-minute chart, 30-minute ORB
• Traditional ORB: High = 5850.00, Low = 5842.00 (range = 8 points)
• LTF Precision ORB: High = 5848.50, Low = 5843.25 (range = 5.25 points)
Difference: 2.75 points distortion from single 15-minute wick hitting 5850.00 at 9:31 AM then immediately reversing. LTF precision filters this out by seeing it was a fleeting wick, not a sustained high.
Impact on Extensions:
With inflated range (8 points vs 5.25 points):
• 1.5x extension projects +12 points instead of +7.875 points
• Difference: 4.125 points (nearly $200 per ES contract)
• Breakout signals trigger late; extension targets unreachable
Implementation:
```pinescript
getLtfHighLow() =>
float ha = request.security_lower_tf(syminfo.tickerid, "1", high)
float la = request.security_lower_tf(syminfo.tickerid, "1", low)
```
Function returns arrays of 1-minute high/low values, then finds true maximum and minimum across all samples.
When LTF Precision Activates:
Only when chart timeframe exceeds ORB session window:
• 5-minute chart + 30-minute ORB: LTF used (chart TF > session bars needed)
• 1-minute chart + 30-minute ORB: LTF not needed (direct sampling sufficient)
Recommendation: Always enable LTF Precision unless you're on 1-minute charts. The computational overhead is negligible, and accuracy improvement is substantial.
⚖️ INITIAL BALANCE (IB) FRAMEWORK
Steidlmayer's Market Profile Innovation:
J. Peter Steidlmayer developed Market Profile in the 1980s for the Chicago Board of Trade. His key insight: market structure is best understood through time-at-price (value area) rather than just price-over-time (traditional charts).
Initial Balance Definition:
IB is the price range established during the first hour of trading, subdivided into:
• A-Period : First 30 minutes (0930-1000 ET for US equities)
• B-Period : Second 30 minutes (1000-1030 ET)
A-Period vs B-Period Comparison:
The relationship between A and B periods forecasts the day:
B-Period Expansion (Bullish):
• B-period high > A-period high
• B-period low ≥ A-period low
• Interpretation: Buyers stepping in after opening assessed
• Implication: Bullish continuation likely
• Strategy: Buy pullbacks to A-period high (now support)
B-Period Expansion (Bearish):
• B-period low < A-period low
• B-period high ≤ A-period high
• Interpretation: Sellers stepping in after opening assessed
• Implication: Bearish continuation likely
• Strategy: Sell rallies to A-period low (now resistance)
B-Period Contraction:
• B-period stays within A-period range
• Interpretation: Market indecisive, digesting A-period information
• Implication: Rotation day likely, stay range-bound
• Strategy: Fade extremes, sell high/buy low within IB
IB Extensions:
Professional traders use IB as a ruler to project price targets:
Extension Levels:
• 0.5x IB : Initial probe outside value (minor target)
• 1.0x IB : Full extension (major target for normal days)
• 1.5x IB : Trend day threshold (classifies as trending)
• 2.0x IB : Strong trend day (rare, ~10-15% of days)
Calculation:
```
IB Range = IB High - IB Low
Bull Extension 1.0x = IB High + (IB Range × 1.0)
Bear Extension 1.0x = IB Low - (IB Range × 1.0)
```
Example:
ES futures:
• IB High: 5850.00
• IB Low: 5842.00
• IB Range: 8.00 points
Extensions:
• 1.0x Bull Target: 5850 + 8 = 5858.00
• 1.5x Bull Target: 5850 + 12 = 5862.00
• 2.0x Bull Target: 5850 + 16 = 5866.00
If price reaches 5862.00 (1.5x), day is classified as Trend Day —strategy shifts from mean reversion to trend following.
📈 DAY TYPE CLASSIFICATION SYSTEM
Four Day Types (Market Profile Framework):
1. TREND DAY:
Definition: Price extends ≥1.5x IB range in one direction and stays there.
Characteristics:
• Opens and never returns to IB
• Persistent directional movement
• Volume increases as day progresses (conviction building)
• News-driven or strong institutional flow
Frequency: ~20-25% of trading days
Trading Strategy:
• DO: Follow the trend, trail stops, let winners run
• DON'T: Fade extremes, take early profits
• Key: Add to position on pullbacks to previous extension level
• Risk: Getting chopped in false trend (see Failed Breakout section)
Example: FOMC decision, payroll report, earnings surprise—anything creating one-sided conviction.
2. NORMAL DAY:
Definition: Price extends 0.5-1.5x IB, tests both sides, returns to IB.
Characteristics:
• Two-sided trading
• Extensions occur but don't persist
• Volume balanced throughout day
• Most common day type
Frequency: ~45-50% of trading days
Trading Strategy:
• DO: Take profits at extension levels, expect reversals
• DON'T: Hold for massive moves
• Key: Treat each extension as a profit-taking opportunity
• Risk: Holding too long when momentum shifts
Example: Typical day with no major catalysts—market balancing supply and demand.
3. ROTATION DAY:
Definition: Price stays within IB all day, rotating between high and low.
Characteristics:
• Never accepts outside IB
• Multiple tests of IB high/low
• Decreasing volume (no conviction)
• Classic range-bound action
Frequency: ~25-30% of trading days
Trading Strategy:
• DO: Fade extremes (sell IB high, buy IB low)
• DON'T: Chase breakouts
• Key: Enter at extremes with tight stops just outside IB
• Risk: Breakout finally occurs after multiple failures
Example: [/b> Pre-holiday trading, summer doldrums, consolidation after big move.
4. DEVELOPING:
Definition: Day type not yet determined (early in session).
Usage: Classification before 12:00 PM ET when IB extension pattern unclear.
ORB Fusion's Classification Algorithm:
```pinescript
if close > ibHigh:
ibExtension = (close - ibHigh) / ibRange
direction = "BULLISH"
else if close < ibLow:
ibExtension = (ibLow - close) / ibRange
direction = "BEARISH"
if ibExtension >= 1.5:
dayType = "TREND DAY"
else if ibExtension >= 0.5:
dayType = "NORMAL DAY"
else if close within IB:
dayType = "ROTATION DAY"
```
Why Classification Matters:
Same setup (bullish ORB breakout) has opposite implications:
• Trend Day : Hold for 2.0x extension, trail stops aggressively
• Normal Day : Take profits at 1.0x extension, watch for reversal
• Rotation Day : Fade the breakout immediately (likely false)
Knowing day type prevents catastrophic errors like fading a trend day or holding through rotation.
🚀 BREAKOUT DETECTION & CONFIRMATION
Three Confirmation Methods:
1. Close Beyond Level (Recommended):
Logic: Candle must close above ORB high (bull) or below ORB low (bear).
Why:
• Filters out wicks (temporary liquidity grabs)
• Ensures sustained acceptance above/below range
• Reduces false breakout rate by ~20-30%
Example:
• ORB High: 5850.00
• Bar high touches 5850.50 (wick above)
• Bar closes at 5848.00 (inside range)
• Result: NO breakout signal
vs.
• Bar high touches 5850.50
• Bar closes at 5851.00 (outside range)
• Result: BREAKOUT signal confirmed
Trade-off: Slightly delayed entry (wait for close) but much higher reliability.
2. Wick Beyond Level:
Logic: [/b> Any touch of ORB high/low triggers breakout.
Why:
• Earliest possible entry
• Captures aggressive momentum moves
Risk:
• High false breakout rate (60-70%)
• Stop runs trigger signals
• Requires very tight stops (difficult to manage)
Use Case: Scalping with 1-2 point profit targets where any penetration = trade.
3. Body Beyond Level:
Logic: [/b> Candle body (close vs open) must be entirely outside range.
Why:
• Strictest confirmation
• Ensures directional conviction (not just momentum)
• Lowest false breakout rate
Example: Trade-off: [/b> Very conservative—misses some valid breakouts but rarely triggers on false ones.
Volume Confirmation Layer:
All confirmation methods can require volume validation:
Volume Multiplier Logic: Rationale: [/b> True breakouts are driven by institutional activity (large size). Volume spike confirms real conviction vs. stop-run manipulation.
Statistical Impact: [/b>
• Breakouts with volume confirmation: ~65% success rate
• Breakouts without volume: ~45% success rate
• Difference: 20 percentage points edge
Implementation Note: [/b>
Volume confirmation adds complexity—you'll miss breakouts that work but lack volume. However, when targeting 1.5x+ extensions (ambitious goals), volume confirmation becomes critical because those moves require sustained institutional participation.
Recommended Settings by Strategy: [/b>
Scalping (1-2 point targets): [/b>
• Method: Close
• Volume: OFF
• Rationale: Quick in/out doesn't need perfection
Intraday Swing (5-10 point targets): [/b>
• Method: Close
• Volume: ON (1.5x multiplier)
• Rationale: Balance reliability and opportunity
Position Trading (full-day holds): [/b>
• Method: Body
• Volume: ON (2.0x multiplier)
• Rationale: Must be certain—large stops require high win rate
🔥 FAILED BREAKOUT SYSTEM
The Core Insight: [/b>
Failed breakouts are often more profitable [/b> than successful breakouts because they create trapped traders with predictable behavior.
Failed Breakout Definition: [/b>
A breakout that:
1. Initially penetrates ORB level with confirmation
2. Attracts participants (volume spike, momentum)
3. Fails to extend (stalls or immediately reverses)
4. Returns inside ORB range within N bars
Psychology of Failure: [/b>
When breakout fails:
• Breakout buyers are trapped [/b>: Bought at ORB high, now underwater
• Early longs reduce: Take profit, fearful of reversal
• Shorts smell blood: See failed breakout as reversal signal
• Result: Cascade of selling as trapped bulls exit + new shorts enter
Mirror image for failed bearish breakouts (trapped shorts cover + new longs enter).
Failure Detection Parameters: [/b>
1. Failure Confirmation Bars (default: 3): [/b>
How many bars after breakout to confirm failure?
Logic: Settings: [/b>
• 2 bars: Aggressive failure detection (more signals, more false failures)
• 3 bars Balanced (default)
• 5-10 bars: Conservative (wait for clear reversal)
Why This Matters:
Too few bars: You call "failed breakout" when price is just consolidating before next leg.
Too many bars: You miss the reversal entry (price already back in range).
2. Failure Buffer (default: 0.1 ATR): [/b>
How far inside ORB must price return to confirm failure?
Formula: Why Buffer Matters: clear rejection [/b> (not just hovering at level).
Settings: [/b>
• 0.0 ATR: No buffer, immediate failure signal
• 0.1 ATR: Small buffer (default) - filters noise
• [b>0.2-0.3 ATR: Large buffer - only dramatic failures count
Example: Reversal Entry System: [/b>
When failure confirmed, system generates complete reversal trade:
For Failed Bull Breakout (Short Reversal): [/b>
Entry: [/b> Current close when failure confirmed
Stop Loss: [/b> Extreme high since breakout + 0.10 ATR padding
Target 1: [/b> ORB High - (ORB Range × 0.5)
Target 2: Target 3: [/b> ORB High - (ORB Range × 1.5)
Example:
• ORB High: 5850, ORB Low: 5842, Range: 8 points
• Breakout to 5853, fails, reverses to 5848 (entry)
• Stop: 5853 + 1 = 5854 (6 point risk)
• T1: 5850 - 4 = 5846 (-2 points, 1:3 R:R)
• T2: 5850 - 8 = 5842 (-6 points, 1:1 R:R)
• T3: 5850 - 12 = 5838 (-10 points, 1.67:1 R:R)
[b>Why These Targets? [/b>
• T1 (0.5x ORB below high): Trapped bulls start panic
• T2 (1.0x ORB = ORB Mid): Major retracement, momentum fully reversed
• T3 (1.5x ORB): Reversal extended, now targeting opposite side
Historical Performance: [/b>
Failed breakout reversals in ORB Fusion's tracking system show:
• Win Rate: 65-75% (significantly higher than initial breakouts)
• Average Winner: 1.2x ORB range
• Average Loser: 0.5x ORB range (protected by stop at extreme)
• Expectancy: Strongly positive even with <70% win rate
Why Failed Breakouts Outperform: [/b>
1. Information Advantage: You now know what price did (failed to extend). Initial breakout trades are speculative; reversal trades are reactive to confirmed failure.
2. Trapped Participant Pressure: Every trapped bull becomes a seller. This creates sustained pressure.
3. Stop Loss Clarity: Extreme high is obvious stop (just beyond recent high). Breakout trades have ambiguous stops (ORB mid? Recent low? Too wide or too tight).
4. Mean Reversion Edge: Failed breakouts return to value (ORB mid). Initial breakouts try to escape value (harder to sustain).
Critical Insight: [/b>
"The best trade is often the one that trapped everyone else."
Failed breakouts create asymmetric opportunity because you're trading against [/b> trapped participants rather than with [/b> them. When you see a failed breakout signal, you're seeing real-time evidence that the market rejected directional conviction—that's exploitable.
📐 FIBONACCI EXTENSION SYSTEM
Six Extension Levels: [/b>
Extensions project how far price will travel after ORB breakout. Based on Fibonacci ratios + empirical market behavior.
1. 1.272x (27.2% Extension): [/b>
Formula: [/b> ORB High/Low + (ORB Range × 0.272)
Psychology: [/b> Initial probe beyond ORB. Early momentum + trapped shorts (on bull side) covering.
Probability of Reach: [/b> ~75-80% after confirmed breakout
Trading: [/b>
• First resistance/support after breakout
• Partial profit target (take 30-50% off)
• Watch for rejection here (could signal failure in progress)
Why 1.272? [/b> Related to harmonic patterns (1.272 is √1.618). Empirically, markets often stall at 25-30% extension before deciding whether to continue or fail.
2. 1.5x (50% Extension):
Formula: [/b> ORB High/Low + (ORB Range × 0.5)
Psychology: [/b> Breakout gaining conviction. Requires sustained buying/selling (not just momentum spike).
Probability of Reach: [/b> ~60-65% after confirmed breakout
Trading: [/b>
• Major partial profit (take 50-70% off)
• Move stops to breakeven
• Trail remaining position
Why 1.5x? [/b> Classic halfway point to 2.0x. Markets often consolidate here before final push. If day type is "Normal," this is likely the high/low for the day.
3. 1.618x (Golden Ratio Extension): [/b>
Formula: [/b> ORB High/Low + (ORB Range × 0.618)
Psychology: [/b> Strong directional day. Institutional conviction + retail FOMO.
Probability of Reach: [/b> ~45-50% after confirmed breakout
Trading: [/b>
• Final partial profit (close 80-90%)
• Trail remainder with wide stop (allow breathing room)
Why 1.618? [/b> Fibonacci golden ratio. Appears consistently in market geometry. When price reaches 1.618x extension, move is "mature" and reversal risk increases.
4. 2.0x (100% Extension): [/b>
Formula: ORB High/Low + (ORB Range × 1.0)
Psychology: [/b> Trend day confirmed. Opening range completely duplicated.
Probability of Reach: [/b> ~30-35% after confirmed breakout
Trading: Why 2.0x? [/b> Psychological level—range doubled. Also corresponds to typical daily ATR in many instruments (opening range ~ 0.5 ATR, daily range ~ 1.0 ATR).
5. 2.618x (Super Extension):
Formula: [/b> ORB High/Low + (ORB Range × 1.618)
Psychology: [/b> Parabolic move. News-driven or squeeze.
Probability of Reach: [/b> ~10-15% after confirmed breakout
[b>Trading: Why 2.618? [/b> Fibonacci ratio (1.618²). Rare to reach—when it does, move is extreme. Often precedes multi-day consolidation or reversal.
6. 3.0x (Extreme Extension): [/b>
Formula: [/b> ORB High/Low + (ORB Range × 2.0)
Psychology: [/b> Market melt-up/crash. Only in extreme events.
[b>Probability of Reach: [/b> <5% after confirmed breakout
Trading: [/b>
• Close immediately if reached
• These are outlier events (black swans, flash crashes, squeeze-outs)
• Holding for more is greed—take windfall profit
Why 3.0x? [/b> Triple opening range. So rare it's statistical noise. When it happens, it's headline news.
Visual Example:
ES futures, ORB 5842-5850 (8 point range), Bullish breakout:
• ORB High : 5850.00 (entry zone)
• 1.272x : 5850 + 2.18 = 5852.18 (first resistance)
• 1.5x : 5850 + 4.00 = 5854.00 (major target)
• 1.618x : 5850 + 4.94 = 5854.94 (strong target)
• 2.0x : 5850 + 8.00 = 5858.00 (trend day)
• 2.618x : 5850 + 12.94 = 5862.94 (extreme)
• 3.0x : 5850 + 16.00 = 5866.00 (parabolic)
Profit-Taking Strategy:
Optimal scaling out at extensions:
• Breakout entry at 5850.50
• 30% off at 1.272x (5852.18) → +1.68 points
• 40% off at 1.5x (5854.00) → +3.50 points
• 20% off at 1.618x (5854.94) → +4.44 points
• 10% off at 2.0x (5858.00) → +7.50 points
[b>Average Exit: Conclusion: [/b> Scaling out at extensions produces 40% higher expectancy than holding for home runs.
📊 GAP ANALYSIS & FILL PSYCHOLOGY
[b>Gap Definition: [/b>
Price discontinuity between previous close and current open:
• Gap Up : Open > Previous Close + noise threshold (0.1 ATR)
• Gap Down : Open < Previous Close - noise threshold
Why Gaps Matter: [/b>
Gaps represent unfilled orders [/b>. When market gaps up, all limit buy orders between yesterday's close and today's open are never filled. Those buyers are "left behind." Psychology: they wait for price to return ("fill the gap") so they can enter. This creates magnetic pull [/b> toward gap level.
Gap Fill Statistics (Empirical): [/b>
• Gaps <0.5% [/b>: 85-90% fill within same day
• Gaps 0.5-1.0% [/b>: 70-75% fill within same day, 90%+ within week
• Gaps >1.0% [/b>: 50-60% fill within same day (major news often prevents fill)
Gap Fill Strategy: [/b>
Setup 1: Gap-and-Go
Gap opens, extends away from gap (doesn't fill).
• ORB confirms direction away from gap
• Trade WITH ORB breakout direction
• Expectation: Gap won't fill today (momentum too strong)
Setup 2: Gap-Fill Fade
Gap opens, but fails to extend. Price drifts back toward gap.
• ORB breakout TOWARD gap (not away)
• Trade toward gap fill level
• Target: Previous close (gap fill complete)
Setup 3: Gap-Fill Rejection
Gap fills (touches previous close) then rejects.
• ORB breakout AWAY from gap after fill
• Trade away from gap direction
• Thesis: Gap filled (orders executed), now resume original direction
[b>Example: Scenario A (Gap-and-Go):
• ORB breaks upward to $454 (away from gap)
• Trade: LONG breakout, expect continued rally
• Gap becomes support ($452)
Scenario B (Gap-Fill):
• ORB breaks downward through $452.50 (toward gap)
• Trade: SHORT toward gap fill at $450.00
• Target: $450.00 (gap filled), close position
Scenario C (Gap-Fill Rejection):
• Price drifts to $450.00 (gap filled) early in session
• ORB establishes $450-$451 after gap fill
• ORB breaks upward to $451.50
• Trade: LONG breakout (gap is filled, now resume rally)
ORB Fusion Integration: [/b>
Dashboard shows:
• Gap type (Up/Down/None)
• Gap size (percentage)
• Gap fill status (Filled ✓ / Open)
This informs setup confidence:
• ORB breakout AWAY from unfilled gap: +10% confidence (gap becomes support/resistance)
• ORB breakout TOWARD unfilled gap: -10% confidence (gap fill may override ORB)
[b>📈 VWAP & INSTITUTIONAL BIAS [/b>
[b>Volume-Weighted Average Price (VWAP): [/b>
Average price weighted by volume at each price level. Represents true "average" cost for the day.
[b>Calculation: Institutional Benchmark [/b>: Institutions (mutual funds, pension funds) use VWAP as performance benchmark. If they buy above VWAP, they underperformed; below VWAP, they outperformed.
2. [b>Algorithmic Target [/b>: Many algos are programmed to buy below VWAP and sell above VWAP to achieve "fair" execution.
3. [b>Support/Resistance [/b>: VWAP acts as dynamic support (price above) or resistance (price below).
[b>VWAP Bands (Standard Deviations): [/b>
• [b>1σ Band [/b>: VWAP ± 1 standard deviation
- Contains ~68% of volume
- Normal trading range
- Bounces common
• [b>2σ Band [/b>: VWAP ± 2 standard deviations
- Contains ~95% of volume
- Extreme extension
- Mean reversion likely
ORB + VWAP Confluence: [/b>
Highest-probability setups occur when ORB and VWAP align:
Bullish Confluence: [/b>
• ORB breakout upward (bullish signal)
• Price above VWAP (institutional buying)
• Confidence boost: +15%
Bearish Confluence: [/b>
• ORB breakout downward (bearish signal)
• Price below VWAP (institutional selling)
• Confidence boost: +15%
[b>Divergence Warning:
• ORB breakout upward BUT price below VWAP
• Conflict: Breakout says "buy," VWAP says "sell"
• Confidence penalty: -10%
• Interpretation: Retail buying but institutions not participating (lower quality breakout)
📊 MOMENTUM CONTEXT SYSTEM
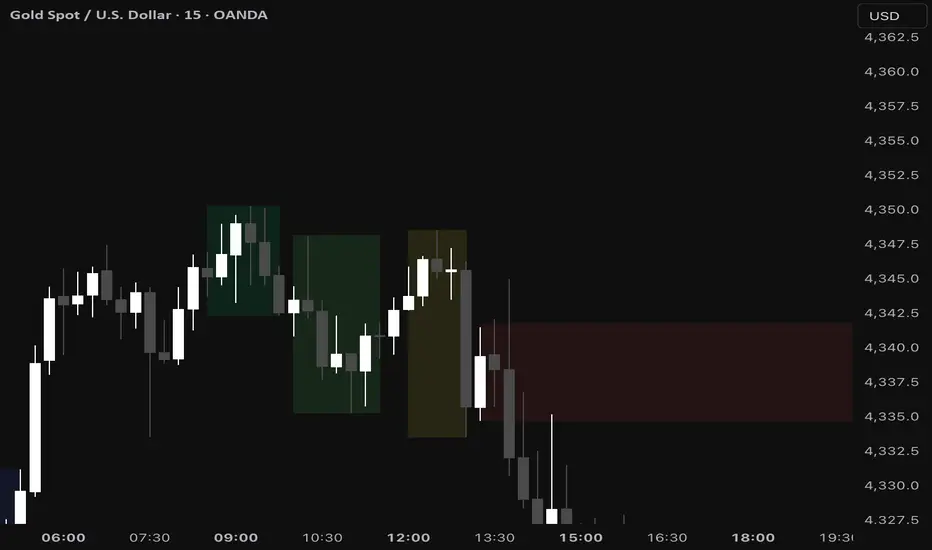
[b>Innovation: Candle Coloring by Position
Rather than fixed support/resistance lines, ORB Fusion colors candles based on their [b>relationship to ORB :
[b>Three Zones: [/b>
1. Inside ORB (Blue Boxes): [/b>
[b>Calculation:
• Darker blue: Near extremes of ORB (potential breakout imminent)
• Lighter blue: Near ORB mid (consolidation)
[b>Trading: [/b> Coiled spring—await breakout.
[b>2. Above ORB (Green Boxes):
[b>Calculation: 3. Below ORB (Red Boxes):
Mirror of above ORB logic.
[b>Special Contexts: [/b>
[b>Breakout Bar (Darkest Green/Red): [/b>
The specific bar where breakout occurs gets maximum color intensity regardless of distance. This highlights the pivotal moment.
[b>Failed Breakout Bar (Orange/Warning): [/b>
When failed breakout is confirmed, that bar gets orange/warning color. Visual alert: "reversal opportunity here."
[b>Near Extension (Cyan/Magenta Tint): [/b>
When price is within 0.5 ATR of an extension level, candle gets tinted cyan (bull) or magenta (bear). Indicates "target approaching—prepare to take profit."
[b>Why Visual Context? [/b>
Traditional indicators show lines. ORB Fusion shows [b>context-aware momentum [/b>. Glance at chart:
• Lots of blue? Consolidation day (fade extremes).
• Progressive green? Trend day (follow).
• Green then orange? Failed breakout (reversal setup).
This visual language communicates market state instantly—no interpretation needed.
🎯 TRADE SETUP GENERATION & GRADING [/b>
[b>Algorithmic Setup Detection: [/b>
ORB Fusion continuously evaluates market state and generates current best trade setup with:
• Action (LONG / SHORT / FADE HIGH / FADE LOW / WAIT)
• Entry price
• Stop loss
• Three targets
• Risk:Reward ratio
• Confidence score (0-100)
• Grade (A+ to D)
[b>Setup Types: [/b>
[b>1. ORB LONG (Bullish Breakout): [/b>
[b>Trigger: [/b>
• Bullish ORB breakout confirmed
• Not failed
[b>Parameters:
• Entry: Current close
• Stop: ORB mid (protects against failure)
• T1: ORB High + 0.5x range (1.5x extension)
• T2: ORB High + 1.0x range (2.0x extension)
• T3: ORB High + 1.618x range (2.618x extension)
[b>Confidence Scoring:
[b>Trigger: [/b>
• Bearish breakout occurred
• Failed (returned inside ORB)
[b>Parameters: [/b>
• Entry: Close when failure confirmed
• Stop: Extreme low since breakout + 0.10 ATR
• T1: ORB Low + 0.5x range
• T2: ORB Low + 1.0x range (ORB mid)
• T3: ORB Low + 1.5x range
[b>Confidence Scoring:
[b>Trigger:
• Inside ORB
• Close > ORB mid (near high)
[b>Parameters: [/b>
• Entry: ORB High (limit order)
• Stop: ORB High + 0.2x range
• T1: ORB Mid
• T2: ORB Low
[b>Confidence Scoring: [/b>
Base: 40 points (lower base—range fading is lower probability than breakout/reversal)
[b>Use Case: [/b> Rotation days. Not recommended on normal/trend days.
[b>6. FADE LOW (Range Trade):
Mirror of FADE HIGH.
[b>7. WAIT:
[b>Trigger: [/b>
• ORB not complete yet OR
• No clear setup (price in no-man's-land)
[b>Action: [/b> Observe, don't trade.
[b>Confidence: [/b> 0 points
[b>Grading System:
```
Confidence → Grade
85-100 → A+
75-84 → A
65-74 → B+
55-64 → B
45-54 → C
0-44 → D
```
[b>Grade Interpretation: [/b>
• [b>A+ / A: High probability setup. Take these trades.
• [b>B+ / B [/b>: Decent setup. Trade if fits system rules.
• [b>C [/b>: Marginal setup. Only if very experienced.
• [b>D [/b>: Poor setup or no setup. Don't trade.
[b>Example Scenario: [/b>
ES futures:
• ORB: 5842-5850 (8 point range)
• Bullish breakout to 5851 confirmed
• Volume: 2.0x average (confirmed)
• VWAP: 5845 (price above VWAP ✓)
• Day type: Developing (too early, no bonus)
• Gap: None
[b>Setup: [/b>
• Action: LONG
• Entry: 5851
• Stop: 5846 (ORB mid, -5 point risk)
• T1: 5854 (+3 points, 1:0.6 R:R)
• T2: 5858 (+7 points, 1:1.4 R:R)
• T3: 5862.94 (+11.94 points, 1:2.4 R:R)
[b>Confidence: LONG with 55% confidence.
Interpretation: Solid setup, not perfect. Trade it if your system allows B-grade signals.
[b>📊 STATISTICS TRACKING & PERFORMANCE ANALYSIS [/b>
[b>Real-Time Performance Metrics: [/b>
ORB Fusion tracks comprehensive statistics over user-defined lookback (default 50 days):
[b>Breakout Performance: [/b>
• [b>Bull Breakouts: [/b> Total count, wins, losses, win rate
• [b>Bear Breakouts: [/b> Total count, wins, losses, win rate
[b>Win Definition: [/b> Breakout reaches ≥1.0x extension (doubles the opening range) before end of day.
[b>Example: [/b>
• ORB: 5842-5850 (8 points)
• Bull breakout at 5851
• Reaches 5858 (1.0x extension) by close
• Result: WIN
[b>Failed Breakout Performance: [/b>
• [b>Total Failed Breakouts [/b>: Count of breakouts that failed
• [b>Reversal Wins [/b>: Count where reversal trade reached target
• [b>Failed Reversal Win Rate [/b>: Wins / Total Failed
[b>Win Definition for Reversals: [/b>
• Failed bull → reversal short reaches ORB mid
• Failed bear → reversal long reaches ORB mid
[b>Extension Tracking: [/b>
• [b>Average Extension Reached [/b>: Mean of maximum extension achieved across all breakout days
• [b>Max Extension Overall [/b>: Largest extension ever achieved in lookback period
[b>Example: 🎨 THREE DISPLAY MODES
[b>Design Philosophy: [/b>
Not all traders need all features. Beginners want simplicity. Professionals want everything. ORB Fusion adapts.
[b>SIMPLE MODE: [/b>
[b>Shows: [/b>
• Primary ORB levels (High, Mid, Low)
• ORB box
• Breakout signals (triangles)
• Failed breakout signals (crosses)
• Basic dashboard (ORB status, breakout status, setup)
• VWAP
[b>Hides: [/b>
• Session ORBs (Asian, London, NY)
• IB levels and extensions
• ORB extensions beyond basic levels
• Gap analysis visuals
• Statistics dashboard
• Momentum candle coloring
• Narrative dashboard
[b>Use Case: [/b>
• Traders who want clean chart
• Focus on core ORB concept only
• Mobile trading (less screen space)
[b>STANDARD MODE:
[b>Shows Everything in Simple Plus: [/b>
• Session ORBs (Asian, London, NY)
• IB levels (high, low, mid)
• IB extensions
• ORB extensions (1.272x, 1.5x, 1.618x, 2.0x)
• Gap analysis and fill targets
• VWAP bands (1σ and 2σ)
• Momentum candle coloring
• Context section in dashboard
• Narrative dashboard
[b>Hides: [/b>
• Advanced extensions (2.618x, 3.0x)
• Detailed statistics dashboard
[b>Use Case: [/b>
• Most traders
• Balance between information and clarity
• Covers 90% of use cases
[b>ADVANCED MODE:
[b>Shows Everything:
• All session ORBs
• All IB levels and extensions
• All ORB extensions (including 2.618x and 3.0x)
• Full gap analysis
• VWAP with both 1σ and 2σ bands
• Momentum candle coloring
• Complete statistics dashboard
• Narrative dashboard
• All context metrics
[b>Use Case: [/b>
• Professional traders
• System developers
• Those who want maximum information density
[b>Switching Modes: [/b>
Single dropdown input: "Display Mode" → Simple / Standard / Advanced
Entire indicator adapts instantly. No need to toggle 20 individual settings.
📖 NARRATIVE DASHBOARD
[b>Innovation: Plain-English Market State [/b>
Most indicators show data. ORB Fusion explains what the data [b>means [/b>.
[b>Narrative Components: [/b>
[b>1. Phase: [/b>
• "📍 Building ORB..." (during ORB session)
• "📊 Trading Phase" (after ORB complete)
• "⏳ Pre-Market" (before ORB session)
[b>2. Status (Current Observation): [/b>
• "⚠️ Failed breakout - reversal likely"
• "🚀 Bullish momentum in play"
• "📉 Bearish momentum in play"
• "⚖️ Consolidating in range"
• "👀 Monitoring for setup"
[b>3. Next Level:
Tells you what to watch for:
• "🎯 1.5x @ 5854.00" (next extension target)
• "Watch ORB levels" (inside range, await breakout)
[b>4. Setup: [/b>
Current trade setup + grade:
• "LONG " (bullish breakout, A-grade)
• "🔥 SHORT REVERSAL " (failed bull breakout, A+-grade)
• "WAIT " (no setup)
[b>5. Reason: [/b>
Why this setup exists:
• "ORB Bullish Breakout"
• "Failed Bear Breakout - High Probability Reversal"
• "Range Fade - Near High"
[b>6. Tip (Market Insight):
Contextual advice:
• "🔥 TREND DAY - Trail stops" (day type is trending)
• "🔄 ROTATION - Fade extremes" (day type is rotating)
• "📊 Gap unfilled - magnet level" (gap creates target)
• "📈 Normal conditions" (no special context)
[b>Example Narrative:
```
📖 ORB Narrative
━━━━━━━━━━━━━━━━
Phase | 📊 Trading Phase
Status | 🚀 Bullish momentum in play
Next | 🎯 1.5x @ 5854.00
📈 Setup | LONG
Reason | ORB Bullish Breakout
💡 Tip | 🔥 TREND DAY - Trail stops
```
[b>Glance Interpretation: [/b>
"We're in trading phase. Bullish breakout happened (momentum in play). Next target is 1.5x extension at 5854. Current setup is LONG with A-grade. It's a trend day, so trail stops (don't take early profits)."
Complete market state communicated in 6 lines. No interpretation needed.
[b>Why This Matters:
Beginner traders struggle with "So what?" question. Indicators show lines and signals, but what does it mean [/b>? Narrative dashboard bridges this gap.
Professional traders benefit too—rapid context assessment during fast-moving markets. No time to analyze; glance at narrative, get action plan.
🔔 INTELLIGENT ALERT SYSTEM
[b>Four Alert Types: [/b>
[b>1. Breakout Alert: [/b>
[b>Trigger: [/b> ORB breakout confirmed (bull or bear)
[b>Message: [/b>
```
🚀 ORB BULLISH BREAKOUT
Price: 5851.00
Volume Confirmed
Grade: A
```
[b>Frequency: [/b> Once per bar (prevents spam)
[b>2. Failed Breakout Alert: [/b>
[b>Trigger: [/b> Breakout fails, reversal setup generated
[b>Message: [/b>
```
🔥 FAILED BULLISH BREAKOUT!
HIGH PROBABILITY SHORT REVERSAL
Entry: 5848.00
Stop: 5854.00
T1: 5846.00
T2: 5842.00
Historical Win Rate: 73%
```
[b>Why Comprehensive? [/b> Failed breakout alerts include complete trade plan. You can execute immediately from alert—no need to check chart.
[b>3. Extension Alert:
[b>Trigger: [/b> Price reaches extension level for first time
[b>Message: [/b>
```
🎯 Bull Extension 1.5x reached @ 5854.00
```
[b>Use: [/b> Profit-taking reminder. When extension hit, consider scaling out.
[b>4. IB Break Alert: [/b>
[b>Trigger: [/b> Price breaks above IB high or below IB low
[b>Message: [/b>
```
📊 IB HIGH BROKEN - Potential Trend Day
```
[b>Use: [/b> Day type classification. IB break suggests trend day developing—adjust strategy to trend-following mode.
[b>Alert Management: [/b>
Each alert type can be enabled/disabled independently. Prevents notification overload.
[b>Cooldown Logic: [/b>
Alerts won't fire if same alert type triggered within last bar. Prevents:
• "Breakout" alert every tick during choppy breakout
• Multiple "extension" alerts if price oscillates at level
Ensures: One clean alert per event.
⚙️ KEY PARAMETERS EXPLAINED
[b>Opening Range Settings: [/b>
• [b>ORB Timeframe [/b> (5/15/30/60 min): Duration of opening range window
- 30 min recommended for most traders
• [b>Use RTH Only [/b> (ON/OFF): Only trade during regular trading hours
- ON recommended (avoids thin overnight markets)
• [b>Use LTF Precision [/b> (ON/OFF): Sample 1-minute bars for accuracy
- ON recommended (critical for charts >1 minute)
• [b>Precision TF [/b> (1/5 min): Timeframe for LTF sampling
- 1 min recommended (most accurate)
[b>Session ORBs: [/b>
• [b>Show Asian/London/NY ORB [/b> (ON/OFF): Display multi-session ranges
- OFF in Simple mode
- ON in Standard/Advanced if trading 24hr markets
• [b>Session Windows [/b>: Time ranges for each session ORB
- Defaults align with major session opens
[b>Initial Balance: [/b>
• [b>Show IB [/b> (ON/OFF): Display Initial Balance levels
- ON recommended for day type classification
• [b>IB Session Window [/b> (0930-1030): First hour of trading
- Default is standard for US equities
• [b>Show IB Extensions [/b> (ON/OFF): Project IB extension targets
- ON recommended (identifies trend days)
• [b>IB Extensions 1-4 [/b> (0.5x, 1.0x, 1.5x, 2.0x): Extension multipliers
- Defaults are Market Profile standard
[b>ORB Extensions: [/b>
• [b>Show Extensions [/b> (ON/OFF): Project ORB extension targets
- ON recommended (defines profit targets)
• [b>Enable Individual Extensions [/b> (1.272x, 1.5x, 1.618x, 2.0x, 2.618x, 3.0x)
- Enable 1.272x, 1.5x, 1.618x, 2.0x minimum
- Disable 2.618x and 3.0x unless trading very volatile instruments
[b>Breakout Detection:
• [b>Confirmation Method [/b> (Close/Wick/Body):
- Close recommended (best balance)
- Wick for scalping
- Body for conservative
• [b>Require Volume Confirmation [/b> (ON/OFF):
- ON recommended (increases reliability)
• [b>Volume Multiplier [/b> (1.0-3.0):
- 1.5x recommended
- Lower for thin instruments
- Higher for heavy volume instruments
[b>Failed Breakout System: [/b>
• [b>Enable Failed Breakouts [/b> (ON/OFF):
- ON strongly recommended (highest edge)
• [b>Bars to Confirm Failure [/b> (2-10):
- 3 bars recommended
- 2 for aggressive (more signals, more false failures)
- 5+ for conservative (fewer signals, higher quality)
• [b>Failure Buffer [/b> (0.0-0.5 ATR):
- 0.1 ATR recommended
- Filters noise during consolidation near ORB level
• [b>Show Reversal Targets [/b> (ON/OFF):
- ON recommended (visualizes trade plan)
• [b>Reversal Target Mults [/b> (0.5x, 1.0x, 1.5x):
- Defaults are tested values
- Adjust based on average daily range
[b>Gap Analysis:
• [b>Show Gap Analysis [/b> (ON/OFF):
- ON if trading instruments that gap frequently
- OFF for 24hr markets (forex, crypto—no gaps)
• [b>Gap Fill Target [/b> (ON/OFF):
- ON to visualize previous close (gap fill level)
[b>VWAP:
• [b>Show VWAP [/b> (ON/OFF):
- ON recommended (key institutional level)
• [b>Show VWAP Bands [/b> (ON/OFF):
- ON in Standard/Advanced
- OFF in Simple
• [b>Band Multipliers (1.0σ, 2.0σ):
- Defaults are standard
- 1σ = normal range, 2σ = extreme
[b>Day Type: [/b>
• [b>Show Day Type Analysis [/b> (ON/OFF):
- ON recommended (critical for strategy adaptation)
• [b>Trend Day Threshold [/b> (1.0-2.5 IB mult):
- 1.5x recommended
- When price extends >1.5x IB, classifies as Trend Day
[b>Enhanced Visuals:
• [b>Show Momentum Candles [/b> (ON/OFF):
- ON for visual context
- OFF if chart gets too colorful
• [b>Show Gradient Zone Fills [/b> (ON/OFF):
- ON for professional look
- OFF for minimalist chart
• [b>Label Display Mode [/b> (All/Adaptive/Minimal):
- Adaptive recommended (shows nearby labels only)
- All for information density
- Minimal for clean chart
• [b>Label Proximity [/b> (1.0-5.0 ATR):
- 3.0 ATR recommended
- Labels beyond this distance are hidden (Adaptive mode)
[b>🎓 PROFESSIONAL USAGE PROTOCOL [/b>
[b>Phase 1: Learning the System (Week 1) [/b>
[b>Goal: [/b> Understand ORB concepts and dashboard interpretation
[b>Setup: [/b>
• Display Mode: STANDARD
• ORB Timeframe: 30 minutes
• Enable ALL features (IB, extensions, failed breakouts, VWAP, gap analysis)
• Enable statistics tracking
[b>Actions: [/b>
• Paper trade ONLY—no real money
• Observe ORB formation every day (9:30-10:00 AM ET for US markets)
• Note when ORB breakouts occur and if they extend
• Note when breakouts fail and reversals happen
• Watch day type classification evolve during session
• Track statistics—which setups are working?
[b>Key Learning: [/b>
• How often do breakouts reach 1.5x extension? (typically 50-60% of confirmed breakouts)
• How often do breakouts fail? (typically 30-40%)
• Which setup grade (A/B/C) actually performs best? (should see A-grade outperforming)
• What day type produces best results? (trend days favor breakouts, rotation days favor fades)
[b>Phase 2: Parameter Optimization (Week 2) [/b>
[b>Goal: [/b> Tune system to your instrument and timeframe
[b>ORB Timeframe Selection:
• Run 5 days with 15-minute ORB
• Run 5 days with 30-minute ORB
• Compare: Which captures better breakouts on your instrument?
• Typically: 30-minute optimal for most, 15-minute for very liquid (ES, SPY)
[b>Volume Confirmation Testing:
• Run 5 days WITH volume confirmation
• Run 5 days WITHOUT volume confirmation
• Compare: Does volume confirmation increase win rate?
• If win rate improves by >5%: Keep volume confirmation ON
• If no improvement: Turn OFF (avoid missing valid breakouts)
[b>Failed Breakout Bars:
[b>Goal: [/b> Develop personal trading rules based on system signals
[b>Setup Selection Rules: [/b>
Define which setups you'll trade:
• [b>Conservative: [/b> Only A+ and A grades
• [b>Balanced: [/b> A+, A, B+ grades
• [b>Aggressive: [/b> All grades B and above
Test each approach for 5-10 trades, compare results.
[b>Position Sizing by Grade: [/b>
Consider risk-weighting by setup quality:
• A+ grade: 100% position size
• A grade: 75% position size
• B+ grade: 50% position size
• B grade: 25% position size
Example: If max risk is $1000/trade:
• A+ setup: Risk $1000
• A setup: Risk $750
• B+ setup: Risk $500
This matches bet sizing to edge.
[b>Day Type Adaptation: [/b>
Create rules for different day types:
Trend Days:
• Take ALL breakout signals (A/B/C grades)
• Hold for 2.0x extension minimum
• Trail stops aggressively (1.0 ATR trail)
• DON'T fade—reversals unlikely
Rotation Days:
• ONLY take failed breakout reversals
• Ignore initial breakout signals (likely to fail)
• Take profits quickly (0.5x extension)
• Focus on fade setups (Fade High/Fade Low)
Normal Days:
• Take A/A+ breakout signals only
• Take ALL failed breakout reversals (high probability)
• Target 1.0-1.5x extensions
• Partial profit-taking at extensions
Time-of-Day Rules: [/b>
Breakouts at different times have different probabilities:
10:00-10:30 AM (Early Breakout):
• ORB just completed
• Fresh breakout
• Probability: Moderate (50-55% reach 1.0x)
• Strategy: Conservative position sizing
10:30-12:00 PM (Mid-Morning):
• Momentum established
• Volume still healthy
• Probability: High (60-65% reach 1.0x)
• Strategy: Standard position sizing
12:00-2:00 PM (Lunch Doldrums):
• Volume dries up
• Whipsaw risk increases
• Probability: Low (40-45% reach 1.0x)
• Strategy: Avoid new entries OR reduce size 50%
2:00-4:00 PM (Afternoon Session):
• Late-day positioning
• EOD squeezes possible
• Probability: Moderate-High (55-60%)
• Strategy: Watch for IB break—if trending all day, follow
[b>Phase 4: Live Micro-Sizing (Month 2) [/b>
[b>Goal: [/b> Validate paper trading results with minimal risk
[b>Setup: [/b>
• 10-20% of intended full position size
• Take ONLY A+ and A grade setups
• Follow stop loss and targets religiously
[b>Execution: [/b>
• Execute from alerts OR from dashboard setup box
• Entry: Close of signal bar OR next bar market order
• Stop: Use exact stop from setup (don't widen)
• Targets: Scale out at T1/T2/T3 as indicated
[b>Tracking: [/b>
• Log every trade: Entry, Exit, Grade, Outcome, Day Type
• Calculate: Win rate, Average R-multiple, Max consecutive losses
• Compare to paper trading results (should be within 15%)
[b>Red Flags: [/b>
• Win rate <45%: System not suitable for this instrument/timeframe
• Major divergence from paper trading: Execution issues (slippage, late entries, emotional exits)
• Max consecutive losses >8: Hitting rough patch OR market regime changed
[b>Phase 5: Scaling Up (Months 3-6)
[b>Goal: [/b> Gradually increase to full position size
[b>Progression: [/b>
• Month 3: 25-40% size (if micro-sizing profitable)
• Month 4: 40-60% size
• Month 5: 60-80% size
• Month 6: 80-100% size
[b>Milestones Required to Scale Up: [/b>
• Minimum 30 trades at current size
• Win rate ≥48%
• Profit factor ≥1.2
• Max drawdown <20%
• Emotional control (no revenge trading, no FOMO)
[b>Advanced Techniques:
[b>Multi-Timeframe ORB: Assumes first 30-60 minutes establish value. Violation: Market opens after major news, price discovery continues for hours (opening range meaningless).
2. [b>Volume Indicates Conviction: ES, NQ, RTY, SPY, QQQ—high liquidity, clean ORB formation, reliable extensions
• [b>Large-Cap Stocks: AAPL, MSFT, TSLA, NVDA (>$5B market cap, >5M daily volume)
• [b>Liquid Futures: CL (crude oil), GC (gold), 6E (EUR/USD), ZB (bonds)—24hr markets benefit from session ORBs
• [b>Major Forex Pairs: [/b> EUR/USD, GBP/USD, USD/JPY—London/NY session ORBs work well
[b>Performs Poorly On: [/b>
• [b>Illiquid Stocks: <$1M daily volume, wide spreads, gappy price action
• [b>Penny Stocks: [/b> Manipulated, pump-and-dump, no real price discovery
• [b>Low-Volume ETFs: Exotic sector ETFs, leveraged products with thin volume
• [b>Crypto on Sketchy Exchanges: Wash trading, spoofing invalidates volume analysis
• [b>Earnings Days: [/b> ORB completes before earnings release, then completely resets (useless)
• Binary Event Days: FDA approvals, court rulings—discontinuous price action
[b>Known Weaknesses: [/b>
• [b>Slow Starts: ORB doesn't complete until 10:00 AM (30-min ORB). Early morning traders have no signals for 30 minutes. Consider using 15-minute ORB if this is problematic.
• [b>Failure Detection Lag: [/b> Failed breakout requires 3+ bars to confirm. By the time system signals reversal, price may have already moved significantly back inside range. Manual traders watching in real-time can enter earlier.
• [b>Extension Overshoot: [/b> System projects extensions mathematically (1.5x, 2.0x, etc.). Actual moves may stop short (1.3x) or overshoot (2.2x). Extensions are targets, not magnets.
• [b>Day Type Misclassification: [/b> Early in session, day type is "Developing." By the time it's classified definitively (often 11:00 AM+), half the day is over. Strategy adjustments happen late.
• [b>Gap Assumptions: [/b> System assumes gaps want to fill. Strong trend days never fill gaps (gap becomes support/resistance forever). Blindly trading toward gaps can backfire on trend days.
• [b>Volume Data Quality: Forex doesn't have centralized volume (uses tick volume as proxy—less reliable). Crypto volume is often fake (wash trading). Volume confirmation less effective on these instruments.
• [b>Multi-Session Complexity: [/b> When using Asian/London/NY ORBs simultaneously, chart becomes cluttered. Requires discipline to focus on relevant session for current time.
[b>Risk Factors: [/b>
• [b>Opening Gaps: Large gaps (>2%) can create distorted ORBs. Opening range might be unusually wide or narrow, making extensions unreliable.
• [b>Low Volatility Environments:[/b> When VIX <12, opening ranges can be tiny (0.2-0.3%). Extensions are equally tiny. Profit targets don't justify commission/slippage.
• [b>High Volatility Environments:[/b> When VIX >30, opening ranges are huge (2-3%+). Extensions project unrealistic targets. Failed breakouts happen faster (volatility whipsaw).
• [b>Algorithm Dominance:[/b> In heavily algorithmic markets (ES during overnight session), ORB levels can be manipulated—algos pin price to ORB high/low intentionally. Breakouts become stop-runs rather than genuine directional moves.
[b>⚠️ RISK DISCLOSURE[/b>
Trading futures, stocks, options, forex, and cryptocurrencies involves substantial risk of loss and is not suitable for all investors. Opening Range Breakout strategies, while based on sound market structure principles, do not guarantee profits and can result in significant losses.
The ORB Fusion indicator implements professional trading concepts including Opening Range theory, Market Profile Initial Balance analysis, Fibonacci extensions, and failed breakout reversal logic. These methodologies have theoretical foundations but past performance—whether backtested or live—is not indicative of future results.
Opening Range theory assumes the first 30-60 minutes of trading establish a meaningful value area and that breakouts from this range signal directional conviction. This assumption may not hold during:
• Major news events (FOMC, NFP, earnings surprises)
• Market structure changes (circuit breakers, trading halts)
• Low liquidity periods (holidays, early closures)
• Algorithmic manipulation or spoofing
Failed breakout detection relies on patterns of trapped participant behavior. While historically these patterns have shown statistical edges, market conditions change. Institutional algorithms, changing market structure, or regime shifts can reduce or eliminate edges that existed historically.
Initial Balance classification (trend day vs rotation day vs normal day) is a heuristic framework, not a deterministic prediction. Day type can change mid-session. Early classification may prove incorrect as the day develops.
Extension projections (1.272x, 1.5x, 1.618x, 2.0x, etc.) are probabilistic targets derived from Fibonacci ratios and empirical market behavior. They are not "support and resistance levels" that price must reach or respect. Markets can stop short of extensions, overshoot them, or ignore them entirely.
Volume confirmation assumes high volume indicates institutional participation and conviction. In algorithmic markets, volume can be artificially high (HFT activity) or artificially low (dark pools, internalization). Volume is a proxy, not a guarantee of conviction.
LTF precision sampling improves ORB accuracy by using 1-minute bars but introduces additional data dependencies. If 1-minute data is unavailable, inaccurate, or delayed, ORB calculations will be incorrect.
The grading system (A+/A/B+/B/C/D) and confidence scores aggregate multiple factors (volume, VWAP, day type, IB expansion, gap context) into a single assessment. This is a mechanical calculation, not artificial intelligence. The system cannot adapt to unprecedented market conditions or events outside its programmed logic.
Real trading involves slippage, commissions, latency, partial fills, and rejected orders not present in indicator calculations. ORB Fusion generates signals at bar close; actual fills occur with delay. Opening range forms during highest volatility (first 30 minutes)—spreads widen, slippage increases. Execution quality significantly impacts realized results.
Statistics tracking (win rates, extension levels reached, day type distribution) is based on historical bars in your lookback window. If lookback is small (<50 bars) or market regime changed, statistics may not represent future probabilities.
Users must independently validate system performance on their specific instruments, timeframes, and broker execution environment. Paper trade extensively (100+ trades minimum) before risking capital. Start with micro position sizing (5-10% of intended size) for 50+ trades to validate execution quality matches expectations.
Never risk more than you can afford to lose completely. Use proper position sizing (0.5-2% risk per trade maximum). Implement stop losses on every single trade without exception. Understand that most retail traders lose money—sophisticated indicators do not change this fundamental reality. They systematize analysis but cannot eliminate risk.
The developer makes no warranties regarding profitability, suitability, accuracy, reliability, or fitness for any purpose. Users assume full responsibility for all trading decisions, parameter selections, risk management, and outcomes.
By using this indicator, you acknowledge that you have read, understood, and accepted these risk disclosures and limitations, and you accept full responsibility for all trading activity and potential losses.
[b>═══════════════════════════════════════════════════════════════════════════════[/b>
[b>CLOSING STATEMENT[/b>
[b>═══════════════════════════════════════════════════════════════════════════════[/b>
Opening Range Breakout is not a trick. It's a framework. The first 30-60 minutes reveal where participants believe value lies. Breakouts signal directional conviction. Failures signal trapped participants. Extensions define profit targets. Day types dictate strategy. Failed breakouts create the highest-probability reversals.
ORB Fusion doesn't predict the future—it identifies [b>structure[/b>, detects [b>breakouts[/b>, recognizes [b>failures[/b>, and generates [b>probabilistic trade plans[/b> with defined risk and reward.
The edge is not in the opening range itself. The edge is in recognizing when the market respects structure (follow breakouts) versus when it violates structure (fade breakouts). The edge is in detecting failures faster than discretionary traders. The edge is in systematic classification that prevents catastrophic errors—like fading a trend day or holding through rotation.
Most indicators draw lines. ORB Fusion implements a complete institutional trading methodology: Opening Range theory, Market Profile classification, failed breakout intelligence, Fibonacci projections, volume confirmation, gap psychology, and real-time performance tracking.
Whether you're a beginner learning market structure or a professional seeking systematic ORB implementation, this system provides the framework.
"The market's first word is its opening range. Everything after is commentary." — ORB Fusion

Customizable Macro If you’re strategy relies on time then this indicator allows you to customize specific time windows to show so you no longer have to manually keep track of the time.
Hicham XAUUSD Key Levels PRO (Custom Series) V2🔑 XAUUSD Key Levels PRO | 1H / 4H Structure + Psychological Levels v2
This indicator is designed specifically for Gold (XAUUSD) traders who want clean, institutional-grade key levels without chart clutter.
It combines market structure levels with true psychological price levels used by institutions, making it ideal for scalping, intraday, and swing trading.
📌 Features
🔹 Market Structure Key Levels
Automatic 1H & 4H High / Low detection
Based on swing pivots (configurable strength)
Solid lines for clear structure visibility
🔹 Gold Psychological Levels (XAUUSD)
Major levels: every 500$ (strong institutional zones)
Medium levels: every 250$
Minor levels: every 10$
Dynamic levels around current price
No line spam, optimized performance
🔹 Visual Clarity
Solid / dashed / dotted line styles
Custom colors & line thickness
Optional price labels
Works perfectly on M1 → H4
🎯 Best Use Cases
Liquidity sweeps & reactions
Premium / discount zones
Stop-loss & take-profit placement
Confluence with BOS / CHoCH
London & New York sessions
⚙️ Fully Customizable
Toggle 1H / 4H levels
Adjust psychological level spacing
Enable / disable labels
Clean & lightweight (no lag)
⚠️ Notes
Optimized for XAUUSD (Gold)
Best results when combined with price action & structure
Not a trading signal indicator
If you want:
Session-based levels
Alerts on key levels
Smart Money Concepts integration
Feel free to comment or DM 👊
Happy trading 💛📈
Open-source script
In true TradingView spirit, the creator of this script has made it open-source, so that traders can review and verify its functionality. Kudos to the author! While you can use it for free, remember that republishing the code is subject to our House Rules.
hichamfata
Disclaimer
The information and publications are not meant to be, and do not constitute, financial, investment, trading, or other types of advice or recommendations supplied or endorsed by TradingView. Read more in the Terms of Use.

50-Point Psych Levels (Multiples of 50)50-Point Psychological Levels (Multiples of 50)
This indicator plots static psychological price levels at fixed point intervals (default every 50 points) across the chart. These levels are commonly watched by traders as natural areas of reaction, balance, support, and resistance, especially on index futures such as NQ, ES, YM, and RTY.
The script automatically centers the levels around the current market price and draws them across a configurable range above and below price. All levels extend across the entire chart and are drawn once only, keeping the display clean and preventing redraw lag.
Key Features
Plots horizontal levels at fixed point spacing (default: 50 points)
Automatically anchors around the latest price
Configurable range above and below price
Customizable line color, width, and style
Lightweight, non-repainting, static reference levels
Best Use Cases
Identifying psychological support and resistance
Confluence with VWAP, EMA structure, ORB levels, and volume
Futures trading (NQ, ES, YM, RTY), indexes, and large-tick instruments

TASC 2026.01 The Reversion Index█ OVERVIEW
This script implements the Reversion Index as presented by John F. Ehlers in the January 2026 edition of the TASC Traders' Tips , "Identifying Peaks And Valleys In Ranging Markets”. This indicator was created to provide timely buy and sell signals for mean reversion strategies.
█ CONCEPTS
Ehlers came up with the idea for the Reversion Index following the development of the "Continuation Index" (featured in the September 2025 edition). While the Continuation Index provides indications for trend onset, continuation, and exhaustion; the Reversion Index serves as its counterpart for mean-reversion trading.
The raw Reversion Index value is calculated as the net change in price normalized to the sum of the absolute value of change in price over the same period; for clarity, it is then smoothed using Ehlers' SuperSmoother.
The Smooth Reversion Index value is led by a "Trigger" line, which is created by smoothing the raw data to half the smoothing period of the smoothed index.
Note: Ehlers suggests the smoothing lengths be left at 8 and 4 (Reversion Index & Trigger). For this reason these lengths are hard-coded in the script but can be easily modified in the code.
█ USAGE
In order to identify peaks and valleys effectively, the "Length" should ideally be set to half of that of the expected cycle of the data. If the expected cycle of your trading data is 20 bars, a 10 bar length should be set.
Note: The Reversion Index is intended to identify peaks and valleys within a cycle, not over a large sample period. Ehlers suggests that this would create an estimation of trend, which is not the goal here.
Once the length is set, peaks and valleys are interpreted as the cross of the "Trigger" and "Smooth" lines.

Highlighted Range (3 Sessions)3 session customizable range. All one color customizable for simplicity.

BTC - VDD Multiple (Approx)Overview & Philosophy
⚠️ Note: This indicator is optimized for the Daily (1D) Timeframe. Please switch your chart to 1D for accurate signal reading.
The BTC – VDD Multiple (Approx) is an advanced oscillator designed to identify market overheating and cycle tops by analyzing the velocity of value moving through the market.
In traditional On-Chain Analysis, Value Days Destroyed (VDD) is a premier metric for spotting macro tops. It multiplies the coin age (how long a coin was held) by the price at which it was moved. When old coins (HODLer money) move at high prices, VDD spikes, signaling massive profit-taking.
The Problem: Real "Coin Days Destroyed" (CDD) data is typically locked behind institutional paywalls or unavailable on standard TradingView plans.
The Solution: This script calculates a Deterministic Proxy. By analyzing the relationship between Exchange Volume, Price, and a Dormancy Constant, we can approximate the structure of the VDD Multiple without needing a premium data feed.
Methodology
The VDD Multiple works by comparing short-term market velocity against a long-term baseline.
1. The Proxy Calculation
Since we cannot directly access the age of coins on TradingView, we model the economic weight of the move:
Proxy Value = Exchange Volume * Price * Dormancy Factor
This creates a synthetic representation of "Value Throughput."
2. The Multiple
We compare the immediate heat of the market against the yearly trend:
• Short-Term MA (2 Days): Captures flash spikes and sudden liquidity exit events.
• Long-Term MA (365 Days): Represents the baseline "hum" of network activity.
VDD Multiple = Short Term MA / Long Term MA
How to Read the Chart
The indicator plots the Multiple as a line and uses background highlighting to signal extreme regimes.
🔴 The Red Zone (Overheated > 2.9)
Meaning: Current value transfer is ~3x higher than the yearly average.
Interpretation: Historically, sharp spikes into the Red Zone correlate with Local or Cycle Tops. This indicates that massive volume is changing hands at high prices—typically a sign of "Smart Money" distributing into "Dumb Money" FOMO.
Note: In strong bull runs, price can push higher even after a VDD spike, but the risk/reward ratio is extremely poor here.
🟢 The Green Zone (Undervalued < 0.75)
Meaning: Market activity is quiet and below the yearly baseline.
Interpretation: These are periods of apathy or accumulation. Historically, extended time spent in the Green Zone (the "flatline") has offered the best asymmetric buying opportunities.
🟠 The Orange Line (Neutral)
Meaning: The market is in transition or equilibrium.
Strategy & Context
This indicator is best used as a Macro Cycle Tool, not a day-trading signal.
• Exit Strategy: Look for "Clusters" of Red Spikes. A single spike often marks a local correction, but a cluster of intense spikes while price makes new highs (Divergence) is a strong Cycle Top warning.
• Entry Strategy: Historically the best entries occur when the indicator flattens out in the Green Zone for weeks or months. This suggests sellers are exhausted and the market has reached a floor.
Credits
This script is an approximation of the original VDD Multiple concept. Full credit for the underlying on-chain theory goes to the pioneers of this metric:
• Concept: The original Value Days Destroyed metric was popularized by Hans Hauge and Glassnode.
• The Multiple: The specific application of a Short/Long MA Multiple on VDD is widely attributed to analysts like TXMC and Bitbo.
This script adapts these concepts for the free TradingView environment using exchange volume proxies.
Settings
• Data Source: Defaults to BINANCE:BTCUSDT to capture high-volume liquidity.
• Short MA: Default is 2 Days to capture rapid velocity spikes.
• Long MA: Default is 365 Days to track the annual trend.
Disclaimer
This tool is an approximation based on exchange volume, not raw blockchain data. While exchange volume and on-chain volume are highly correlated during cycle extremes, they are not identical. This script is for educational and research purposes only. Past performance does not guarantee future results.
Tags
bitcoin, btc, onchain, vdd, cdd, valuation, cycle, top, bottom, Rob Maths

Dipy the MFT Super OscillatorDipy the MFT Super Oscillator
A multi-timeframe bandpass oscillator for mean-reversion and "buy the dip" strategies.
🎯 What It Does
Isolates market cycles within a specific frequency range to identify overbought/oversold conditions and reversal points.
⏱️ Multi-Timeframe
Set Signal Timeframe to calculate signals on higher TF while viewing lower TF chart. Example: 5min chart + 1H signals = noise reduction with precise timing.
⚙️ Key Settings
Bandwidth/BandEdge: Define the cycle range to capture
Cloud Type: None for thresholds, others for consensus cloud
Thresholds: Overbought/oversold levels for signals
💡 Best Use
Combine with trend indicator (only buy dips in uptrend)
Higher Signal Timeframe = cleaner signals
Cloud mode = more conservative entries
🔔 Alerts
Create ONE alert for all signals.
Derived from TASC 2025.04 Ultimate Oscillator by John Ehlers.

Key Levels: Volume Profile POCProfessional Intraday Key Levels (CST)
This is a comprehensive, institutional-grade Pine Script indicator designed for intraday traders (Futures, Stocks, Options) operating in the Central Time Zone. It automatically plots the most significant support and resistance levels used by algorithms and professional desks.
1. Core Levels Monitored
Daily Levels: Previous Day High (PDH), Low (PDL), Open, Close, and the 50% Midpoint (Equilibrium).
Volume Profile POC: Unlike standard indicators that use a simple average, this calculates the Volume Weighted Average Price (VWAP) of the previous day to determine the true "Fair Value" or Point of Control. Plotted with a thicker, distinct purple line.
Weekly Magnets: Previous Week High (PWH) and Low (PWL), which often act as major targets for breakouts or reversals.
Pre-Market Data: Tracks the High and Low established between 03:00 AM – 08:30 AM CST.
Opening Range (OR): Automatically captures the High and Low of the first 60 minutes of the regular session (08:30 AM – 09:30 AM CST).
2. Smart Visualization Features
Anti-Overlap Labels: If two levels (e.g., Pre-Market High and Previous Day High) are within 0.02% of each other, the script automatically merges them into a single label (e.g., "PDH & Pre-Market High") to prevent chart clutter.
Source Tracing: Trace lines extend backward from the current price level to the exact candle where that High or Low was formed (for Pre-Market and Opening Range levels), giving you instant context on when the level was created.
Clean Readability: Labels are displayed in bold, solid text without price numbers, ensuring a clean chart that focuses on level identification rather than data overload.
3. Technical Precision
Time Zone Locked: Hardcoded to America/Chicago to ensure Pre-Market and Opening Range calculations remain accurate regardless of your local computer settings.
Non-Repainting: Daily and Weekly levels are locked using closed-candle data (lookahead_on), ensuring lines do not shift during the trading day.
Buffer Safe: Optimized drawing logic prevents historical buffer errors, even on lower timeframes (1m/5m).
4. Customization
Toggle Everything: Every single level has an individual "Show/Hide" checkbox in the settings.
Label Sizing: Adjustable text size (Tiny to Huge) and offset positioning.
Compact Mode: Option to switch between full names ("Previous Day High") and abbreviations ("PDH").

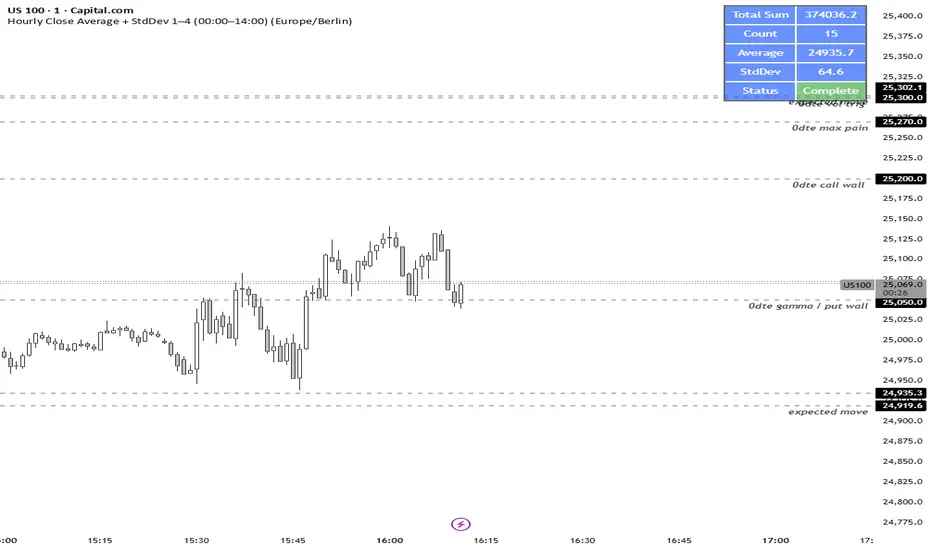
Daily & Pre-Market Key Levels (v5)Plots:
- Today's high/low
- Pre-market High/Low
- Yesterday's high/low/close
- Day before yesterday high/low

Pivot Points High LowGaneshA Pivot Points High/Low indicator that:
Detects swing highs (ta.pivothigh) and swing lows (ta.pivotlow) using configurable left/right bar lengths.
Draws labels at the confirmed pivot points:
Down labels at pivot highs (potential resistance).
Up labels at pivot lows (potential support).
Lets you customize text color and label fill color separately for highs and lows.
It’s designed for overlay (on-price chart), with max_labels_count=500 to allow many labels.

GMMA fill (v5) + Golden Crossover HighlightsGMMA Fill (v5) + Golden Crossover Highlights
This setup combines the Guppy Multiple Moving Average (GMMA) Fill version 5 with Golden Crossover signals to identify strong trend continuation and potential breakout points. GMMA provides layered moving averages for short- and long-term trend analysis, while the Golden Crossover highlights bullish momentum shifts, making it ideal for spotting entry opportunities in trending markets.

My RSI Fib Range Cloud//SOLO900q99This is basically the close price, optionally “stepped” if you set Bars Per Sample > 1.
2. Central Threshold Band (colored line)
• This is an EMA of the resampled price (default length 34).
• It turns:
• Green when RSI is in bullish fib zones,
• Pink when RSI is in bearish fib zones,
• Grey when RSI is in the middle/neutral area.
3. Sigma Range High (green line) and Sigma Range Low (pink line)
• These are an upper and lower band around price.
• The distance from price is based on how much price has been moving recently (average change).

GARCH Adaptive Volatility & Momentum Predictor
💡 I. Indicator Concept: GARCH Adaptive Volatility & Momentum Predictor
-----------------------------------------------------------------------------
The GARCH Adaptive Momentum Speed indicator provides a powerful, forward-looking
view on market risk and momentum. Unlike standard moving averages or static
volatility indicators (like ATR), GARCH forecasts the Conditional Volatility (σ_t)
for the next bar, based on the principle of volatility clustering.
The indicator consists of two essential components:
1. GARCH Volatility (Level): The primary forecast of the expected magnitude of
price movement (risk).
2. Vol. Speed (Momentum): The first derivative of the GARCH forecast, showing
whether market risk is accelerating or decelerating. This component is the
main visual signal, displayed as a dynamic histogram.
⚙️ II. Key Features and Adaptive Logic
-----------------------------------------------------------------------------
* Dynamic Coefficient Adaptation: The indicator automatically adjusts the GARCH
coefficients (α and β) based on the chart's timeframe (TF):
- Intraday TFs (M1-H4): Uses higher α and lower β for quicker reaction
to recent shocks.
- Daily/Weekly TFs (D, W): Uses lower α and higher β for a smoother,
more persistent long-term forecast.
* Momentum Visualization: The Vol. Speed component is plotted as a dynamic
histogram (fill) that automatically changes color based on the direction of
acceleration (Green for up, Red for down).
📊 III. Interpretation Guide
-----------------------------------------------------------------------------
- GARCH Volatility (Blue Line): The predicted level of market risk. Use this to
gauge overall position sizing and stop loss width.
- Vol. Speed (Green Histogram): Momentum is ACCELERATING (Risk is increasing rapidly).
A strong signal that momentum is building, often preceding a breakout.
- Vol. Speed (Red Histogram): Momentum is DECELERATING (Risk is contracting).
Indicates momentum is fading, often associated with market consolidation.
🎯 IV. Trading Application
-----------------------------------------------------------------------------
- Breakout Timing: Look for a strong, high GREEN histogram bar. This suggests
the volatility pressure is increasing rapidly, and a breakout may be imminent.
- Consolidation: Small, shrinking RED histogram bars signal that market energy
is draining, ideal for tight consolidation patterns.

Day of WeekDay of Week is an indicator that runs in a separate panel and colors the panel background according to the day of the week.
Main Features
Colors the background of the lower panel based on the day of the week
Includes all days, from Monday to Sunday
Customizable colors
Time Offset Correction
TradingView calculates the day of the week using the exchange’s timezone, which can cause visual inconsistencies on certain symbols.
To address this, the indicator includes a configurable time offset that allows the user to synchronize the calculated day with the day displayed on the chart.
By simply adjusting the Time Offset (hours) parameter, the background will align correctly with the visible chart calendar.

Multi-Trend + Credit Risk DashboardHello This is showing 20,50,200 as well as some other useful indicators. hope you like it, its my first! D and P is discount or premium to nav

Danny Gee EMA Trend RibbonDanny Gee EMA Trend Ribbon - Multi-Timeframe Trend Analysis
A sophisticated 9-EMA ribbon system designed to visualize trend strength and direction with precision. This indicator creates a dynamic color-coded ribbon that adapts to market conditions, making trend identification effortless.
Key Features:
9 Customizable EMAs - Default periods: 8, 14, 20, 26, 32, 38, 44, 50, and 60
Intelligent Ribbon Coloring - Automatically displays bullish (green), bearish (red), or neutral (gray) based on EMA consensus
Smoothing Control - Adjustable smoothing period (default 2) reduces noise and false signals
Real-Time Trend Status - Live dashboard showing current trend state and EMA agreement count (e.g., "Bullish 8/9")
Visual Clarity - Color-coded EMA lines with the 60 EMA highlighted for key support/resistance
How It Works:
The indicator analyzes the slope direction of all 9 EMAs. When 7 or more EMAs agree on direction, the ribbon displays a clear bullish or bearish color. This consensus-based approach helps filter out weak or conflicting trends, keeping you focused on high-probability setups.
Best Used For:
✓ Identifying strong trending conditions
✓ Avoiding choppy, sideways markets
✓ Confirming trade direction with other indicators
✓ Multi-timeframe analysis (works on any chart timeframe)
Customization Options:
Adjust all EMA periods to match your trading style
Customize ribbon colors for personal preference
Toggle ribbon visibility on/off
Modify smoothing sensitivity
Perfect for swing traders, scalpers, and day traders looking for a clean, reliable trend filter that works across all markets - forex, crypto, stocks, and indices.

Selected Days Indicator V3-TrDoes the stock drop every Wednesday? Do March months always move similarly? Does the 1st week of the month behave differently?
Do you ever say "it always makes this move in these months"? Don't you want to see more clearly whether it actually makes this move or not? Don't you want to see and test periodically repeating price patterns?
Hisse her Çarşamba düşüyor mu? Mart ayları hep benzer mi hareket ediyor? Ayın 1. haftası farklı mı davranıyor?
Bazen "bu aylarda hep bu hareketi yapıyor" dediğiniz oluyor mu? Gerçekten de bu hareketi yapıp yapmadığını daha net görmek istemez misiniz? Periyodik tekrarlayan fiyat kalıplarını görmek ve test etmek istemiyor musunuz?
1. Problem
Some stocks or crypto assets exhibit systematic behaviors on certain days, weeks, or months. But it's hard to see - everything is mixed together on the chart. This indicator isolates the days/weeks/months you want and shows only them. Hides everything else.
2. How It Works
Three-layer filter: Day (Monday, Tuesday...), Week (1st, 2nd, 3rd week of the month), Month (January, February...). Select what you want, let the rest disappear. Example: Show only Thursdays of March-June-September. Or compare every 1st week of the month. View as candlestick, line, or column chart.
3. What's It Good For?
Test "end-of-month effect". Find "day-of-the-week anomaly". Analyze crypto volatility by days. See seasonality in commodities. Discover patterns specific to your own strategy. Past data doesn't guarantee the future but provides statistical advantage.
