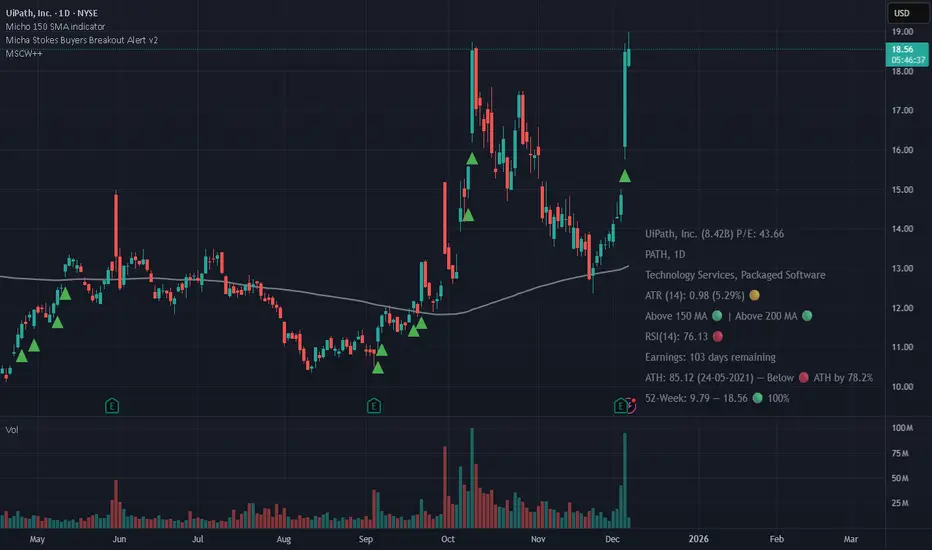
GEOtheGEMIt looks for when the fast EMA crosses above the slow one, and the trend is up. If RSI is above fifty—and volume jumps—it draws a green arrow and tells you buy. It trails the stop so you don't get shaken out. And if price drops below the two-hundred, it won't short you in a rally. That's it. Nothing fancy. Just: is it going up? Yes? Get in. No? Stay out.
Indicatori e strategie

Momentum Permission + Pivot Entry (v1.4 CLEAN ENTRY)//@version=5
indicator("Momentum Permission + Pivot Entry (v1.4 CLEAN ENTRY)", overlay=true)
// ─────────── INPUTS ───────────
pivotLookback = input.int(3, "Pivot Lookback")
smaLen = input.int(50, "SMA Length")
relVolTh = input.float(1.3, "RelVol Threshold")
// ─────────── TREND + MOMENTUM — BASICS ───────────
vwapLine = ta.vwap
smaLine = ta.sma(close, smaLen)
relVol = volume / ta.sma(volume, 10)
pivotLow = ta.lowest(low, pivotLookback) == low
trendUp = close > smaLine
aboveVWAP = close > vwapLine
greenCandle = close > open
// ─────────── PERMISSION (Context Only) ───────────
permitSignal = trendUp and (relVol > relVolTh)
// ─────────── ENTRY LOGIC — ONE CLEAN SIGNAL ───────────
rawEntry = permitSignal and aboveVWAP and pivotLow and greenCandle
// Anti-spam: only first signal in a move
entrySignal = rawEntry and not rawEntry
// ─────────── VISUAL SHAPES (Clean) ───────────
plotshape(permitSignal, style=shape.triangleup, color=color.lime, size=size.tiny, location=location.bottom, text="PERMIT")
plotshape(entrySignal, style=shape.triangleup, color=color.aqua, size=size.small, text="ENTRY")
// ─────────── TREND VISUALS ───────────
plot(vwapLine, "VWAP", color=color.blue, linewidth=2)
plot(smaLine, "SMA50", color=color.orange, linewidth=2)

One-Time 50 SMA Trend Start//@version=5
indicator("One-Time 50 SMA Trend Start", overlay=true)
// ─── Inputs ──────────────────────────────────────────────
smaLength = input.int(50, "SMA Length")
// ─── Calculations ────────────────────────────────────────
sma50 = ta.sma(close, smaLength)
crossUp = ta.crossover(close, sma50)
// Track whether we've already fired today
var bool alerted = false
// Reset alert for new session
if ta.change(time("D"))
alerted := false
// Trigger one signal only
signal = crossUp and not alerted
if signal
alerted := true
// ─── Plots ───────────────────────────────────────────────
plot(sma50, color=color.orange, linewidth=2, title="50 SMA")
plotshape(
signal,
title="First Cross Above",
style=shape.triangleup,
color=color.new(color.green, 0),
size=size.large,
location=location.belowbar,
text="Trend"
)

bcon's bemas (5,8,13,21)simple ribbin i use for scalps. the 5 8 13 and 21 ema. like to see them lined up when i see a cross thats my sign to take profit

Interest Rate ExpectationsThis indicator shows how much rate cuts or hikes are currently priced into SOFR futures. You choose two SOFR contracts and the script converts each contract price into basis points relative to the current effective fed funds rate. This gives you a very clear view of how policy expectations shift over time.
You can switch between using a fixed EFFR value or pulling the live EFFR ticker. Colours for each line and label are fully adjustable. The script also includes an optional grid for the plus or minus 25, 50 and 75 basis point levels so the chart does not zoom out too far.
Labels appear at the end of both lines and display how many basis points of cuts or hikes are priced for each contract. A small reference box is added on the chart to remind you what each quarterly code represents. For example H is March and Z is December.
The background shading highlights changes in the timing of cuts. Green shading means the market is pushing cuts further out in time. Red shading means cuts are being pulled closer. This gives a simple and visual way to track how the curve reprices near term versus long term policy expectations.
This tool is useful for anyone tracking fed path repricing, front end volatility, macro catalysts or cross asset rate sensitivity.

Custom ORB (Adjust Time, Color, + Alerts)Set Opening Range Break Out for whatever time range you choose for current day only. 15 min, 30 min etc. You can add alerts on ORB High Low and change color of Lines.

KING Super Trend Hull (Multi MA)super trende ortalamalar eklendi. alexander ma degisken ortalama gibi..

SPX EMAs - Bala//@version=5
indicator("SPX EMAs", overlay = true)
// Inputs
ema8 = ta.ema(close, 8)
ema21 = ta.ema(close, 21)
ema50 = ta.ema(close, 50)
ema200 = ta.ema(close, 200)
// Plot EMAs
plot(ema8, "EMA 8", color=color.new(color.green, 0), linewidth=2)
plot(ema21, "EMA 21", color=color.new(color.orange, 0), linewidth=2)
plot(ema50, "EMA 50", color=color.new(color.blue, 0), linewidth=2)
plot(ema200,"EMA 200",color=color.new(color.red, 0), linewidth=2)

PRO Trade Manager//@version=5
indicator("PRO Trade Manager", shorttitle="PRO Trade Manager", overlay=false)
// ============================================================================
// INPUTS
//This code and all related materials are the exclusive property of Trade Confident LLC. Any reproduction, distribution, modification, or unauthorized use of this code, in whole or in part, is strictly prohibited without the express written consent of Trade Confident LLC. Violations may result in civil and/or criminal penalties to the fullest extent of the law.
// © Trade Confident LLC. All rights reserved.
// ============================================================================
// Moving Average Settings
maLength = input.int(15, "Signal Strength", minval=1, tooltip="Length of the moving average to measure deviation from (lower = more sensitive)")
maType = "SMA" // Fixed to SMA, no longer user-selectable
// Deviation Settings
deviationLength = input.int(20, "Deviation Period", minval=1, tooltip="Lookback period for standard deviation calculation")
// Signal Frequency dropdown - controls both upper and lower thresholds
signalFrequency = input.string("More/Good Accuracy", "Signal Frequency", options= ,
tooltip="Normal/Highest Accuracy = ±2.0 StdDev | More/Good Accuracy = ±1.5 StdDev | Most/Moderate Accuracy = ±1.0 StdDev")
// Set thresholds based on selected frequency
upperThreshold = signalFrequency == "Most/Moderate Accuracy" ? 1.0 : signalFrequency == "More/Good Accuracy" ? 1.5 : 2.0
lowerThreshold = signalFrequency == "Most/Moderate Accuracy" ? -1.0 : signalFrequency == "More/Good Accuracy" ? -1.5 : -2.0
// Continuation Signal Settings
atrMultiplier = input.float(2.0, "TP/DCA Market Breakout Detection", minval=0, step=0.5, tooltip="Number of ATR moves required to trigger continuation signals (Set to 0 to disable)")
// Visual Settings
showMA = false // MA display removed from settings
showSignals = input.bool(true, "Show Alert Signals", tooltip="Show visual signals when price is overextended")
// ============================================================================
// CALCULATIONS
// ============================================================================
// Calculate Moving Average based on type
ma = switch maType
"SMA" => ta.sma(close, maLength)
"EMA" => ta.ema(close, maLength)
"WMA" => ta.wma(close, maLength)
"VWMA" => ta.vwma(close, maLength)
=> ta.sma(close, maLength)
// Calculate deviation from MA
deviation = close - ma
// Calculate standard deviation
stdDev = ta.stdev(close, deviationLength)
// Calculate number of standard deviations away from MA
deviationScore = stdDev != 0 ? deviation / stdDev : 0
// Smooth the deviation score slightly for cleaner signals
smoothedDeviation = ta.ema(deviationScore, 3)
// ============================================================================
// SIGNALS
// ============================================================================
// Overextended conditions
overextendedHigh = smoothedDeviation >= upperThreshold
overextendedLow = smoothedDeviation <= lowerThreshold
// Signal triggers (crossing into overextended territory)
bullishSignal = ta.crossunder(smoothedDeviation, lowerThreshold)
bearishSignal = ta.crossover(smoothedDeviation, upperThreshold)
// Track if we're in bright histogram zones
isBrightGreen = smoothedDeviation <= lowerThreshold
isBrightRed = smoothedDeviation >= upperThreshold
// Track if we were in bright zone on previous bar
wasBrightGreen = smoothedDeviation <= lowerThreshold
wasBrightRed = smoothedDeviation >= upperThreshold
// Detect oscillator turning up after bright green (buy signal)
// Trigger if we were in bright green and oscillator turns up, even if no longer bright green
oscillatorTurningUp = smoothedDeviation > smoothedDeviation
buySignal = barstate.isconfirmed and wasBrightGreen and oscillatorTurningUp and smoothedDeviation <= smoothedDeviation
// Detect oscillator turning down after bright red (sell signal)
// Trigger if we were in bright red and oscillator turns down, even if no longer bright red
oscillatorTurningDown = smoothedDeviation < smoothedDeviation
sellSignal = barstate.isconfirmed and wasBrightRed and oscillatorTurningDown and smoothedDeviation >= smoothedDeviation
// ============================================================================
// ATR-BASED CONTINUATION SIGNALS
// ============================================================================
// Calculate ATR for distance measurement
atrLength = 14
atr = ta.atr(atrLength)
// Track price levels when ANY sell or buy signal occurs (original or continuation)
var float lastSellPrice = na
var float lastBuyPrice = na
// Initialize tracking on original signals
if sellSignal
lastSellPrice := close
if buySignal
lastBuyPrice := close
// Continuation Sell Signal: Price moved up by ATR multiplier from last red dot
// Disabled when atrMultiplier is set to 0
continuationSell = atrMultiplier > 0 and barstate.isconfirmed and not na(lastSellPrice) and close >= lastSellPrice + (atrMultiplier * atr)
// Continuation Buy Signal: Price moved down by ATR multiplier from last green dot
// Disabled when atrMultiplier is set to 0
continuationBuy = atrMultiplier > 0 and barstate.isconfirmed and not na(lastBuyPrice) and close <= lastBuyPrice - (atrMultiplier * atr)
// Update reference prices when continuation signals trigger (reset the 3 ATR counter)
if continuationSell
lastSellPrice := close
if continuationBuy
lastBuyPrice := close
// Combine original and continuation signals for plotting
allBuySignals = buySignal or continuationBuy
allSellSignals = sellSignal or continuationSell
// Track if a signal occurred to keep it visible on dashboard
// Signals trigger at barstate.isconfirmed (bar close)
var bool showBuyOnDashboard = false
var bool showSellOnDashboard = false
// Update dashboard flags immediately when signals occur
if allBuySignals
showBuyOnDashboard := true
showSellOnDashboard := false
else if allSellSignals
showSellOnDashboard := true
showBuyOnDashboard := false
else if barstate.isconfirmed
// Reset flags on bar close if no new signal
showBuyOnDashboard := false
showSellOnDashboard := false
// ============================================================================
// PLOTTING
// ============================================================================
// Professional color scheme
var color colorBullish = #00C853 // Professional green
var color colorBearish = #FF1744 // Professional red
var color colorNeutral = #2962FF // Professional blue
var color colorGrid = #363A45 // Dark gray for lines
var color colorBackground = #1E222D // Chart background
// Dynamic line color based on value
lineColor = smoothedDeviation > upperThreshold ? colorBearish :
smoothedDeviation < lowerThreshold ? colorBullish :
smoothedDeviation > 0 ? color.new(colorBearish, 50) :
color.new(colorBullish, 50)
// Plot the deviation oscillator with dynamic coloring
plot(smoothedDeviation, "Deviation Score", color=lineColor, linewidth=2)
// Plot zero line
hline(0, "Zero Line", color=color.new(colorGrid, 0), linestyle=hline.style_solid, linewidth=1)
// Subtle fill for overextended zones (without visible threshold lines)
upperLine = hline(upperThreshold, "Upper Threshold", color=color.new(color.gray, 100), linestyle=hline.style_dashed, linewidth=1)
lowerLine = hline(lowerThreshold, "Lower Threshold", color=color.new(color.gray, 100), linestyle=hline.style_dashed, linewidth=1)
fill(upperLine, hline(3), color=color.new(colorBearish, 95), title="Overextended High Zone")
fill(lowerLine, hline(-3), color=color.new(colorBullish, 95), title="Overextended Low Zone")
// Histogram style visualization (optional alternative)
histogramColor = smoothedDeviation >= upperThreshold ? color.new(colorBearish, 20) :
smoothedDeviation <= lowerThreshold ? color.new(colorBullish, 20) :
smoothedDeviation > 0 ? color.new(colorBearish, 80) :
color.new(colorBullish, 80)
plot(smoothedDeviation, "Histogram", color=histogramColor, style=plot.style_histogram, linewidth=3)
// ============================================================================
// BUY/SELL SIGNAL MARKERS
// ============================================================================
// Plot buy signals at -3.5 level (includes both initial and extended signals)
plot(allBuySignals ? -3.5 : na, title="Buy Signal", style=plot.style_circles,
color=color.new(colorBullish, 0), linewidth=4)
// Plot sell signals at 3.5 level (includes both initial and extended signals)
plot(allSellSignals ? 3.5 : na, title="Sell Signal", style=plot.style_circles,
color=color.new(colorBearish, 0), linewidth=4)
// ============================================================================
// ALERTS - SIMPLIFIED TO ONLY TWO ALERTS
// ============================================================================
// Alert 1: Long Entry/Short TP - fires on ANY green dot (original or continuation)
alertcondition(allBuySignals, "Long Entry/Short TP", "Long Entry/Short TP")
// Alert 2: Long TP/Short Entry - fires on ANY red dot (original or continuation)
alertcondition(allSellSignals, "Long TP/Short Entry", "Long TP/Short Entry")
// ============================================================================
// DATA DISPLAY
// ============================================================================
// Create a professional table for current readings
var color tableBgColor = #1a2332 // Dark blue background
var table infoTable = table.new(position.middle_right, 2, 2, border_width=1,
border_color=color.new(#2962FF, 30),
frame_width=1,
frame_color=color.new(#2962FF, 30))
if barstate.islast
// Determine status
statusText = overextendedHigh ? "OVEREXTENDED ↓" :
overextendedLow ? "OVEREXTENDED ↑" :
smoothedDeviation > 0 ? "Buyers In Control" : "Sellers In Control"
statusColor = overextendedHigh ? color.new(colorBearish, 0) :
overextendedLow ? color.new(colorBullish, 0) :
color.white
// Background color for status cell
statusBgColor = color.new(tableBgColor, 0)
// Status Row
table.cell(infoTable, 0, 0, "Status",
bgcolor=color.new(tableBgColor, 0),
text_color=color.white,
text_size=size.normal)
table.cell(infoTable, 1, 0, statusText,
bgcolor=statusBgColor,
text_color=statusColor,
text_size=size.normal)
// Signal Row - always show
table.cell(infoTable, 0, 1, "Signal",
bgcolor=color.new(tableBgColor, 0),
text_color=color.white,
text_size=size.normal)
// Show signal if flags are set (will stay visible during the bar)
if showBuyOnDashboard or showSellOnDashboard
// Green dot (buy signal) = "Long Entry/Short TP" with arrow up, white text on green background
// Red dot (sell signal) = "Long TP/Short Entry" with arrow down, white text on red background
signalText = showBuyOnDashboard ? "↑ Long Entry/Short TP" : "↓ Long TP/Short Entry"
signalColor = showBuyOnDashboard ? color.new(colorBullish, 0) : color.new(colorBearish, 0)
table.cell(infoTable, 1, 1, signalText,
bgcolor=signalColor,
text_color=color.white,
text_size=size.normal)
else
table.cell(infoTable, 1, 1, "Watching...",
bgcolor=color.new(tableBgColor, 0),
text_color=color.new(color.white, 60),
text_size=size.normal)

Interactive Compound Interest ProjectorThis indicator is an interactive tool designed for long-term investors and analysts who want to compare an asset's performance against a theoretical compound interest growth curve.
Unlike static tools, this script utilizes the Interactive Anchor feature. This allows you to click on any specific point on the chart (e.g., a market bottom, a specific entry date, or a previous all-time high) to serve as the starting point ("Principal") for the projection.
How to use
Add the indicator to your chart.
Important: Because confirm=true is enabled, the script will wait for you to click on the chart. Click on the specific candle you want to use as the "Start Date".
The Yellow Line will appear starting from that candle.
Open the indicator settings to adjust:
Annual Interest Rate: (Default 6.0%).
Project until Year: (Default 2050).
Use this to visualize if an asset is "beating" a standard benchmark (like a 10% S&P500 average or a 4% risk-free rate) from a specific moment in time.
Disclaimer: This tool is for educational and comparative analysis purposes only and does not guarantee future results.

Relative Strength Index w/ BandsStandard RSI but with the option to add a shaded zone around the Upper and Lower Bands, based on an offset value.
Value/level of shaded zones need to be modified separately in the Settings from the Upper and Lower Band values.

Ichimoku Traffic Lights Go--no go flags for Ichimoku Cloud. For quick scanning thru your watchlist, and good for scanning through timeframes.

CANDLE_TIME_RDThis tool displays the time of each candle directly on the chart by placing a label below
the bar with an upward-pointing arrow for clear visual alignment. It helps traders quickly
identify the exact timestamp of any candle during fast intraday analysis or historical review.
OVERVIEW
The script extracts the hour and minute of each bar, formats the timestamp according to the
user’s preference, and prints it beneath the candle. This removes the need to rely on the
data window or crosshair for time inspection. It is ideal for ITI evaluation, timestamp
journaling, and precise replay study.
FEATURES
- Prints the time under each candle or every N-th candle using a simple step input.
- Supports both AM/PM and military time through a toggle input.
- Builds all hour and minute text manually to ensure consistent formatting.
- Uses label.style_label_up to draw an arrow pointing toward the candle.
- Positions labels with yloc.belowbar so they do not overlap price bars.
USE CASES
- Reviewing setups with ChatGPT where exact candle timing matters.
- Studying EMA touches, VWAP interactions, or momentum shifts that occur at specific times.
- Journaling entries and exits with precise timestamps.
- Quickly identifying candle times without zooming or opening data windows.
This script is designed for clarity and convenience, improving workflow for structured
intraday traders and replay analysts.

TWAP High LowTWAP that anchors from the daily high and low, day starting at the settlement period, 14:59:30CT

Weeknights Guppy Trend Strength OscillatorBuilt a Guppy Oscillator which takes 22 different EMA's and uses an ATR to provide slope normalisation. The goal is to help the user determine strength of trend and see if momentum is slowing
On its own I doubt it will provide a full trading system but I believe it can help provide confluence to ones trading decisions
Left it open source

TWAP OscillatorIts an oscillator for the daily TWAP, anchored from 14:59:30CT which is the settlement time for the SP500 and Emini500. There are 5 deviations ranges for the oscillator matching the 5 deviations from the other Daily TWAP script. The RSI colors the line, I stole the RSI coloring from ChartPrime, thanks.

Range Lattice## RangeLattice
RangeLattice constructs a higher-timeframe scaffolding on any intraday chart, locking in structural highs/lows, mid/quarter grids, VWAP confluence, and live acceptance/break analytics. It provides a non-repainting overlay that turns range management into a disciplined process.
HOW IT WORKS
Structure Harvesting – Using request.security() , the script samples highs/lows from a user-selected timeframe (default 240 minutes) over a configurable lookback to establish the dominant range.
Grid Construction – Midpoint and quarter levels are derived mathematically, mirroring how institutional traders map distribution/accumulation zones.
Acceptance Detection – Consecutive closes inside the range flip an acceptance flag and darken the cloud, signaling balanced auction conditions.
Break Confirmation – Multi-bar closes outside the structure raise break labels and alerts, filtering the countless fake-outs that plague breakout traders.
VWAP Fan Overlay – Session VWAP plus ATR-based bands provide a live measure of flow centering relative to the lattice.
HOW TO USE IT
Range Plays : Fade taps of the outer rails only when acceptance is active and VWAP sits inside the grid—this is where mean-reversion works best.
Breakout Plays : Wait for confirmed break labels before entering expansion trades; the dashboard's Width/ATR metric tells you if the expansion has enough fuel.
Market Prep : Carry the same lattice from pre-market into regular trading hours by keeping the structure timeframe fixed; alerts keep you notified even when managing multiple tickers.
VISUAL FEATURES
Range Tap and Mid Pivot markers provide a tape-reading breadcrumb trail for journaling.
Cloud fill opacity tightens when acceptance persists, visually signaling balance compressions ready to break.
Dashboard displays absolute width, ATR-normalized width, and current state (Balanced vs Transitional) so you can glance across charts quickly.
Acceptance Flag toggle: Keep the repeated acceptance squares hidden until you need to audit balance.
PARAMETERS
Structure Timeframe (default: 240): Choose the timeframe whose ranges matter most (4H for indices, Daily for stocks).
Structure Lookback (default: 60): Bars sampled on the structure timeframe.
Acceptance Bars (default: 8): How many consecutive bars inside the range confirm balance.
Break Confirmation Bars (default: 3): Bars required outside the range to validate a breakout.
ATR Reference (default: 14): ATR period for width normalization.
Show Midpoint Grid (default: enabled): Display the midpoint and quarter levels.
Show Adaptive VWAP Fan (default: enabled): Toggle the VWAP channel for assets where volume distribution matters most.
Show Acceptance Flags (default: disabled): Turn the acceptance markers on/off for maximum visual control.
Show Range Dashboard (default: enabled): Disable if screen space is limited, re-enable during prep sessions.
ALERTS
The indicator includes five alert conditions:
Range High Tap: Price interacted with the RangeLattice high
Range Low Tap: Price interacted with the RangeLattice low
Range Mid Tap: Price interacted with the RangeLattice mid
Range Break Up: Confirmed upside breakout
Range Break Down: Confirmed downside breakout
Where it works best
This indicator works best on liquid instruments with clear structural levels. On very low timeframes (1-minute and below), the structure may update too frequently to be useful. The acceptance/break confirmation system requires patience—faster traders may find the multi-bar confirmation too slow for scalping. The VWAP fan is session-based and resets daily, which may not suit all trading styles.


First Green/Red Day of Week (Break Prior Day) + Linesfirst red day high first green day low looking for false breakouts on lower time frames

The Floyd Sniper indicator1. tren; uses 200 EMA to decide bullish or bearish zone.
2. momentum; uses the 21EMA to confirm direction..
3. RSI filter; long only when oversold, Short only went overbought.
4. Signals; Prince long only when trend + momentum + RSI all Agree.
5. Background tent; green for long setups. red for short setups.
