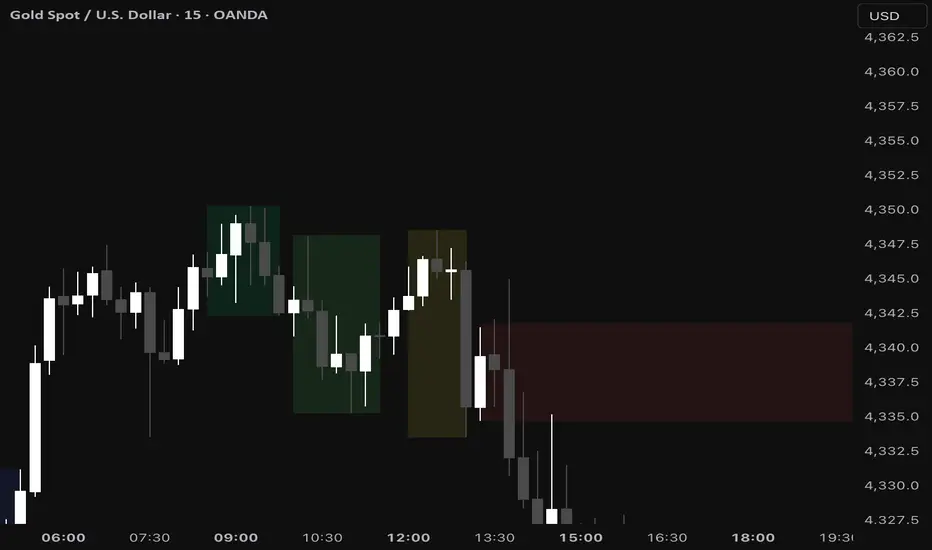
Market Potential EstimatorWhat this indicator shows
This indicator measures how much potential movement the market still has, not direction.
It answers the question:
“Does the market still have room to move, or is it already exhausted?”
Red zone (Low potential)
Exhaustion / slowdown zone.
The market has used most of its available range.
Expect:
consolidation
pullbacks
reduced follow-through
⚠️ Red does NOT mean reversal
How to use it correctly
Use it as a filter, not a trigger
Avoid opening new trades in red zones
Reduce targets when potential is low
Combine with:
direction/bias
momentum
structure
Indicatori e strategie

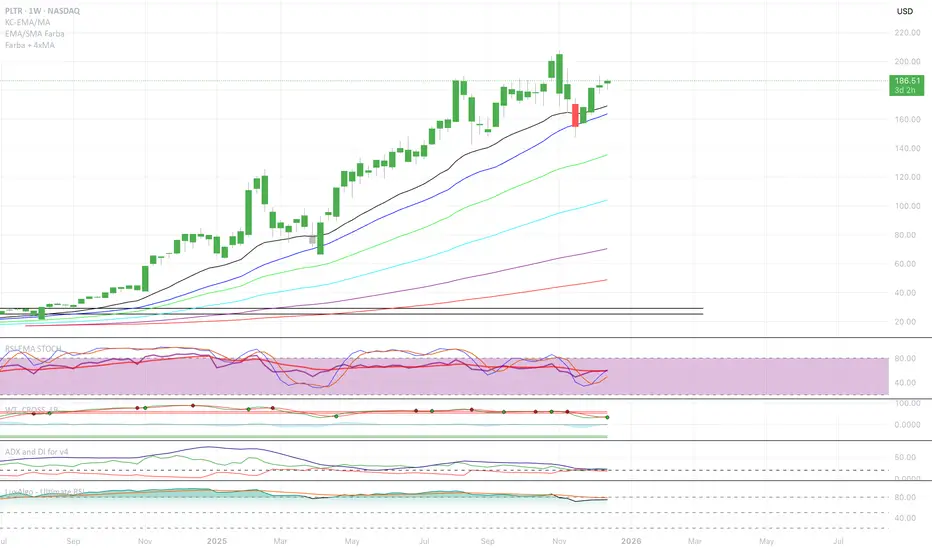
EMA/SMA Full color signal candles💡 What It Does:
The indicator calculates and plots the 21-period Exponential Moving Average (EMA) and the 30-period Simple Moving Average (SMA). It then analyzes the closing price of each candle and colors the entire candlestick (body and border) according to pre-defined trend conditions.
This visualization allows traders to identify strong trend environments versus periods of consolidation or indecision at a glance, removing the need to constantly check the price relationship manually.
🎨 Color Conditions and Meaning:
The indicator uses three distinct color states to signal the market's current momentum:
Color,Condition,Market Interpretation
🟢 GREEN,Closing Price is ABOVE both the 21 EMA AND the 30 SMA.,Strong Bullish Trend: Suggests high momentum and confirmation of an uptrend. Ideal for long bias.
🔴 RED,Closing Price is BELOW both the 21 EMA AND the 30 SMA.,Strong Bearish Trend: Suggests high downward pressure and confirmation of a downtrend. Ideal for short bias.
⚫ GRAY,"Closing Price is in any other state (e.g., between the two MAs, or under one and over the other).","Neutral / Consolidation: Indicates uncertainty, low momentum, or potential trend exhaustion/reversal. Caution is advised."
🔧 Customization Options:The indicator is fully customizable, allowing users to fine-tune the periods to match their preferred trading style (e.g., scalping, swing trading).Dĺžka EMA (Length EMA): Allows you to change the period for the Exponential Moving Average (default is 21).Dĺžka SMA (Length SMA): Allows you to change the period for the Simple Moving Average (default is 30).
I added also Extra 4 EMA lines to have extra edge.
Customizable Macro If you’re strategy relies on time then this indicator allows you to customize specific time windows to show so you no longer have to manually keep track of the time.
Power Law of Diminishing Returns for BTC:USDTThis is a script to see if the Law of Diminshining Returns is applicable to BTC/USD

EURUSD | Yield Curve Flip Strategy (2s10s State Flips)Strategy Core (Concept)
The strategy trades EURUSD exclusively when the US yield curve regime (2Y/10Y) flips into a new, clearly bullish or bearish regime. The core assumption is that re-pricing in the US yield curve (rather than individual data points) is a robust driver of USD strength or weakness and can act as a structural trigger for trend changes.
⸻
Data Basis
• Uses US 2Y Yield (TVC:US02Y) and US 10Y Yield (TVC:US10Y).
• The 2s10s curve is calculated as:
curveUS = US10Y – US2Y
• Regime assessment is based on the N-day change (default: 5 days), calculated on true rates bars (not intraday noise).
⸻
Regime Detection (Correct Bond Logic)
First, the strategy checks whether the curve has significantly steepened or flattened over the lookback period:
• Steepener if Δ(2s10s) > thrCurve (default: +0.10 percentage points = 10 bp)
• Flattener if Δ(2s10s) < −thrCurve
Next, a leg confirmation determines the specific type of steepener/flattener (default thrLeg = 5 bp):
Bull Steepener
• Curve steepens because yields fall, with the 2Y falling more (risk-off / rate-cut pricing)
Bear Steepener
• Curve steepens because yields rise, with the 10Y rising more (reflation / term-premium move)
Bull Flattener
• Curve flattens because yields fall, with the 10Y falling more (growth shock / long-end rally)
Bear Flattener
• Curve flattens because yields rise, with the 2Y rising more (hawkish repricing / front-end up)
Important: By default, a Bear Steepener is not treated as a bearish signal, unless allowBearSteepForShort is enabled.
⸻
State Machine (Memory + Flip Triggers)
The strategy maintains a persistent state variable curveState:
• +1 = bullish
• −1 = bearish
• 0 = neutral
The state is updated only on a new rates bar (daily rates when tfRates = "D"), avoiding intraday noise.
A trade is generated only on a true regime flip:
• flipToBull: new state turns bullish and the previous state was bearish (or neutral, if allowed)
• flipToBear: new state turns bearish and the previous state was bullish (or neutral, if allowed)
The option enterFromNeutral controls whether the first clear regime emerging from neutral is traded.
The option onlyOnNewRatesBar ensures signals occur only when a new rates bar is printed, providing clean timing.
⸻
Trading Rules (Entry / Exit)
There are no stops, targets, or trailing mechanisms. The strategy is a pure regime-switching / reversal system:
• On flipToBull
• Close short (“S”)
• Open long (“L”)
• On flipToBear
• Close long (“L”)
• Open short (“S”)
Positions are therefore held until the next regime flip.
⸻
Parameter Interpretation
• N: Smoothing / inertia. Smaller = faster but noisier; larger = more stable but later.
• thrCurve: Minimum curve move required to define a regime.
• thrLeg: Minimum move of the confirming leg (2Y or 10Y) to reduce misclassification.
• allowBearSteepForShort: Makes the system more aggressive (more bearish signals), but represents a different macro case.
• enterFromNeutral: Increases trade frequency by trading the first regime impulse.
⸻
What You See on the Chart
• Background shading:
• Green for bullish state
• Red for bearish state
• The curve and Δ-curve are plotted but hidden (display=none), mainly for debugging and analysis.


WMD Weekly OR (IST) Sidweekly OR (First hour) and mid point for various instruments based on indian standard time.

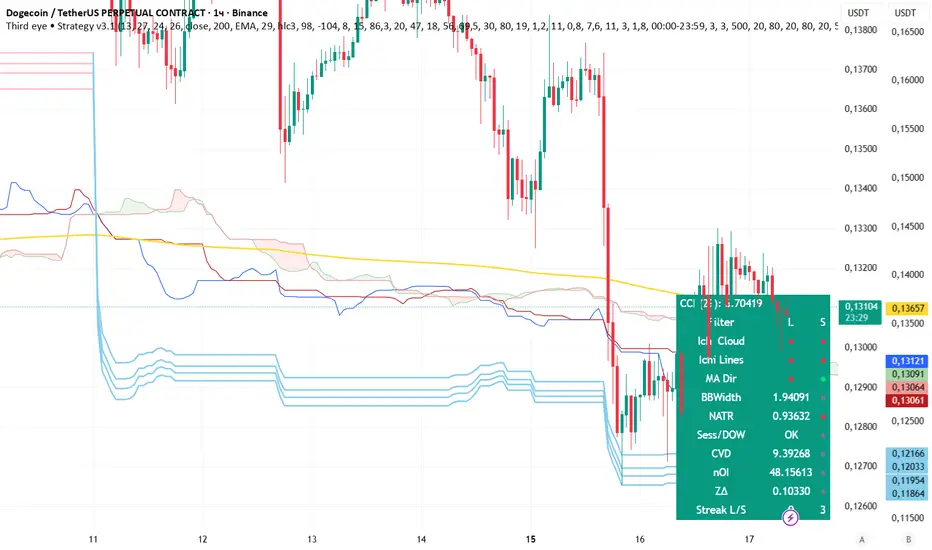
Third eye Strategy v3.1 DogeThird eye • Strategy v3.1 Doge Third eye • Strategy v3.1 Doge Third eye • Strategy v3.1 Doge
EMA SMA Rhythmic Lite Public V1.1 by SRTEMA SMA Rhythmic Lite Public V1.1 by SRT
A clean, lightweight trend-rhythm engine designed for traders of all levels. Built on a robust combination of EMAs and SMAs, this indicator provides clear directional bias signals while remaining fully non-repainting.
Key Features:
Multi-Timeframe Friendly: Works seamlessly on M1 to Daily (D) charts. MA stacking and signal logic automatically adapt to any timeframe.
Bias Detection: Determines bullish, bearish, or neutral market conditions using a 4-MA stack.
Engulfing Bar (EB) & Long-Tail Body (LTB) Detection: Highlights strong price action setups, filtered by body size and ATR-based thresholds.
Flush Markers: Visual cues showing where price aligns with MA stack for trend confirmation.
Bias Table: Displays current MA bias and presence of LTB on the chart for at-a-glance clarity.
Advanced Alerts:
Flush Alerts: Trigger when MA stack aligns with price, signaling trend continuation.
Combo Alerts: Trigger when EB or LTB appears in alignment with MA bias.
LTB-only Alerts: For monitoring significant price action reversals.
Customizable Visualization: Colors, widths, and visibility of all MAs, labels, and flush dots can be tailored to your preference.
Why Lite?
This is the most lightweight version in the SRT rhythm series, optimized for any timeframe, from scalping to swing trading. Perfect for traders who want a clear bias engine without unnecessary complexity.
If you like this EMA SMA Rhythmic Lite, you may also explore:
▶ H1 Bias Rhythmic Lite Public (Free)
▶ SRT Premium Series
Invite-only advanced indicators with stronger bias enforcement and execution frameworks.

Jin#10 HMA/OBV Pro Trader System (15m)HMA/OBV Pro Trader System Overview (15m Timeframe)
This system is designed to identify high-probability entry and exit points on the 15-minute chart by integrating multiple indicators for confirmation.
1. Trend and Confirmation
HMA Lines (Solid Lines): These are two Hull Moving Averages (HMA 8 and HMA 15).
Green/Red HMA 8 (Line 1): The faster HMA, showing short-term momentum.
Blue/Red HMA 15 (Line 3): The slower HMA, indicating the medium-term trend direction.
Trend Alignment: A strong trend requires the fast HMA (8) to be above the slow HMA (15) and both to be sloping favorably.
MTF Background Color (Candle Background): This represents the 30-minute trend filter.
Light Green/Teal: The 30-minute trend is upward and strong.
Light Orange/Red: The 30-minute trend is downward and strong.
This acts as a major confirmation filter for entries.
2. Trading Signals (Shapes)
🚀 BUY / 🔻 SELL: These are the Final Confirmation Signals. They appear when all conditions (HMA alignment, Stochastic, MACD, and the 30m MTF filter) are met.
⚠️ Pre-BUY / Pre-SELL: These are Warning/Early Signals indicating that most conditions on the 15m chart are aligned, but the 30m filter has not yet confirmed the trend direction.
🔥 Volatility Spike / 🧊 Volatility Crash (Small Circle): Alerts the user to an unusually large candle (ATR spike), signaling extreme volatility or a potential reversal.
3. Exit and Risk Management
ATR Trailing Stop (Dashed Line): This dynamic line serves as a Soft Exit or Stop-Loss Guide.
❌ Exit Long / Exit Short (X-Cross): This shape appears when the price crosses the ATR Trailing Stop, suggesting the existing position (Long or Short) should be closed immediately.
Dashed TP/SL Lines (Green/Red): These lines mark a calculated Take Profit (TP) and Stop Loss (SL) based on the entry price and the defined Risk-Reward Ratio (e.g., 1:1.5).

Sell-to-Buy Pressure RatioSell/Buy Pressure Ratio
What It Measures
The Sell/Buy Pressure Ratio quantifies the aggressiveness of sellers versus buyers by comparing conviction-weighted volume on down candles versus up candles. It answers a simple question: who is more committed right now—buyers or sellers?
How It Works
The indicator examines each candle and determines directional conviction based on where price closes within the bar's range. A candle that closes near its high shows strong buyer conviction. A candle that closes near its low shows strong seller conviction. This conviction percentage is then multiplied by volume to create a weighted measure of buying and selling pressure.
The ratio divides total selling pressure by total buying pressure over a lookback period. A ratio of 1.5 means sellers are 50% more aggressive than buyers. A ratio of 0.5 means buyers are twice as aggressive as sellers.
Key Features
Conviction weighting: Not all volume is equal. A strong close near the high counts more than a weak close mid-range.
Doji handling: Indecisive candles (where open and close are nearly equal) split volume 50/50 between buyers and sellers.
Volume filtering: Low-volume bars below 60% of average are excluded to focus on meaningful activity.
Normalized output: Optional -1 to +1 scale for cross-stock comparison.
Interpretation
RatioMeaning≤ 0.5Strong buyers — accumulation, continuation setups0.5 – 0.8Buyers favored — healthy environment for longs0.8 – 1.2Balanced — equilibrium, wait for direction1.2 – 1.5Sellers favored — caution warranted≥ 1.5Strong sellers — distribution, avoid new longs
Primary Use
Timing entries within confirmed trends. The ratio identifies when selling pressure has exhausted itself, signaling safer entry points. Rather than buying strength, traders wait for the ratio to transition from elevated levels back toward equilibrium—buying when selling stops being dangerous.
What It Does Not Do
This indicator does not predict direction. It measures current pressure dynamics. Pair it with trend analysis (moving averages, price structure) to determine direction, then use the pressure ratio to time entries and exits.

Approved Engulfing - Confirmed Close Triggerengulfing tak respek atau king CMS, guna cs sebelum engulfing ni sebagai area entry, bila prce kembali ke area ini, tunggu rejection baru boleh entry, andai tak ada rejection tak boleh entry
the Engulfing is not respected or fails to hold (King CMS), use the candle prior to this engulfing as your entry area. When price returns to this zone, wait for a clear rejection before entering. If there is no rejection, do not enter the trade."

SVE Compression Mirror (Companion)Why This Tool Exists
Intraday markets are driven not only by direction, but by volatility state and energy dynamics. Periods of compression, expansion, and transition often determine whether price behavior favors patience, rotation, or acceleration.
The SVE Compression Mirror (Companion) was created to make volatility compression and release conditions visible in real time, helping traders understand what type of market environment is currently present before forming directional conviction.
This indicator displays a two-state compression condition consistent with that referenced by the SVE Volatility Engine, exposed here as a standalone lower-pane context display.
________________________________________
How the Indicator Is Intended to Be Used
This indicator is designed strictly as a context layer, independent of trade direction or bias.
It highlights:
• Volatility compression versus expansion
• Transitions between compressed and released states
• Momentum behavior as energy builds or dissipates
The purpose is to support environment awareness, not to predict outcomes or generate signals.
________________________________________
What Appears on the Chart
When applied, the indicator displays:
• A lower-pane histogram representing momentum behavior
• Visual markers indicating whether volatility is compressed or released
• A clean, uncluttered presentation optimized for intraday use
The display is intentionally minimal and designed to pair with other structural or decision-support tools.
________________________________________
Intended Users
This indicator is designed for:
• Intraday traders seeking clearer volatility context
• Discretionary traders who value regime awareness
• Professionals and advanced retail traders who prioritize environment over prediction
________________________________________
Disclaimer
This indicator is provided for informational and analytical purposes only and does not constitute investment advice.

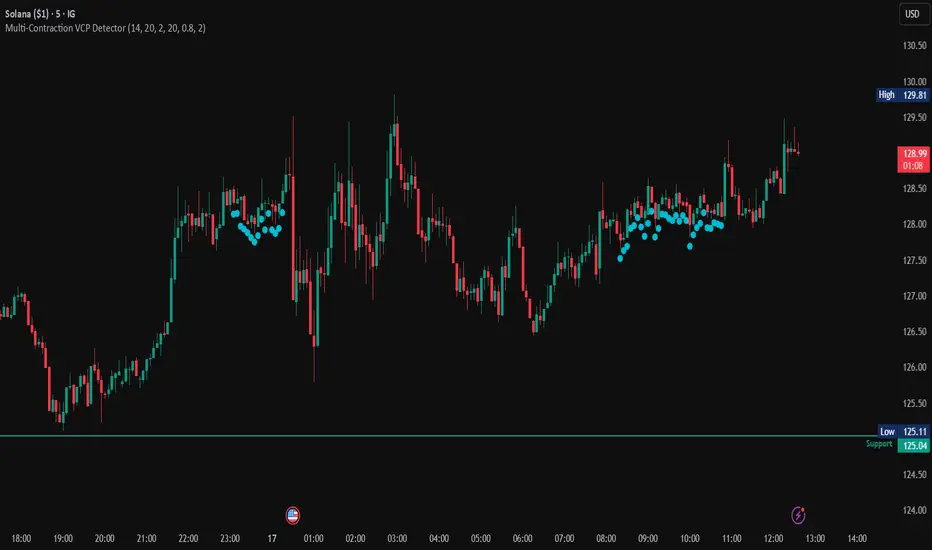
Multi-Contraction VCP DetectorThis indicator shows low volume and low price variation areas (consolidation) prior to potential breakouts. To be used in conjunction with price signals.
Work Break Area BackgroundWorkdays and off-hours are distinguished by background color for easy date differentiation during reviews.
Bar CountCount K bars based on sessions
Support at most 3 sessions
Customize the session's timezone and period
Set steps between each number
Use with the built-in Trading Session indicator is a great convenience

Multi-Contraction VCP DetectorThis indicator highlights low volume and contracted price movement prior to possible breakouts.

Dipy the MFT Super OscillatorDipy the MFT Super Oscillator
A multi-timeframe bandpass oscillator for mean-reversion and "buy the dip" strategies.
🎯 What It Does
Isolates market cycles within a specific frequency range to identify overbought/oversold conditions and reversal points.
⏱️ Multi-Timeframe
Set Signal Timeframe to calculate signals on higher TF while viewing lower TF chart. Example: 5min chart + 1H signals = noise reduction with precise timing.
⚙️ Key Settings
Bandwidth/BandEdge: Define the cycle range to capture
Cloud Type: None for thresholds, others for consensus cloud
Thresholds: Overbought/oversold levels for signals
💡 Best Use
Combine with trend indicator (only buy dips in uptrend)
Higher Signal Timeframe = cleaner signals
Cloud mode = more conservative entries
🔔 Alerts
Create ONE alert for all signals.
Derived from TASC 2025.04 Ultimate Oscillator by John Ehlers.

Market Internal Overlay - Skew and Put/Call RatioTracks both the CBOE:SKEW and INDEX:CPC and will highlight when certain thresholds are met.
Blue candle = skew is below 125 (low relative levels of hedging occurring)
Gray candle = skew is above 150 (higher relative levels of hedging occurring)
Red candle = 10 DMA of the put/call ratio is above 1.0 (signaling potential overbought territory)
Green candle = 10 DMA of the put/call ratio is below 0.80 (signaling potential oversold territory)
Purple candle = Both signals are occurring (in either direction)
To view the candle overlay, either switch the price data off, or change the colors to be darker and more transparent.

Microstructure Participation & Acceptance Indicator📊 Microstructure Participation & Acceptance Indicator
An advanced participation-based filter combining VWAP distance analysis, volume delta detection, and real-time acceptance/rejection state identification—designed for smaller timeframe trading.
📊 FEATURES
VWAP Distance Normalization
Context-aware fair value measurement:
Automatically resets based on selected anchor (Session/Week/Month)
ATR-normalized distance calculation for universal application
Identifies when price is extended or compressed relative to equilibrium
Configurable extreme distance threshold (default: 1.5 ATR)
Adjustable source input (default: HLC3)
Volume Delta Proxy
Bull vs Bear participation tracking:
Calculates volume imbalance between bullish and bearish candles
EMA smoothing for cleaner signal generation (default: 9 periods)
Delta ratio measurement to identify dominant side
Expansion/compression detection to gauge momentum commitment
Configurable expansion threshold (default: 1.3x)
Acceptance/Rejection State Machine
Real-time market regime identification with six distinct states:
🟢 Accepted Long
Price moving away from VWAP with expanding bullish delta
Distance from VWAP increasing
Volume confirming the move
Indicates real buying pressure—trade WITH the move
🟢 Accepted Short
Price moving away from VWAP with expanding bearish delta
Distance from VWAP increasing
Volume confirming the move
Indicates real selling pressure—trade WITH the move
🟠 Fade Long
Price extended beyond threshold (>1.5 ATR above VWAP)
Delta not supporting the extension
Volume participation absent or diminishing
Potential mean-reversion short setup
🟠 Fade Short
Price extended beyond threshold (>1.5 ATR below VWAP)
Delta not supporting the extension
Volume participation absent or diminishing
Potential mean-reversion long setup
⚪ Chop
Price compressed near VWAP
Bollinger Bands tight (width compressed)
Delta neutral—no clear commitment
NO TRADE ZONE—wait for expansion
⚪ Neutral
Transitional state between regimes
Momentum shifting but not yet confirmed
Monitor for next acceptance signal
Bollinger Bands
Standard volatility measurement with TradingView default styling:
Adjustable period length (default: 20)
Configurable standard deviation multiplier (default: 2.0)
Visual fill between bands for volatility context
Used internally for chop/compression detection
Live Dashboard
Real-time metrics display (top-right corner):
Current market state with color coding
VWAP distance in ATR units
Delta ratio (bull/bear volume balance)
Delta state (Expanding/Compressing)
High-contrast design for instant readability
🎯 HOW TO USE
For Trend Trading:
Accepted Long/Short backgrounds indicate confirmed participation—stay with the trend
Strong moves typically travel 1-1.5 ATR from VWAP with delta support
Use VWAP as dynamic support/resistance
Combine with momentum indicators (MACD, RSI) for confluence
Price above VWAP + Accepted Long state = bullish bias
Price below VWAP + Accepted Short state = bearish bias
For Mean Reversion:
Fade Long/Short states signal overextension without participation
Price beyond 1.5 ATR from VWAP with weak delta = potential reversal
Look for price return to VWAP when extended
Bollinger Band extremes + Fade state = high-probability mean reversion setup
VWAP acts as mean reversion anchor during range-bound sessions
For Risk Management:
Chop state = avoid new entries
Bollinger Band compression + Chop = pre-expansion zone (wait for breakout)
Delta compression after strong move = early exhaustion warning
State transitions (Accepted → Neutral → Fade) = tighten stops
Signal Confirmation:
Strongest setups occur when multiple factors align:
BB breakout + Accepted state + price above/below VWAP
Price rejection at BB bands + Fade state
VWAP support/resistance hold + state transition
Delta expansion + distance increasing + trend direction
⚙️ SETTINGS
All components are fully customizable through organized input groups:
VWAP Distance Group:
VWAP source (default: HLC3)
Anchor period (Session/Week/Month)
ATR length for normalization (default: 14)
Extreme distance threshold in ATR multiples (default: 1.5)
Volume Delta Group:
Delta EMA length (default: 9)
Delta expansion threshold (default: 1.3)
Acceptance Logic Group:
Acceptance lookback period (default: 5)
Chop threshold in VWAP/ATR units (default: 0.3)
Bollinger Bands Group:
BB length (default: 20)
Standard deviation multiplier (default: 2.0)
Display Group:
Toggle state backgrounds
Toggle state change labels
Toggle VWAP line
Toggle Bollinger Bands
💡 EDUCATIONAL VALUE
This indicator teaches important concepts:
How institutional money identifies fair value (VWAP)
The difference between price movement and market acceptance
Why volume participation matters more than price action alone
How to distinguish between noise and committed directional moves
The relationship between volatility compression and expansion cycles
Why distance from equilibrium predicts mean reversion probability
⚠️ IMPORTANT NOTES
This indicator is for educational and informational purposes only
This is a filter, not a standalone trading system
No indicator is perfect—always use proper risk management
Past performance does not guarantee future results
Combine with your own analysis and risk tolerance
Test thoroughly on historical data before live trading
This is not financial advice—use at your own risk
🔧 TECHNICAL DETAILS
Pine Script Version 6
Overlay indicator (displays on price chart)
All calculations use standard, well-documented formulas
No repainting—all signals are confirmed on bar close
Compatible with all timeframes and instruments
Optimized for smaller timeframes (1-5 minute charts)
Minimal computational overhead
📝 CHANGELOG
Version 1.0
Initial release
VWAP distance normalization with ATR scaling
Volume delta proxy system (bull/bear EMA)
6-state acceptance/rejection state machine
Bollinger Bands integration
Real-time dashboard with live metrics
State change labels and background coloring
Full customization options
Developed for traders who need objective participation filters to distinguish high-probability setups from low-quality noise—without cluttering their charts with multiple indicator panels.

Borna's Zones NY Borna's Zones marks two important time-based zones on the chart: the 08:00 zone and the 09:00 zone.
The 14:00 zone identifies initial liquidity. This zone sets the range where early market participants create significant activity.
The 15:00 zone serves as a reference for confirmation. After 15:00, the indicator helps you identify whether the 14:00 zone should be considered cleared.
Both zones are automatically extended until 17:00, providing clear visual references for potential market reactions.
No trading is recommended after 17:00, as the early morning zones lose relevance.
This indicator is useful for traders who focus on pre-market and early session liquidity, helping to visualize key levels where price may react.

Trend SignalSystem Trend Signal — What It Does
Shows you when your trading system says "be long" vs "stay out" — with a trailing line and buy/sell labels only when the state flips.
The Rules Built In:
BUY state requires ALL of these:
Price above 50-DMA (intermediate trend up)
10-DMA above 20-DMA (short-term trend confirmed)
Sell/Buy Pressure Ratio below 1.5 AND flattening or falling (sellers not aggressive)
RSI above 30 and not making lower lows (momentum OK)
SELL state triggers on ANY of these :
Price drops below 50-DMA (trend broken)
Pressure Ratio spikes above 2.0 (heavy selling)
RSI making lower lows AND below 40 (momentum failing)
What You See:
"Buy" label appears only when state flips from sell → buy
"Sell" label appears only when state flips from buy → sell
No spam. One label per flip.
The Trailing Line:
Uses ATR to set distance from price.
In buy state: line = close - (ATR × 2.0), ratchets up only
In sell state: line = close + (ATR × 2.0), ratchets down only

Advanced Demand ZoneThis indicator automatically identifies strong demand zones based on swing lows followed by significant bullish reactions. It is designed for 4H timeframe and crypto trading (BTC, ETH, altcoins).
Key Features:
Automatically draws clear demand zones for better visual analysis.
Filters out weak impulses to reduce false zones.
Sends alerts when price enters a demand zone.
Transparent zones that do not clutter your chart.
Fully customizable parameters: swing lookback, impulse threshold, and zone transparency.
This tool helps traders quickly spot high-probability buy areas while allowing manual confirmation with price action, making it perfect for swing and intraday trading.
