50 EMA Rejection Strategy V4 (Correct Signal Logic)//@version=6
indicator("50 EMA Rejection Strategy V4 (Correct Signal Logic)", overlay=true, max_labels_count=500)
//================ INPUTS ================//
group50 = "EMA 50 Trio"
ema50HighLen = input.int(50,"EMA50 High",group=group50)
ema50CloseLen = input.int(50,"EMA50 Close",group=group50)
ema50LowLen = input.int(50,"EMA50 Low",group=group50)
groupBase = "Additional EMAs"
ema10Len = input.int(10,"EMA10")
ema200Len = input.int(200,"EMA200")
ema600Len = input.int(600,"EMA600")
ema2400Len = input.int(2400,"EMA2400")
useTrendFilter = input.bool(false,"Use Higher Time EMA Filter")
groupRR = "Risk Reward Settings"
RR1 = input.float(1.0,"TP1 RR",step=0.5)
RR2 = input.float(2.0,"TP2 RR",step=0.5)
//================ CALCULATIONS ================//
Indicatori e strategie

CCI TIME COUNT//@version=6
indicator("CCI Multi‑TF", overlay=true)
// === Inputs ===
// CCI Inputs
cciLength = input.int(20, "CCI Length", minval=1)
src = input.source(hlc3, "Source")
// Timeframes
timeframes = array.from("1", "3", "5", "10", "15", "30", "60", "1D", "1W")
labels = array.from("1m", "3m", "5m", "10m", "15m", "30m", "60m", "Daily", "Weekly")
// === Table Settings ===
tblPos = input.string('Top Right', 'Table Position', options = , group = 'Table Settings')
i_textSize = input.string('Small', 'Text Size', options = , group = 'Table Settings')
textSize = i_textSize == 'Small' ? size.small : i_textSize == 'Normal' ? size.normal : i_textSize == 'Large' ? size.large : size.tiny
textColor = color.white
// Resolve table position
var pos = switch tblPos
'Top Left' => position.top_left
'Top Right' => position.top_right
'Bottom Left' => position.bottom_left
'Bottom Right' => position.bottom_right
'Middle Left' => position.middle_left
'Middle Right' => position.middle_right
=> position.top_right
// === Custom CCI Function ===
customCCI(source, length) =>
sma = ta.sma(source, length)
dev = ta.dev(source, length)
(source - sma) / (0.015 * dev)
// === CCI Values for All Timeframes ===
var float cciVals = array.new_float(array.size(timeframes))
for i = 0 to array.size(timeframes) - 1
tf = array.get(timeframes, i)
cciVal = request.security(syminfo.tickerid, tf, customCCI(src, cciLength))
array.set(cciVals, i, cciVal)
// === Countdown Timers ===
var string countdowns = array.new_string(array.size(timeframes))
for i = 0 to array.size(timeframes) - 1
tf = array.get(timeframes, i)
closeTime = request.security(syminfo.tickerid, tf, time_close)
sec_left = barstate.isrealtime and not na(closeTime) ? math.max(0, (closeTime - timenow) / 1000) : na
min_left = sec_left >= 0 ? math.floor(sec_left / 60) : na
sec_mod = sec_left >= 0 ? math.floor(sec_left % 60) : na
timer_text = barstate.isrealtime and not na(sec_left) ? str.format("{0,number,00}:{1,number,00}", min_left, sec_mod) : "–"
array.set(countdowns, i, timer_text)
// === Build Table ===
if barstate.islast
rows = array.size(timeframes) + 1
var table t = table.new(pos, 3, rows, frame_color=color.rgb(252, 250, 250), border_color=color.rgb(243, 243, 243))
// Headers
table.cell(t, 0, 0, "Timeframe", text_color=textColor, bgcolor=color.rgb(238, 240, 242), text_size=textSize)
table.cell(t, 1, 0, "CCI (" + str.tostring(cciLength) + ")", text_color=textColor, bgcolor=color.rgb(239, 243, 246), text_size=textSize)
table.cell(t, 2, 0, "Time to Close", text_color=textColor, bgcolor=color.rgb(239, 244, 248), text_size=textSize)
// Data Rows
for i = 0 to array.size(timeframes) - 1
row = i + 1
label = array.get(labels, i)
cciVal = array.get(cciVals, i)
countdown = array.get(countdowns, i)
// Color CCI: Green if < -100, Red if > 100
cciColor = cciVal < -100 ? color.green : cciVal > 100 ? color.red : color.rgb(236, 237, 240)
// Background warning if <60 seconds to close
tf = array.get(timeframes, i)
closeTime = request.security(syminfo.tickerid, tf, time_close)
sec_left = barstate.isrealtime and not na(closeTime) ? math.max(0, (closeTime - timenow) / 1000) : na
countdownBg = sec_left < 60 ? color.rgb(255, 220, 220, 90) : na
// Table cells
table.cell(t, 0, row, label, text_color=color.rgb(239, 240, 244), text_size=textSize)
table.cell(t, 1, row, str.tostring(cciVal, "#.##"), text_color=cciColor, text_size=textSize)
table.cell(t, 2, row, countdown, text_color=color.rgb(232, 235, 243), bgcolor=countdownBg, text_size=textSize)

Jon Secret SauceJon Secret Sauce — Advanced Trend + Momentum Entry Signals
A premium trade-timing engine that combines MA trend confirmation, volatility filters, RSI momentum, and smart volume validation to identify high-probability long & short entries on your preferred timeframe.
Includes auto-managed exits (TP / SL / technical breakdown), professional visuals, and alert notifications so you catch the move and protect profits — without overcrowding your chart.

RSI Cascade DivergencesRSI Cascade Divergences is a tool for detecting divergences between price and RSI with an extended cascade-based strength accumulation logic. A “cascade” represents a sequence of multiple divergences linked through RSI pivot points. The indicator records RSI pivots, checks whether a divergence is present, assigns a strength value to each structure, and displays only signals that meet your minimum strength thresholds.
How Divergence Logic Works
The indicator identifies local RSI extremes (pivots) based on Pivot Length and Pivot Confirm.
For every confirmed pivot it stores:
the RSI value at the pivot,
the corresponding value of the RSI Source price,
the pivot’s bar index.
How a Divergence Is Formed
A divergence is detected when two consecutive RSI pivots of the same type show opposite dynamics relative to the price source defined in RSI Source (default: close), not relative to chart highs/lows.
Bearish divergence: the price source value at the second pivot is higher, but RSI forms a lower high.
Bullish divergence: the price source value at the second pivot is lower, but RSI forms a higher low.
The indicator does not use price highs/lows — only the selected price source at the pivot points.
Cascade Strength Calculation
Each new pivot is compared only with the previous pivot of the same type.
A cascade grows in strength if:
divergence conditions are met,
the difference in RSI values exceeds Min. RSI Distance,
the previous structure already had some strength or the previous pivot was formed in the OB/OS zone.
If the divergence occurs as RSI exits OB/OS, strength is additionally increased by +1.
Behavior in Strong Trends
Divergences may appear repeatedly and even form cascades with high strength. However, if price does not react meaningfully, this indicates strong trend pressure.
In such cases, divergences stop functioning as reversal signals:
RSI attempts to counter-move, but the dominant trend continues.
The indicator accurately reflects this — cascades may form but fail to trigger any reversal, which itself suggests a powerful, persistent trend.
Filtering and Context Reset
To avoid retaining irrelevant pivots:
when RSI is above Overbought → low pivots are cleared;
when RSI is below Oversold → high pivots are cleared.
This prevents false cascades during extreme RSI conditions.
Input Parameters
RSI Source — price source used in RSI calculations (close, hl2, ohlc4, etc.).
RSI Length — RSI calculation period.
Overbought / Oversold — RSI threshold zones.
Pivot Length — number of bars to the left required for a pivot.
Pivot Confirm — bars to the right required to confirm the pivot.
Min. RSI Distance — minimum difference between two pivot RSI values for the divergence to be considered meaningful.
Min. Strength (Bull / Bear) — minimum accumulated strength for:
confirming the signal,
displaying the strength label,
triggering alerts.
Weaker signals below these thresholds appear as dashed guide structures.
Visual
Display settings for lines, markers, and colors.
These parameters do not affect the indicator logic.
Important
Divergences — including cascades — should not be used as a standalone trading signal.
Always combine them with broader market context, trend analysis, structure, volume, and risk management tools.


Multi Timeframe Traffic LightsMonthly, Weekly, Daily, Hourly previous candle range vs current price. Inside = orange, above = green, below = red

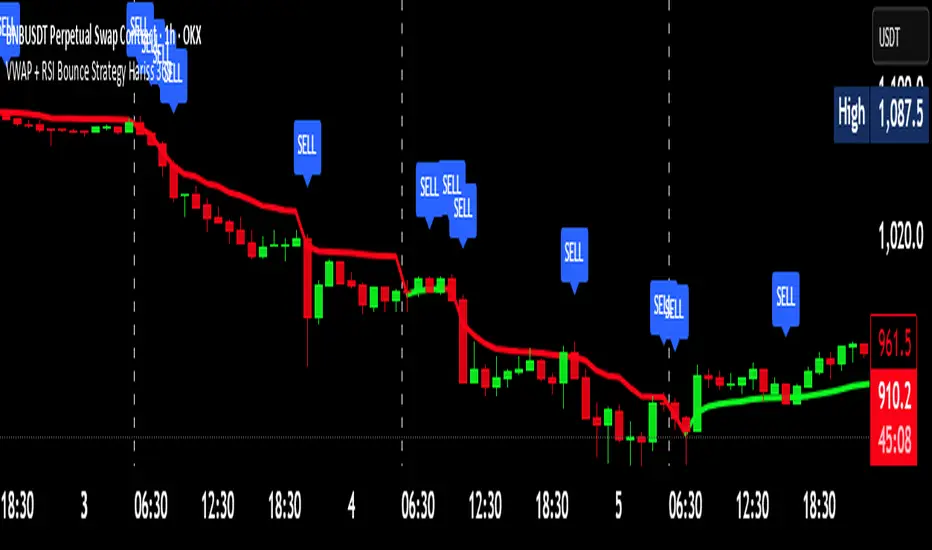
VWAP + RSI Bounce Strategy Hariss 369VWAP + RSI Bounce Strategy
This strategy combines VWAP (Volume-Weighted Average Price) and RSI momentum shift to capture high-probability reversal bounces. The idea is simple: price often reacts strongly around VWAP, which represents the true intraday fair value. When price pulls back towards VWAP and then bounces away with strength, it often marks a continuation move.
A long signal forms when:
Price touches or slightly dips below VWAP, showing a pullback
Candle closes back above VWAP, confirming a strong bullish bounce
RSI turns bullish (crosses 50 or crosses above its smoothing)
A sell signal forms in the opposite conditions with a bearish bounce below VWAP.
This combination filters out weak reactions and focuses only on momentum-backed bounces. Trend-colored VWAP helps visualize directional bias more clearly—green when VWAP is rising and red when falling. This approach is best used in trending markets and works well across intraday timeframes.
Weekly Inside Bar LTEShows weekly inside bar on lower timeframes so you can create breakout and failure zones
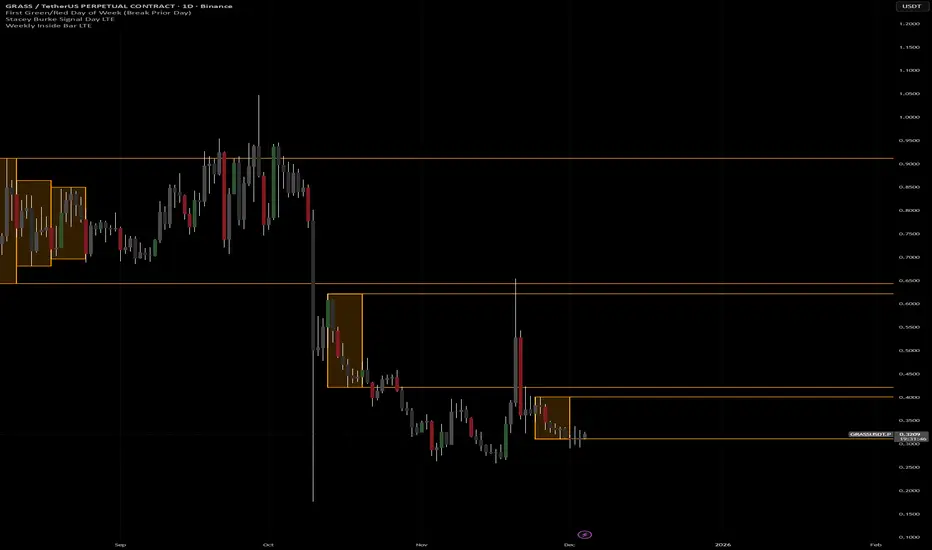
Weekly Inside Bar LTEshow weekly inside bar on lower timeframe so you can use for breakouts and breakout failures

Monday Range Levels (Fixed for Forex/XAU)Monday Range Levels Indicator (10-Line Summary)
1. Core Purpose: Defines the initial weekly range in Forex and XAU/USD for structured trading.
2. Range Definition: Automatically plots the High and Low price levels from the first hours of the 3. Monday session.
4. Liquidity Focus: Used primarily to anticipate liquidity sweeps at the start of the trading week.
5. Specific Market: Optimized for high-volatility pairs, especially XAU/USD (Gold) and major Forex pairs.
6. Session Control: Accurately identifies the start of the week regardless of local settings.
7. Timezone Customization: Allows flexible adjustment to NY Time, UTC, or UTC+7 (Vietnam Time).
8. Visual Clarity: Full customization options for line colors, text size, and range shading.
9. Strategic Use: Supports Breakout Trading and Mean Reversion strategies throughout the week.
10. Discipline Tool: Encourages structured trading by providing fixed, objective reference levels.
Application: Simple, reliable tool for consistent Day Trading and Scalping.
"If I get enough love/support, I'll be dropping more indicators for the fam!"

Stock Reference DataIndicator that paints a table with reference data such as Earnings Date, Avg Volume, ATR, ATR% etc.

XRP Non-Stop Strategy (TP 25% / SL 15%)XRP Non-Stop Strategy (TP 25% / SL 15%) is a continuous long-side trading system designed specifically for XRP. The strategy uses an EMA-based trend filter (EMA20/EMA50) to confirm bullish conditions before entering a long position. Each trade applies a fixed +25% Take Profit target and a −15% Stop Loss, calculated dynamically from the entry price.
When a trade closes—whether by TP or SL—the strategy automatically re-enters on the next qualifying signal, enabling uninterrupted position cycling.
Features include:
• EMA-based trend confirmation
• Dynamic TP/SL visualization on the chart
• Clear BUY and EXIT markers
• Dedicated alert conditions for automation

Apex Trend & Liquidity Master with TP/SLThe Apex Trend & Liquidity Master is a systematic trading framework that identifies trend direction and key structural price levels for entry and exit decisions. The system uses a volatility-adaptive trend detection mechanism built on Hull Moving Averages with ATR-based bands to filter consolidation periods and isolate directional moves.
The liquidity detection engine identifies potential reversal zones by marking swing highs and lows that meet statistical significance thresholds. These zones represent areas where institutional order flow previously caused price rejection. Zones remain active until price closes through them, indicating mitigation of the level.
This implementation is an enhanced derivative of the original system with fully automated risk management. Stop losses are calculated using ATR multiples with entry candle wick protection as a minimum threshold, while take profits maintain a fixed 3:1 risk-reward ratio. An additional exit mechanism closes profitable positions when price reaches opposing supply or demand zones, providing early profit-taking at probable reversal points before full target completion.
Entry signals generate only on trend changes when volume exceeds average levels, reducing false breakouts in ranging conditions. The system includes complete position tracking with three distinct exit types: take profit hits, stop loss hits, and profitable zone contact exits. All calculations use confirmed historical data with no forward-looking bias, though supply/demand zone identification operates with a confirmation lag inherent to pivot point detection.

Quarter + 50 BandsThe indicator does two main things:
Draws a red quarter-point grid (every 25 points by default).
Draws green and blue “bands” that sit 50 points below and above each big 100-point figure.
Think of it like:
Red = your normal 25-point quarters
Green = “sweet spot” 50 points below each 100-pt handle
Blue = “sweet spot” 50 points above each 100-pt handle
It fully customizable.

Yesterday Low LineTraces a red dotted line on the low of yesterdays session for the present graph - and extends into the future

SPX-to-ES Gamma Levels (20 GEX Levels)Draws GEX levels specified by user on ES futures chart.
User inputs SPX-to-ES offset, SPX price level, and length of box

India VIX Tray - DynamicIndia VIX Table
Shows INDIAVIX value as a tray in Chart with Dynamic colour change according to Low Volatility, Moderate Volatility, High Volatility.

XRP Non-Stop Strategy (TP 25% / SL 15%)This strategy performs continuous automated trading exclusively on XRP. It opens long positions during favorable trend conditions, using a fixed Take Profit target of 25% above the entry price and a fixed Stop Loss of 15% below the entry. Once a trade is closed (either TP or SL), the strategy automatically re-enters on the next valid signal, enabling uninterrupted trading.
The script includes:
Dynamic Take Profit & Stop Loss lines
Optional EMA trend filter
Visual BUY and EXIT markers
TradingView alerts for automation or notifications
This strategy is built for traders who want a simple, price-action-driven system without fixed price levels, relying only on percentage-based movement from each entry.

KENW Liq Sweep 17This indicator is designed to alert on potential liquidity sweep events:
- In uptrends, it tracks Sell-Side Liquidity (SSL) by marking swing lows that occur during negative MACD histogram periods. It generates a long entry alert when price makes a lower low in SSL (i.e., the most recent SSL level is below the prior one), suggesting a sweep of sell-side liquidity before a potential bullish continuation.
- In downtrends, it tracks Buy-Side Liquidity (BSL) by marking swing highs that occur during positive MACD histogram periods. It generates a short entry alert when price makes a higher high in BSL (i.e., the most recent BSL level is above the prior one), indicating a sweep of buy-side liquidity before a potential bearish continuation.

Helix Protocol 7HELIX PROTOCOL 7
Overview
Helix Protocol 7 is an advanced trend-adaptive signal engine that dynamically adjusts its buy/sell thresholds based on real-time market regime detection. Unlike static indicators that use fixed overbought/oversold levels, Helix 7 recognizes that optimal entry and exit points shift dramatically depending on whether the market is trending strongly, ranging, or reversing.
The indicator fuses multiple analytical frameworks—momentum oscillators, trend strength metrics, volatility analysis, volume confirmation, and price structure—into a unified signal system that adapts to changing market conditions in real-time.
Core Philosophy
"Don't fight the trend—adapt to it."
In a strong uptrend, you want to buy dips early (before extreme oversold) and let winners run longer
In a downtrend, you want to sell bounces quickly and only buy true capitulation
In a neutral/ranging market, standard overbought/oversold levels apply
Helix Protocol 7 automatically detects which regime you're in and applies the appropriate thresholds.
Key Features
🔄 Trend-Adaptive Signal Thresholds
The indicator classifies markets into four states and adjusts Fisher Transform and RSI thresholds accordingly:
Trend StateDetection CriteriaBUY TriggersSELL TriggersSTRONG UPTRENDADX rising, ADX > 25, +DI > -DIFisher < 1.0, RSI < 50Fisher > 2.5, RSI > 70STRONG DOWNTRENDADX rising, ADX > 25, -DI > +DIFisher < -2.5, RSI < 25Fisher > 1.5, RSI > 60WEAK DOWNTRENDADX falling, -DI > +DIFisher < -2.5, RSI < 25Fisher > 1.5, RSI > 60NEUTRALDefault fallbackFisher < -2.0, RSI < 30Fisher > 2.0, RSI > 65
📊 Dynamic Envelope Bands
Adaptive bands that expand and contract based on:
ATR (Average True Range) - Base volatility measure
ADX (Trend Strength) - Bands widen in strong trends
Chaikin Oscillator - Volume-weighted band adjustment
🎯 Multi-Trigger Signal System
Signals can fire from multiple sources:
Trend-Based Signals - Fisher + RSI thresholds met for current regime
Band Touch Signals - Price touches upper/lower band (support/resistance)
EXTREME Signals - Price penetrates band by significant amount (bypasses cooldown)
⚡ Extreme Move Detection
When price makes an explosive move that penetrates the band by more than 30% of ATR (configurable), the signal fires with EXTREME priority and bypasses the normal cooldown period. This ensures you never miss major reversal opportunities.
📈 GXS Scoring System
A proprietary multi-factor scoring system (-1.0 to +1.0) that weighs:
Trend Strength (30%) - ADX direction and magnitude
Momentum (25%) - RSI, MACD, Stochastic, CCI, ROC consensus
Volume (20%) - OBV trend and volume surge detection
Price Structure (15%) - Band position and volatility percentile
Price Action (10%) - Bullish/bearish candle ratio
🔀 RSI Divergence Detection
Automatically detects and displays:
Regular Bullish Divergence - Price lower low + RSI higher low (reversal up)
Regular Bearish Divergence - Price higher high + RSI lower high (reversal down)
Hidden Bullish Divergence - Trend continuation signal (uptrend)
Hidden Bearish Divergence - Trend continuation signal (downtrend)
📉 BBWP Volatility Meter
Bollinger Band Width Percentile measures current volatility relative to historical norms:
LOW (< 30%) - Volatility compression, breakout imminent
MEDIUM (30-70%) - Normal market conditions
HIGH (> 70%) - Extended volatility, potential exhaustion
Visual Components
Money Line
A dynamic centerline (Linear Regression or Weighted EMA) colored by slope:
🟢 Green - Rising (bullish momentum)
🔴 Red - Falling (bearish momentum)
🟡 Yellow - Flat (consolidation)
Envelope Cloud
Shaded region between upper and lower bands, colored by Money Line slope direction for instant trend visualization.
Signal Labels
Clear entry/exit labels showing:
Price level
Trigger type (UPTREND DIP, CAPITULATION, BAND TOUCH, EXTREME, etc.)
Color coding (Green=Buy, Red=Sell, Lime=Extreme Buy, Fuchsia=Extreme Sell)
ADX Trend Bar
Bottom indicator showing trend state:
🟢 Lime - Strong Uptrend
🔴 Red - Downtrend
🟠 Orange - Weak/Transitional (ADX 15-24)
⚪ White - Ranging (ADX < 15)
🔵 Blue - Strong trend, neutral direction
Info Panel
Real-time dashboard displaying:
Current trend state
GXS Score
Active divergences
Volatility level (BBWP)
ADX value and direction
DI Spread
Fisher Transform value
RSI value
Context-sensitive BUY/SELL thresholds for current regime
Alert System
JSON Webhook Alerts (Bot-Ready)
json{
"action": "BUY",
"symbol": "BTC/USDT",
"price": "93500.00",
"trigger": "EXTREME",
"rsi": "28.5",
"fisher": "-2.31",
"adx": "32.4",
"trend_state": "STRONG DOWN"
}
Available Alert Conditions
Buy Signal / Sell Signal
Lower Band Touch / Upper Band Touch
EXTREME Lower Band / EXTREME Upper Band
Strong Uptrend Started
Downtrend Started
Neutral Trend Started
Trend State Change
Recommended Settings
Scalping (1m-5m)
Signal Cooldown: 3-5 bars
Extreme Penetration: 0.2 (more sensitive)
ADX Length: 10-12
Swing Trading (15m-4H)
Signal Cooldown: 5-8 bars
Extreme Penetration: 0.3 (default)
ADX Length: 14 (default)
Position Trading (Daily+)
Signal Cooldown: 8-12 bars
Extreme Penetration: 0.4-0.5 (less sensitive)
ADX Length: 14-20
Input Parameters
Core Settings
Money Line Type (Linear Regression / Weighted EMA)
Money Line Length
RSI Period
Fisher Period
Dynamic Bands
ATR Period & Multiplier
Adaptive Bands toggle
Chaikin Weight
Extreme Band Penetration threshold
Trend Detection
ADX Length & Slope Lookback
Strong Trend ADX Threshold
DI Spread for Neutral detection
Signal Thresholds (by Trend State)
Fully customizable Fisher/RSI/ADX levels for each regime
Separate BUY and SELL parameters
Display Options
Toggle bands, cloud, labels, panels
Cooldown period
Debug panel for troubleshooting
Best Practices
Confirm with price action - Signals are high-probability setups, not guarantees
Respect the trend state - The panel shows current thresholds for a reason
Watch for EXTREME signals - These indicate significant reversals
Use divergences as confluence - Especially powerful at band touches
Monitor volatility - Low BBWP often precedes big moves
Version: 7.0
Author: ralis24

TQQQ Vibha Strategy – Auto Ranges + Rally Days1. Buy only after an intermediate bottom
A 20-day lowest low becomes the potential bottom.
2. Wait 3–4 days of higher highs & higher lows
higherSeq logic enforces that.
3. Avoid buying when too extended from the 200-day
Enforced with:
close <= ma200 * (1 + maxExtension) (default 10%)
4. Must close back above 200-day
Needed for “change of character”
5. Sell immediately if price breaks the Day-1 rally low (“line in the sand”)
Script sets lineInSand = bottom low
If price undercuts → close position immediately
6. Range-top rejection
Track touches of range top (highest high since bottom)
Three failures = sell (“3 strikes rule”)

DeltaBurst Locator ## DeltaBurst Locator
DeltaBurst Locator is a sponsorship detector that divides OBV impulse by price thrust, normalizes the ratio, and cross-checks it against a higher timeframe confirmation stream. The oscillator turns the abstract "is this move real?" question into a precise number, exposing accumulation, distribution, and exhaustion across futures and stocks.
HOW IT WORKS
OBV Impulse vs. Price Change – Smoothed deltas of On-Balance Volume and price are ratioed, then normalized using a hyperbolic tangent function to prevent single prints from dominating.
Signal vs. Confirmation – A short EMA produces the execution signal while a higher-timeframe request.security() feed validates whether broader flows agree.
Spectrum Classification – Expansion/compression metrics grade whether current aggression is intense or fading, while ±0.65 bands define exhaust/vacuum zones.
Slope Divergences – Linear regression slopes on both price and the ratio expose bullish/bearish sponsorship mismatches before candles reverse.
HOW TO USE IT
Breakout Validation : Only chase breakouts when both local and higher-timeframe ratios are on the same side of zero; mixed signals suggest liquidity is fading.
Absorption Trades : When the histogram spikes beyond ±0.65 but the EMA lags, expect absorption; combine with price structure for pinpoint reversals.
News/Event Monitoring : During earnings or macro releases, watch for ratio collapses with price still rising—this flags forced moves driven by hedging rather than real demand.
VISUAL FEATURES
Color logic: Positive sponsorship fills teal, negative fills crimson against the zero line, making intent obvious at a glance.
Optional markers: Burst triangles and divergence dots can be enabled when you need explicit annotations or left off for a minimalist panel.
Compression heatmap: Background shading communicates whether the market is coiling (high compression) or erupting (low compression).
Dashboard: Displays the live ratio, higher-timeframe ratio, and agreement state to speed up scanning across tickers.
PARAMETERS
Fast Pulse Length (default: 5): Controls the smoothing window for price change detection.
Slow Equilibrium Length (default: 34): Window for expansion/compression calculation.
OBV Smooth (default: 8): Smoothing period for OBV impulse calculation.
Ratio Ceiling (default: 3.0): Controls how aggressively values saturate; raise for high-volatility tickers.
Signal EMA (default: 4): EMA period for the signal line.
Confirmation Timeframe (default: 240): Pick a higher anchor (e.g., 4H) to validate intraday moves.
Divergence Window (default: 21): Window for slope-based divergence detection.
Show Burst Markers (default: disabled): Toggle burst triangles on demand.
Show Divergence Markers (default: disabled): Toggle divergence dots on demand.
Show Delta Dashboard (default: enabled): Hide when screen space is limited; leave on for desk broadcasts.
ALERTS
The indicator includes four alert conditions:
DeltaBurst Bull: Spotted a bullish liquidity burst
DeltaBurst Bear: Spotted a bearish liquidity burst
DeltaBurst Bull Div: Detected bullish sponsorship divergence
DeltaBurst Bear Div: Detected bearish sponsorship divergence
Hope you enjoy!

Price Volume Heatmap [MHA Finverse]Price Volume Heatmap - Advanced Volume Profile Analysis
Unlock the power of institutional-level volume analysis with the Price Volume Heatmap indicator. This sophisticated tool visualizes market structure through volume distribution across price levels, helping you identify key support/resistance zones, high-probability reversal areas, and optimal entry/exit points.
🎯 What Makes This Indicator Unique?
Unlike traditional volume indicators that only show volume over time, this heatmap displays volume distribution across price levels , revealing where the most significant trading activity occurred. The gradient coloring system instantly highlights high-volume nodes (areas of strong interest) and low-volume nodes (potential breakout zones).
📊 Core Features
1. Dynamic Volume Heatmap
- Visualizes volume concentration across 250 customizable price levels
- Gradient color scheme from high volume (white) to low volume (teal/green)
- Adjustable brightness multiplier for enhanced contrast and clarity
- Real-time updates as market conditions evolve
2. Point of Control (POC)
- Automatically identifies the price level with the highest traded volume
- Acts as a magnetic price level where markets often return
- Critical for identifying fair value areas and potential reversal zones
- Customizable line style, width, and color
3. Flexible Lookback Settings
- Lookback Bars: Set any value from 1-5000 bars to control analysis depth
- Visible Range Mode: Analyze only what's currently visible on your chart
- Timeframe-Specific Settings: Different lookback periods for 1m, 5m, 15m, 30m, 1h, Daily, and Weekly charts
- Adapts to your trading style - scalping to position trading
4. Session Separation Analysis
- Tokyo Session: 00:00-09:00 UTC
- London Session: 07:00-16:00 UTC
- New York Session: 13:00-22:00 UTC
- Sydney Session: 21:00-06:00 UTC
- Daily Reset: Analyze each trading day independently
Session separation allows you to understand volume distribution specific to each major trading session, revealing institutional order flow patterns and session-specific support/resistance levels.
5. Profile Width Options
- Dynamic: Profile width adjusts based on lookback period
- Fixed Bars: Set a specific bar count for consistent profile width
- Extend Forward: Project the profile into future bars for planning trades
6. Smart Alerts
- POC crossover/crossunder alerts
- New session start notifications
- Never miss critical price action at high-volume nodes
📈 How to Use This Indicator Professionally
Understanding Market Structure:
High Volume Nodes (HVN):
- Appear as bright/white areas in the heatmap
- Represent price levels where significant trading occurred
- Act as strong support/resistance zones
- Markets often consolidate or bounce from these levels
- Trading Strategy: Look for entries when price tests HVN areas with confluence from other indicators
Low Volume Nodes (LVN):
- Appear as darker/teal areas in the heatmap
- Represent price levels with minimal trading activity
- Price tends to move quickly through these areas
- Often form "gaps" in the volume profile
- Trading Strategy: Expect rapid price movement through LVN zones; avoid placing stop losses here
Point of Control (POC):
- The single most important price level in your analysis window
- Represents the fairest price where maximum volume traded
- Price gravitates toward POC like a magnet
- Trading Strategy:
* When price is above POC: bullish bias, POC acts as support
* When price is below POC: bearish bias, POC acts as resistance
* POC breaks often lead to significant trend changes
Session-Based Analysis:
Use session separation to understand how different market participants trade:
Asian Session (Tokyo/Sydney):
- Typically lower volatility and range-bound
- Volume profiles often show tight, balanced distribution
- Use for identifying overnight ranges and gap fill zones
London Session:
- Highest volume session for forex pairs
- Often shows strong directional bias
- Look for breakouts from Asian ranges during London open
New York Session:
- Maximum participation when overlapping with London
- Institutional order flow most visible
- POC during NY session often becomes key level for following sessions
🎯 Practical Trading Applications
1. Identifying Support & Resistance:
High volume nodes from the heatmap are far more reliable than traditional swing highs/lows. When price approaches an HVN, expect reaction - either a bounce or a significant breakout if breached.
2. Trend Confirmation:
- Healthy uptrend: POC rising over time, HVN forming at higher levels
- Healthy downtrend: POC falling over time, HVN forming at lower levels
- Consolidation: POC relatively flat, volume balanced across range
3. Breakout Trading:
When price breaks through a Low Volume Node with momentum, it often continues to the next High Volume Node. Use LVN areas as measured move targets.
4. Reversal Zones:
Multiple HVN stacking on top of each other creates a "volume shelf" - an extremely strong support/resistance zone where reversals are highly probable.
5. Risk Management:
- Place stops beyond HVN areas (not within LVN zones)
- Size positions based on distance to nearest HVN
- Use POC as trailing stop level in trending markets
⚙️ Recommended Settings
For Day Trading (Scalping/Intraday):
- Lookback: 200-500 bars
- Rows: 200-250
- Enable session separation for your primary trading session
- Profile Width: Dynamic or Fixed Bars (30-50)
For Swing Trading:
- Lookback: 500-1000 bars
- Rows: 250
- Session separation: Daily Reset
- Profile Width: Dynamic
For Position Trading:
- Lookback: 1000-3000 bars
- Rows: 250
- Use timeframe-specific settings
- Profile Width: Extend Forward (20-50 bars)
💡 Pro Tips
1. Combine this indicator with price action analysis - volume confirms what price is telling you
2. Watch for POC convergence with other technical levels (fibonacci, pivot points, moving averages)
3. Volume at extremes (tops/bottoms of heatmap) often indicates exhaustion
4. Session POC from previous sessions often acts as magnet for current session
5. Increase brightness multiplier (1.5-2.5) for clearer visualization on busy charts
6. Use "Number of Sessions to Display" to analyze consistency of volume levels across multiple sessions
🎨 Customization
Fully customizable visual appearance:
- Gradient colors for volume visualization
- POC line thickness, color, and style
- Session line colors and visibility
- All settings organized in intuitive groups
⚠️ Disclaimer
This indicator is a technical analysis tool and should not be used as the sole basis for trading decisions. Always combine volume analysis with proper risk management, fundamental analysis, and other technical indicators. Past performance does not guarantee future results.
---
Support & Updates
Regular updates and improvements are made to enhance functionality. For questions, suggestions, or bug reports, please use the comments section below.
Happy Trading! 📊💹
