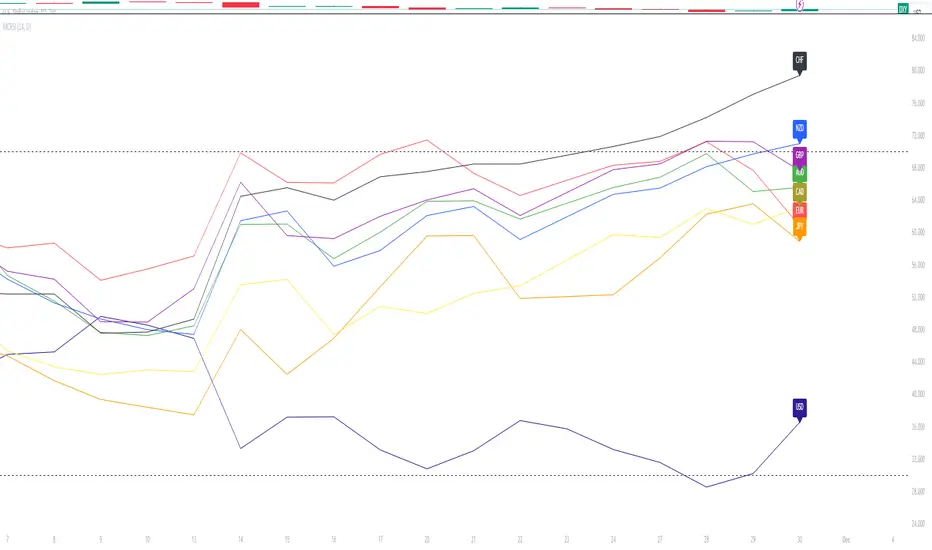
Major Currency RSI Indicator (MCRSI)Experience the power of multi-dimensional analysis with our Multi-Currency RSI Indicator (MCRSI). This innovative tool allows traders to simultaneously track and compare the Relative Strength Index (RSI) of eight different currencies in a single chart.
The MCRSI calculates the RSI for USD (DXY), EUR (EXY), JPY (JXY), CAD (CXY), AUD (AXY), NZD (ZXY), GBP (BXY), and CHF (SXY), covering a broad range of the forex market. Each RSI line is color-coded for easy differentiation and equipped with labels at the last bar for a clutter-free view.
Our indicator is designed with user-friendly customization features. You can easily adjust the length of the RSI and the time frame according to your trading strategy. It also handles gaps in the chart data with the barmerge.gaps_on option, ensuring accurate and consistent RSI calculations.
Whether you are a novice trader seeking to understand market dynamics better or an experienced trader wanting to diversify your technical analysis, the MCRSI offers a unique perspective of the forex market. This multi-currency approach can help identify potential trading opportunities that could be missed when analyzing currencies in isolation.
Harness the power of multi-currency RSI analysis with our MCRSI Indicator. It's time to step up your trading game!
Features:
Tracks 8 different currencies simultaneously
Color-coded RSI lines for easy identification
Customizable RSI length and time frame
Handles gaps in chart data
Last bar labels for a clutter-free view
Ideal for forex traders of all experience levels
How to Use:
Add the MCRSI to your TradingView chart.
Adjust the RSI length and time frame as needed.
Monitor the RSI lines and their intersections for potential trading signals.
Happy trading!
Relative Strength Index (RSI)
Advanced Dynamic Threshold RSI [Elysian_Mind]Advanced Dynamic Threshold RSI Indicator
Overview
The Advanced Dynamic Threshold RSI Indicator is a powerful tool designed for traders seeking a unique approach to RSI-based signals. This indicator combines traditional RSI analysis with dynamic threshold calculation and optional Bollinger Bands to generate weighted buy and sell signals.
Features
Dynamic Thresholds: The indicator calculates dynamic thresholds based on market volatility, providing more adaptive signal generation.
Performance Analysis: Users can evaluate recent price performance to further refine signals. The script calculates the percentage change over a specified lookback period.
Bollinger Bands Integration: Optional integration of Bollinger Bands for additional confirmation and visualization of potential overbought or oversold conditions.
Customizable Settings: Traders can easily customize key parameters, including RSI length, SMA length, lookback bars, threshold multiplier, and Bollinger Bands parameters.
Weighted Signals: The script introduces a unique weighting mechanism for signals, reducing false positives and improving overall reliability.
Underlying Calculations and Methods
1. Dynamic Threshold Calculation:
The heart of the Advanced Dynamic Threshold RSI Indicator lies in its ability to dynamically calculate thresholds based on multiple timeframes. Let's delve into the technical details:
RSI Calculation:
For each specified timeframe (1-hour, 4-hour, 1-day, 1-week), the Relative Strength Index (RSI) is calculated using the standard 14-period formula.
SMA of RSI:
The Simple Moving Average (SMA) is applied to each RSI, resulting in the smoothing of RSI values. This smoothed RSI becomes the basis for dynamic threshold calculations.
Dynamic Adjustment:
The dynamically adjusted threshold for each timeframe is computed by adding a constant value (5 in this case) to the respective SMA of RSI. This dynamic adjustment ensures that the threshold reflects changing market conditions.
2. Weighted Signal System:
To enhance the precision of buy and sell signals, the script introduces a weighted signal system. Here's how it works technically:
Signal Weighting:
The script assigns weights to buy and sell signals based on the crossover and crossunder events between RSI and the dynamically adjusted thresholds. If a crossover event occurs, the weight is set to 2; otherwise, it remains at 1.
Signal Combination:
The weighted buy and sell signals from different timeframes are combined using logical operations. A buy signal is generated if the product of weights from all timeframes is equal to 2, indicating alignment across timeframe.
3. Experimental Enhancements:
The Advanced Dynamic Threshold RSI Indicator incorporates experimental features for educational exploration. While not intended as proven strategies, these features aim to offer users a glimpse into unconventional analysis. Some of these features include Performance Calculation, Volatility Calculation, Dynamic Threshold Calculation Using Volatility, Bollinger Bands Module, Weighted Signal System Incorporating New Features.
3.1 Performance Calculation:
The script calculates the percentage change in the price over a specified lookback period (variable lookbackBars). This provides a measure of recent performance.
pctChange(src, length) =>
change = src - src
pctChange = (change / src ) * 100
recentPerformance1H = pctChange(close, lookbackBars)
recentPerformance4H = pctChange(request.security(syminfo.tickerid, "240", close), lookbackBars)
recentPerformance1D = pctChange(request.security(syminfo.tickerid, "1D", close), lookbackBars)
3.2 Volatility Calculation:
The script computes the standard deviation of the closing price to measure volatility.
volatility1H = ta.stdev(close, 20)
volatility4H = ta.stdev(request.security(syminfo.tickerid, "240", close), 20)
volatility1D = ta.stdev(request.security(syminfo.tickerid, "1D", close), 20)
3.3 Dynamic Threshold Calculation Using Volatility:
The dynamic thresholds for RSI are calculated by adding a multiplier of volatility to 50.
dynamicThreshold1H = 50 + thresholdMultiplier * volatility1H
dynamicThreshold4H = 50 + thresholdMultiplier * volatility4H
dynamicThreshold1D = 50 + thresholdMultiplier * volatility1D
3.4 Bollinger Bands Module:
An additional module for Bollinger Bands is introduced, providing an option to enable or disable it.
// Additional Module: Bollinger Bands
bbLength = input(20, title="Bollinger Bands Length")
bbMultiplier = input(2.0, title="Bollinger Bands Multiplier")
upperBand = ta.sma(close, bbLength) + bbMultiplier * ta.stdev(close, bbLength)
lowerBand = ta.sma(close, bbLength) - bbMultiplier * ta.stdev(close, bbLength)
3.5 Weighted Signal System Incorporating New Features:
Buy and sell signals are generated based on the dynamic threshold, recent performance, and Bollinger Bands.
weightedBuySignal = rsi1H > dynamicThreshold1H and rsi4H > dynamicThreshold4H and rsi1D > dynamicThreshold1D and crossOver1H
weightedSellSignal = rsi1H < dynamicThreshold1H and rsi4H < dynamicThreshold4H and rsi1D < dynamicThreshold1D and crossUnder1H
These features collectively aim to provide users with a more comprehensive view of market dynamics by incorporating recent performance and volatility considerations into the RSI analysis. Users can experiment with these features to explore their impact on signal accuracy and overall indicator performance.
Indicator Placement for Enhanced Visibility
Overview
The design choice to position the "Advanced Dynamic Threshold RSI" indicator both on the main chart and beneath it has been carefully considered to address specific challenges related to visibility and scaling, providing users with an improved analytical experience.
Challenges Faced
1. Differing Scaling of RSI Results:
RSI values for different timeframes (1-hour, 4-hour, and 1-day) often exhibit different scales, especially in markets like gold.
Attempting to display these RSIs on the same chart can lead to visibility issues, as the scaling differences may cause certain RSI lines to appear compressed or nearly invisible.
2. Candlestick Visibility vs. RSI Scaling:
Balancing the visibility of candlestick patterns with that of RSI values posed a unique challenge.
A single pane for both candlesticks and RSIs may compromise the clarity of either, particularly when dealing with assets that exhibit distinct volatility patterns.
Design Solution
Placing the buy/sell signals above/below the candles helps to maintain a clear association between the signals and price movements.
By allocating RSIs beneath the main chart, users can better distinguish and analyze the RSI values without interference from candlestick scaling.
Doubling the scaling of the 1-hour RSI (displayed in blue) addresses visibility concerns and ensures that it remains discernible even when compared to the other two RSIs: 4-hour RSI (orange) and 1-day RSI (green).
Bollinger Bands Module is optional, but is turned on as default. When the module is turned on, the users can see the upper Bollinger Band (green) and lower Bollinger Band (red) on the main chart to gain more insight into price actions of the candles.
User Flexibility
This dual-placement approach offers users the flexibility to choose their preferred visualization:
The main chart provides a comprehensive view of buy/sell signals in relation to candlestick patterns.
The area beneath the chart accommodates a detailed examination of RSI values, each in its own timeframe, without compromising visibility.
The chosen design optimizes visibility and usability, addressing the unique challenges posed by differing RSI scales and ensuring users can make informed decisions based on both price action and RSI dynamics.
Usage
Installation
To ensure you receive updates and enhancements seamlessly, follow these steps:
Open the TradingView platform.
Navigate to the "Indicators" tab in the top menu.
Click on "Community Scripts" and search for "Advanced Dynamic Threshold RSI Indicator."
Select the indicator from the search results and click on it to add to your chart.
This ensures that any future updates to the indicator can be easily applied, keeping you up-to-date with the latest features and improvements.
Review Code
Open TradingView and navigate to the Pine Editor.
Copy the provided script.
Paste the script into the Pine Editor.
Click "Add to Chart."
Configuration
The indicator offers several customizable settings:
RSI Length: Defines the length of the RSI calculation.
SMA Length: Sets the length of the SMA applied to the RSI.
Lookback Bars: Determines the number of bars used for recent performance analysis.
Threshold Multiplier: Adjusts the multiplier for dynamic threshold calculation.
Enable Bollinger Bands: Allows users to enable or disable Bollinger Bands integration.
Interpreting Signals
Buy Signal: Generated when RSI values are above dynamic thresholds and a crossover occurs.
Sell Signal: Generated when RSI values are below dynamic thresholds and a crossunder occurs.
Additional Information
The indicator plots scaled RSI lines for 1-hour, 4-hour, and 1-day timeframes.
Users can experiment with additional modules, such as machine-learning simulation, dynamic real-life improvements, or experimental signal filtering, depending on personal preferences.
Conclusion
The Advanced Dynamic Threshold RSI Indicator provides traders with a sophisticated tool for RSI-based analysis, offering a unique combination of dynamic thresholds, performance analysis, and optional Bollinger Bands integration. Traders can customize settings and experiment with additional modules to tailor the indicator to their trading strategy.
Disclaimer: Use of the Advanced Dynamic Threshold RSI Indicator
The Advanced Dynamic Threshold RSI Indicator is provided for educational and experimental purposes only. The indicator is not intended to be used as financial or investment advice. Trading and investing in financial markets involve risk, and past performance is not indicative of future results.
The creator of this indicator is not a financial advisor, and the use of this indicator does not guarantee profitability or specific trading outcomes. Users are encouraged to conduct their own research and analysis and, if necessary, consult with a qualified financial professional before making any investment decisions.
It is important to recognize that all trading involves risk, and users should only trade with capital that they can afford to lose. The Advanced Dynamic Threshold RSI Indicator is an experimental tool that may not be suitable for all individuals, and its effectiveness may vary under different market conditions.
By using this indicator, you acknowledge that you are doing so at your own risk and discretion. The creator of this indicator shall not be held responsible for any financial losses or damages incurred as a result of using the indicator.
Kind regards,
Ely

maRSI - Moving Averages for RSI with Outer BandsWhat distinguishes this indicator?
This indicator can help to identify a trend at an early stage or as a confirmation - based on a RSI and its Moving Average. It should invite you to experiment and thereby be adapted to your own way of trading.
The type of moving average could be defined: "SMA", "EMA", "DEMA", "TEMA", "SMMA", "LSMA", "HMA", "WMA"
A suggestion for interpretation of “maRSI”:
A cross over the middle line (Signal Line) can be interpreted as a trend change. Is often used for more aggressive trading styles.
Everything above the middle line (Signal Line) could be interpreted as Uptrend. Vice versa.
Depending on how the outer bands were configured, these could be interpreted as earlier signals of a trend change. Is often used for slightly less aggressive trading styles.
Depending on the selected moving average, more or less conservative signals can be output.
The plot "RSI" shows the RSI based on the settings you have made.
The plot "Signal Line" is colored and shows whether the Signal Line is up- or downtrending.
The plot "Direction: RSI to Signal Line" provides clear information about the direction in which the "Signal Line" intersects the RSI and where the RSI is to the "Signal Line". "1" means RSI above "Signal Line" and "-1" means RSI below "Signal Line"
The plot "Direction: Signal Line” provides clear information about the direction of the Signal Line. "1" means uptrending while "-1" means downtrending.
What do I need to consider?
By definition this indicator can be classified as lagging - since it based on historical prices/values. It may be advisable to add further indicators and an analysis of the market structure in order to confirm the signals issued by the indicator. Please note that when you make adjustments to any strategy, you always carry out particularly detailed tests.
Details concerning the crosses of maRSI with its Signal Line and Outer Bands:
#revision: lv07

Easy RSI Trend - The trend is your friend till the endThis indicator detects the trend for you and keeps you out of choppy markets. It does not give you a signal, rather it tells you for what kind of signals to look for on the top right of the screen: "Only Longs" or "Only Shorts"
If there is no trend or if a trend is overextended (overbought, oversold) it tells you: "No trade allowed"
The indicator does this by scanning the 4h and daily RSI. Both are displayed in a small table in the bottom right of the screen. The upper cell is the 4h RSI and the other the daily RSI value.
AGAIN: This indicator does not give you a signal. It only tells you the direction in which you should trade. It should be used with an indicator or a strategy that gives you a clear signal.

OneThingToRuleThemAll [v1.4]This script was created because I wanted to be able to display a contextual chart of commonly used indicators for scalping and swing traders, with the ability to control the visual representation on the charts as their cross-overs, cross-unders, or changes of state happen in real time. Additionally, I wanted the ability to control how or when they are displayed. While looking through other community projects, I found they lacked the ability to full customize the output controls and values used for these indicators.
The script leverages standard RSI/MACD/VWAP/MVWAP/EMA calculations to help a trader visually make more informed decisions on entering or exiting a trade, depending on their understanding on what the indicators represent. Paired with a table directly on the chart, it allows a trader to quickly reference values to make more informed decisions without having to look away from the price action or look through multiple indicator outputs.
The main functionality of the indicator is controlled within the settings directly on the chart. There a user can enable the visual representations, or disable, and configure how they are displayed on the charts by altering their values or style types.
Users have the ability to enable/disable visual representations of:
The indicator chart
RSI Cross-over and RSI Reversals
MACD Uptrends and Downtrends
VWAP Cross-overs and Cross-unders
VWAP Line
MVWAP Cross-overs and Cross-unders
MVWAP Line
EMA Cross-overs and Cross-unders
EMA Line
Some traders like to use these visual indications as thresholds to enter or exit trades. Its best to find out which ones work the best with the security you are trying to trade. Personally, I use the table as a reference in conjunction with the RSI chart indicators to help me decide a logical trailing stop if I am scalping. Some users might like the track EMA200 crossovers, and have visual representations on the chart for when that happens. However, users may use the other indicators in other methods, and this script provides the ability to be able to configure those both visually and by value.
The pine script code is open source and itself is fairly straightforward, it is mostly written to provide the ultimate level of control the the user of the various indicators. Please reach out to me directly if you would like a further understanding of the code and an explanation on anything that may be unclear.
Enjoy :)
-dead1.

RSI MFI MultiTimeframe Oversold/OverboughtHello Traders,
This indicator is designed to easily visualize the overbought/oversold states of RSI and MFI across multiple timeframes.
The indicator is very straightforward.
The deeper the red, the closer it is to 0, and the deeper the green, the closer it is to 100. The intermediate values are rendered in a transparent gray to focus on the key regions.
However, I understand that traders may have an interest in knowing the most recent state of the oscillator, whether it was overbought or oversold.
For this reason, I have included the 'Gradient Color' option in the color settings.
By turning off this option, you can easily see at a glance which region the oscillator was in most recently.
(Gradient Color Option Off)
In addition, I know that many traders are interested in the actual RSI/MFI values across multiple timeframes.
Thus, I have displayed the RSI/MFI values for each timeframe on the far right.
Furthermore, although the name of this indicator is RSI MFI MultiTimeframe Oversold/Overbought, I have also included the Stochastic RSI as an option, as I find it personally useful.
Feel free to use it if you find it helpful.

Unbound RSIUnbound RSI
Description
The Unbound RSI or de-oscillated RSI indicator is a novel technical analysis indicator that combines the concepts of the Relative Strength Index (RSI) and moving averages, applied directly over the price chart. This indicator is unique in its approach by transforming the oscillatory nature of the RSI into a format that aligns with the price action, thereby offering a distinctive view of market momentum and trends.
Key Features
Multi-Length RSI Analysis: Incorporates three different lengths of RSI (short, medium, and long), providing insights into the momentum and trend strength at various timeframes.
Deoscillation of RSI: The RSI for each length is 'deoscillated' by adjusting its scale to align with the actual price movements. This is achieved by shifting and scaling the RSI values, effectively merging them with the price line.
Average True Range (ATR) Scaling: The deoscillation process includes scaling by the Average True Range (ATR), making the indicator responsive to the asset’s volatility.
Optional Smoothing: Provides an option to apply a simple moving average (SMA) smoothing to each deoscillated RSI line, reducing noise and highlighting more significant trends.
Dynamic Moving Average (MA) Baseline: Features a moving average calculated from the medium length (default value) de-oscillated RSI, serving as a dynamic baseline to identify overarching trends.
How It’s Different
Unlike standard RSI indicators that oscillate in a fixed range, this indicator transforms the RSI to move in tandem with the price, offering a unique perspective on momentum and trend changes. The use of multiple timeframes for RSI and the inclusion of a dynamic MA baseline provide a multifaceted view of market conditions.
Potential Usage
Trend Identification: The position of the price in relation to the different deoscillated RSI lines and the MA baseline can indicate the prevailing market trend.
Momentum Shifts: Crossovers of the price with the deoscillated RSI lines or the MA baseline can signal potential shifts in momentum, offering entry or exit points.
Volatility Awareness: The ATR-based scaling of the deoscillated RSI lines means the indicator adjusts to changes in volatility, potentially offering more reliable signals in different market conditions.
Comparative Analysis: By comparing the short, medium, and long deoscillated RSI lines, traders can gauge the strength of trends and the convergence or divergence of momentum across timeframes.
Best Practices
Backtesting: Given its novel nature, it’s crucial to backtest the indicator across different assets and market conditions.
Complementary Tools: Combine with other technical analysis tools (like support/resistance levels, other oscillators, volume analysis) for more robust trading signals.
Risk Management: Always use sound risk management strategies, as no single indicator provides foolproof signals.

Dynamic Trend Fusion (DTF)The "Dynamic Trend Fusion" (DTF) indicator is a powerful technical analysis tool for traders. It stands out from other indicators due to its adaptability and ability to provide insights into different trading styles. Users can choose from various trading options such as "Short-term Trading," "Long-term Trading," "Aggressive Short-term," "Conservative Long-term," "Balanced Approach," "High Sensitivity," "Low Sensitivity," "Day Trading," and "Swing Trading." These options allow traders to customize the indicator to suit their specific trading strategies.
DTF combines the Moving Average Convergence Divergence (MACD) and Relative Strength Index (RSI) indicators, normalizing them to a similar scale for a comprehensive view of market conditions. It then calculates a combined value and smoothes it using a moving average.
One of its standout features is the ability to identify bullish and bearish states, which is represented visually on the chart. When the indicator detects a transition from a bullish to a bearish state or vice versa, the color of the line changes.
Additionally, DTF offers alert conditions, notifying users when the market shifts into a bullish or bearish state, allowing for timely decision-making.
In summary, the DTF indicator sets itself apart by providing traders with a versatile tool that can be tailored to various trading styles and offers clear visual signals for trend changes, enhancing trading precision and efficiency.

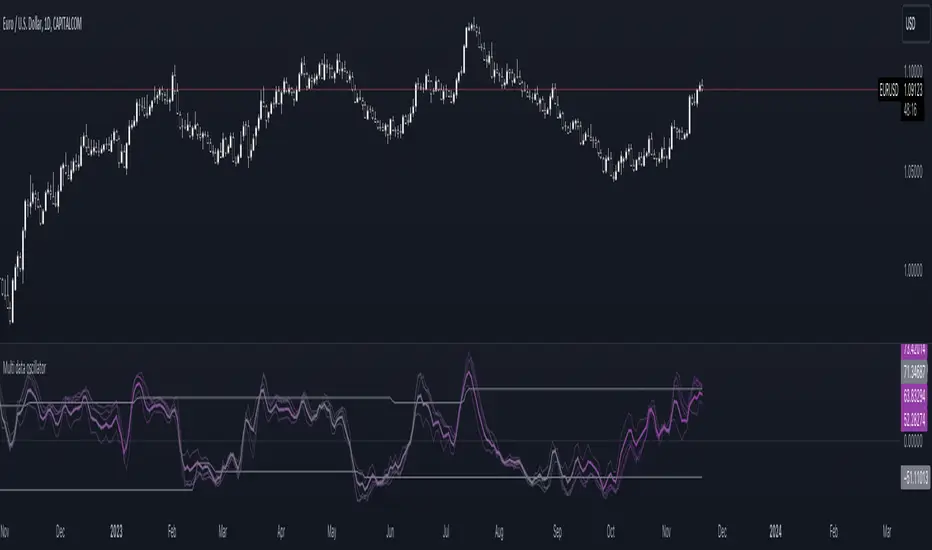
Multi-data oscillatorThe multi-data oscillator is a tool created to help traders visualize clearly how an oscillator works and moves considering different input parameters.
In this tool, you can choose to visualize the script as the RSI, the CCI, the LOC indicator, a custom-created formula that simply shows the location of the data considering X past values, or the average of all of these three indicators.
In the settings, you can choose both the length of the indicator and the smoothing factor.
Additionally, the indicator has a gradient color that changes considering the deviation and the variance of the different lines used to calculate the average line, displayed with more thickness.
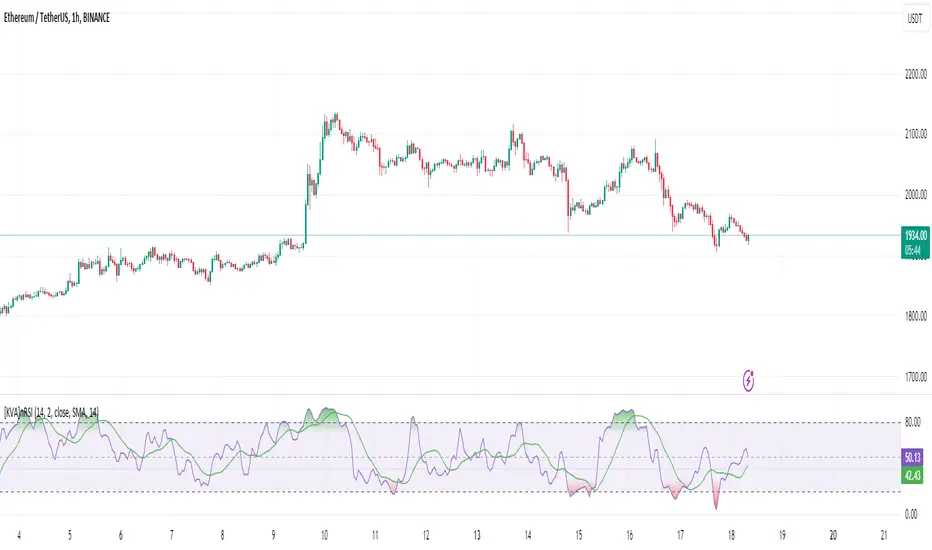
[KVA]nRSIThe nRSI stands as a groundbreaking enhancement of the traditional Relative Strength Index (RSI), specifically engineered for traders seeking a more refined and accurate tool in fast-moving markets.
Customizable Price Change Period (n): Unlike the traditional RSI which solely relies on a fixed period for average gains and losses, the nRSI introduces an additional parameter, n, to calculate price changes.
This adaptation focuses on minimizing market noise, sharpening the indicator's sensitivity to genuine trends and patterns.
Enhanced Signal Precision : By reducing the influence of short-term price spikes and fluctuations, the nRSI delivers a more precise signal. This precision is particularly crucial in volatile market conditions, where traditional indicators may be swayed by transient movements.
Ideal Usage
Strategic Trading Decisions : Ideal for traders who need to filter out insignificant price movements to make more strategic, informed trading decisions.
Reliable Divergence Spotting : Enhanced noise reduction aids in identifying more reliable divergences, key for predicting potential market reversals.
Trend Confirmation : The smoothed RSI, assisted by the moving average, becomes an invaluable tool for confirming the validity of market trends, minimizing false signals.
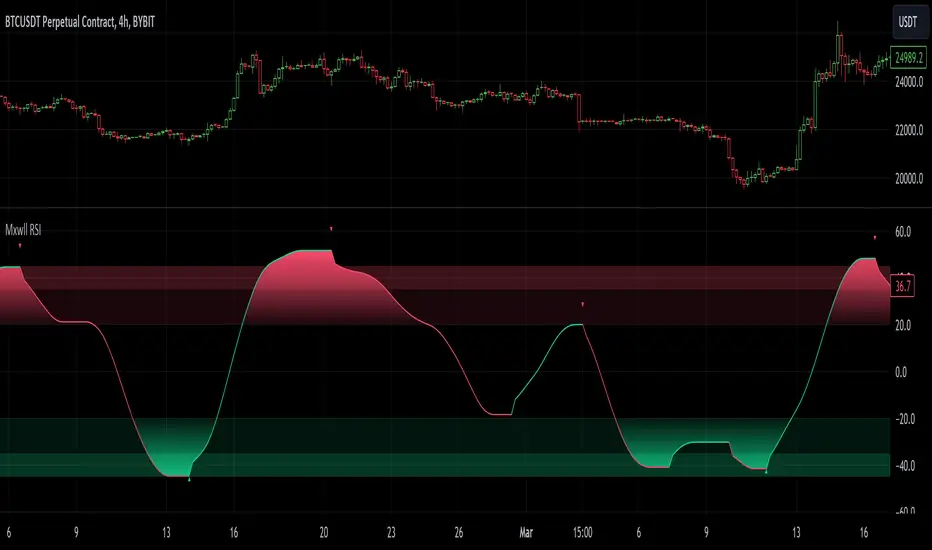
Mxwll Capital - Mxwll RSIHi!
The Mxwll RSI offers an improved overhaul of the RSI calculation. Consequently, while the scaling remains similar, the Mxwll RSI generates a smoother output, diminished lag, and less confusion as to the general direction of the trend and its inherent counter trend trading opportunities.
Features
Overbought and Oversold Regions
Bull and Bear Entry Points
Multi-Timeframe
Smooth
Diminished Lag
Improved Accuracy
Scales with relativity
Accounts for volume
How It Works
The Mxwll RSI uses a variation of the popular HMA and a variation of the popular OBV to generate signals. This indicator can be used exactly like traditional RSI; however, with improved accuracy, smoothness, and less extreme signal lag.
Essentially, Mxwll RSI normalizes and smooths OBV and uses the calculation as a factor for a volume weighted RSI. From there, Mxwll RSI is further smoothed with a variation of the Hull Moving Average. The final result produces a greatly-improved variation of the traditional RSI.
The lower the negative value for Mxwll RSI the greater bearish intensity and, consequently, the greater likelihood of a counter trend trading opportunity. Conversely, the higher the value for Mxwll RSI the greater the bullish intensity, with an improved likelihood of bullish exhaustion.
The Mxwll RSI is designed for counter trend trading. The indicator should be used to identify bullish/bearish exhaustion and anticipate an eventual reversion.
Settings
Timeframe: Mxwll RSI is multi timeframe compatible. Use this setting to control what timeframe the Mxwll RSI is calculated for.
Mxwll HMA Length: This setting controls the lookback period for the Mxwll HMA. The Mxwll HMA is an improved variation of the traditional Hull Moving Average. This setting allows controls the relative speed and smoothness of the Mxwll RSI. Higher values result in a smoother output with slightly less speed, with the overall compromise being negligible.
Mxwll RSI Period: This setting controls the relative smoothness of Mxwll RSI - similar to the RSI length setting for traditional RSI. However, the traditional RSI length setting largely controls signal output for the traditional RSI. Higher values result in little-to-no signal generation. This is not the case with Mxwll RSI. The Mxwll RSI Period can be increased for improved smoothness with little-to-no impact on signal output. This allows you to have a smoother, cleaner Mxwll RSI that still identifies counter trend trading opportunities.
How to analyze markets with the Mxwll RSI
The Mxwll RSI can be traded and used for analysis similarly to traditional RSI.
How to counter trend trade with Mxwll RSI
The Mxwll RSI has a distinct oversold region of -20 and an overbought region of 20. Further, an extremely oversold region of -35 and an extremely overbought region of 35 are included. Extremely oversold or overbought values reflect extreme price upwards/downwards price movement.
A counter trend trading opportunity is highlighted by a downwards red arrow for bearish and an upwards green arrow for bullish.
Values greater than the overbought region correspond to bullish intensity, while values greater than the extremely overbought region correspond to extreme bullish intensity. Similarly, values less than the oversold region correspond to extreme bearish intensity, while values less than the extremely oversold region correspond to extreme bearish intensity
All instances, particularly extremely overbought or extremely oversold Mxwll RSI, should prepare the user for a counter trend trading opportunity; the nail in the coffin being a green or red arrow to highlight precise entry points.
What makes Mxwll RSI better than traditional RSI
The image above details several advantages of Mxwll RSI over traditional RSI.
1. Smooth output during a trend, regardless of intensity.
Mxwll RSI sustains the primary direction of the trend; no choppy output. In real time, the general direction of RSI can be confusing, with rapid fluctuations being difficult to interpret. The Mxwll RSI is designed to maintain its output in the direction of the trend until a relatively considerable reversion occurs.
2. Clear real time analysis
The Mxwll RSI is easy to interpret in real time trading.
Green = relative uptrend
Red = relative downtrend
During a relative uptrend Mxwll RSI will not fluctuate downwards. During a relative downtrend Mxwll RSI will not fluctuate upwards. This advantage allows for clearer interpretability during realtime trading, with no confusion as to what the primary direction of the trend is and when a counter trend trading opportunity has been presented.
3. Improved signal output
Traditional RSI moves slow and rough, with only extreme price moves generating a signal for a counter trend trading opportunity. The Mxwll RSI does not suffer from this disadvantage. Relativity is better accounted for, with counter trend trading opportunities being presented during both small and large trends.
The importance of volume and OBV for the Mxwll RSI
Mxwll RSI largely considered price movement for its calculation; however, price movement doesn’t tell the entire story. By normalizing OBV and accounting for volume, the Mxwll RSI better scales with relativity and order flow. Price moves with high volume have a greater impact on the output for Mxwll RSI, and the general direction of Mxwll RSI is bound to reverse sooner if a significant counter trend move occurs with high volume. This feature allows for quicker signal output for counter trend trading.
More improvements to come; stay tuned and thank you for checking this out.
Harmonic Trend Fusion [kikfraben]📈 Harmonic Trend Fusion - Your Personal Trading Assistant
This versatile tool combines multiple indicators to provide a holistic view of market trends and potential signals.
🚀 Key Features:
Multi-Indicator Synergy: Benefit from the combined insights of Aroon, DMI, MACD, Parabolic SAR, RSI, Supertrend, and SMI Ergodic Oscillator, all in one powerful indicator.
Customizable Plot Options: Tailor your chart by choosing which signals to visualize. Whether you're interested in trendlines, histograms, or specific indicators, the choice is yours.
Color-Coded Trends: Quickly identify bullish and bearish trends with the color-coded visualizations. Stay ahead of market movements with clear and intuitive signals.
Table Display: Stay informed at a glance with the interactive table. It dynamically updates to reflect the current market sentiment, providing you with key information and trend direction.
Precision Control: Fine-tune your analysis with precision control over indicator parameters. Adjust lengths, colors, and other settings to align with your unique trading strategy.
🛠️ How to Use:
Customize Your View: Select which indicators to display and adjust plot options to suit your preferences.
Table Insights: Monitor the dynamic table for real-time updates on market sentiment and trend direction.
Indicator Parameters: Experiment with different lengths and settings to find the combination that aligns with your trading style.
Whether you're a seasoned trader or just starting, Harmonic Trend Fusion equips you with the tools you need to navigate the markets confidently. Take control of your trading journey and enhance your decision-making process with this comprehensive trading assistant.

MACD_RSI_trend_followingINFO:
This indicator can be used to build-up a strategy for trading of assets which are currently in trending phase.
My preference is to use it on slowly moving assets like GOLD and on higher timeframes, but practice may show that we find more usefull cases.
This script uses two indicators - MACD and RSI, as the timeframe that those are extracted for is configurable (defaults with the Chart TF, but can be any other selected by the user).
The strategy has the following simple idea - buy if any if the conditions below is true:
The selected TF MACD line crosses above the signal line and the TF RSI is above the user selected trigger value
The selected TF MACD line is above the signal line and the TF RSI crosses above the user selected trigger value
Once we're in position we wait for the selected TF MACD line to cross below the signal line, and then we set a SL at the low of that bar
DETAILS and USAGE:
In the current implementation I find two possible use cases for the indicator:
as a stand-alone indicator on the chart which can also fire alerts that can help to determine if we want to manually enter/exit trades based on them
can be used to connect to the Signal input of the TTS (TempalteTradingStrategy) by jason5480 in order to backtest it, thus effectively turning it into a strategy (instructions below in TTS CONNECTIVITY section)
In the example below we see a position opened at the bar after the buy indicator from the script has been triggered, and then later after the SL indicator from the script has been triggered a SL has been set on the lower wick of the closing candle, and the position eventually got closed once the price hit that level. Note that most of the drawing on the example snapshot below are from the TTS indicator following the buy/sell/SL conditions themseves:
Trading period can be selected from the indicator itself to limit to more interesting periods.
Arrow indications are drawn on the chart to indicate the trading conditions met in the script - green arrow for a buy signal indication and orange for LTF crossunder to indicate setting of SL.
SETTINGS:
Leaving all of the settings as in vanilla use case, as both the MACD and RSI indicator's settings follow the default ones for the stand-alone indicators themselves.
The start-end date is a time filter that can be extermely usefull when backtesting different time periods.
Pesonal preference is using the script on a D/W timeframe, while the indicator is configured to use Monthly chart.
The default value of the RSI filter is left to 50, which can be changed. I.e. if the RSI is above 50 we have a regime filter based on the MACD criteria.
EXTERNAL LIBRARIES:
The script uses a couple of external libraries:
HeWhoMustNotBeNamed/enhanced_ta/14 - collection of TA indicators
jason5480/tts_convention/3 - more details about the Template Trading Strategy below
I would like to highly appreciate and credit the work of both HeWhoMustNotBeNamed and jason5480 for providing them to the community.
TTS SETTINGS (NEEDED IF USED TO BACKTEST WITH TTS):
The TempalteTradingStrategy is a strategy script developed in Pine by jason5480, which I recommend for quick turn-around of testing different ideas on a proven and tested framework
I cannot give enough credit to the developer for the efforts put in building of the infrastructure, so I advice everyone that wants to use it first to get familiar with the concept and by checking
by checking jason5480's profile www.tradingview.com
The TTS itself is extremely functional and have a lot of properties, so its functionality is beyond the scope of the current script -
Again, I strongly recommend to be thoroughly epxlored by everyone that plans on using it.
In the nutshell it is a script that can be feed with buy/sell signals from an external indicator script and based on many configuration options it can determine how to execute the trades.
The TTS has many settings that can be applied, so below I will cover only the ones that differ from the default ones, at least according to my testing - do your own research, you may find something even better :)
The current/latest version that I've been using as of writing and testing this script is TTSv48
Settings which differ from the default ones:
from - False (time filter is from the indicator script itself)
Deal Conditions Mode - External (take enter/exit conditions from an external script)
🔌Signal 🛈➡ - MACD_RSI_trend_following: 🔌Signal to TTSv48 (this is the output from the indicator script, according to the TTS convention)
Sat/Sun - true (for crypto, in order to trade 24/7)
Order Type - STOP (perform stop order)
Distance Method - HHLL (HigherHighLowerLow - in order to set the SL according to the strategy definition from above)
The next are just personal preferenes, you can feel free to experiment according to your trading style
Take Profit Targets - 0 (either 100% in or out, no incremental stepping in or out of positions)
Dist Mul|Len Long/Short- 10 (make sure that we don't close on profitable trades by any reason)
Quantity Method - EQUITY (personal backtesting preference is to consider each backtest as a separate portfolio, so determine the position size by 100% of the allocated equity size)
Equity % - 100 (note above)

RSI & Backed-Weighted MA StrategyRSI & MA Strategy :
INTRODUCTION :
This strategy is based on two well-known indicators that work best together: the Relative Strength Index (RSI) and the Moving Average (MA). We're going to use the RSI as a trend-follower indicator, rather than a reversal indicator as most are used to. To the signals sent by the RSI, we'll add a condition on the chart's MA, filtering out irrelevant signals and considerably increasing our winning rate. This is a medium/long-term strategy. There's also a money management method enabling us to reinvest part of the profits or reduce the size of orders in the event of substantial losses.
RSI :
The RSI is one of the best-known and most widely used indicators in trading. Its purpose is to warn traders when an asset is overbought or oversold. It was designed to send reversal signals, but we're going to use it as a trend indicator by increasing its length to 20. The RSI formula is as follows :
RSI (n) = 100 - (100 / (1 + (H (n)/L (n))))
With n the length of the RSI, H(n) the average of days closing above the open and L(n) the average of days closing below the open.
MA :
The Moving Average is also widely used in technical analysis, to smooth out variations in an asset. The SMA formula is as follows :
SMA (n) = (P1 + P2 + ... + Pn) / n
where n is the length of the MA.
However, an SMA does not weight any of its terms, which means that the price 10 days ago has the same importance as the price 2 days ago or today's price... That's why in this strategy we use a RWMA, i.e. a back-weighted moving average. It weights old prices more heavily than new ones. This will enable us to limit the impact of short-term variations and focus on the trend that was dominating. The RWMA used weights :
The 4 most recent terms by : 100 / (4+(n-4)*1.30)
The other oldest terms by : weight_4_first_term*1.30
So the older terms are weighted 1.30 more than the more recent ones. The moving average thus traces a trend that accentuates past values and limits the noise of short-term variations.
PARAMETERS :
RSI Length : Lenght of RSI. Default is 20.
MA Type : Choice between a SMA or a RWMA which permits to minimize the impact of short term reversal. Default is RWMA.
MA Length : Length of the selected MA. Default is 19.
RSI Long Signal : Minimum value of RSI to send a LONG signal. Default is 60.
RSI Short signal : Maximum value of RSI to send a SHORT signal. Default is 40.
ROC MA Long Signal : Maximum value of Rate of Change MA to send a LONG signal. Default is 0.
ROC MA Short signal : Minimum value of Rate of Change MA to send a SHORT signal. Default is 0.
TP activation in multiple of ATR : Threshold value to trigger trailing stop Take Profit. This threshold is calculated as multiple of the ATR (Average True Range). Default value is 5 meaning that to trigger the trailing TP the price need to move 5*ATR in the right direction.
Trailing TP in percentage : Percentage value of trailing Take Profit. This Trailing TP follows the profit if it increases, remaining selected percentage below it, but stops if the profit decreases. Default is 3%.
Fixed Ratio : This is the amount of gain or loss at which the order quantity is changed. Default is 400, which means that for each $400 gain or loss, the order size is increased or decreased by a user-selected amount.
Increasing Order Amount : This is the amount to be added to or subtracted from orders when the fixed ratio is reached. The default is $200, which means that for every $400 gain, $200 is reinvested in the strategy. On the other hand, for every $400 loss, the order size is reduced by $200.
Initial capital : $1000
Fees : Interactive Broker fees apply to this strategy. They are set at 0.18% of the trade value.
Slippage : 3 ticks or $0.03 per trade. Corresponds to the latency time between the moment the signal is received and the moment the order is executed by the broker.
Important : A bot has been used to test the different parameters and determine which ones maximize return while limiting drawdown. This strategy is the most optimal on BITSTAMP:ETHUSD with a timeframe set to 6h. Parameters are set as follows :
MA type: RWMA
MA Length: 19
RSI Long Signal: >60
RSI Short Signal : <40
ROC MA Long Signal : <0
ROC MA Short Signal : >0
TP Activation in multiple ATR : 5
Trailing TP in percentage : 3
ENTER RULES :
The principle is very simple:
If the asset is overbought after a bear market, we are LONG.
If the asset is oversold after a bull market, we are SHORT.
We have defined a bear market as follows : Rate of Change (20) RWMA < 0
We have defined a bull market as follows : Rate of Change (20) RWMA > 0
The Rate of Change is calculated using this formula : (RWMA/RWMA(20) - 1)*100
Overbought is defined as follows : RSI > 60
Oversold is defined as follows : RSI < 40
LONG CONDITION :
RSI > 60 and (RWMA/RWMA(20) - 1)*100 < -1
SHORT CONDITION :
RSI < 40 and (RWMA/RWMA(20) - 1)*100 > 1
EXIT RULES FOR WINNING TRADE :
We have a trailing TP allowing us to exit once the price has reached the "TP Activation in multiple ATR" parameter, i.e. 5*ATR by default in the profit direction. TP trailing is triggered at this point, not limiting our gains, and securing our profits at 3% below this trigger threshold.
Remember that the True Range is : maximum(H-L, H-C(1), C-L(1))
with C : Close, H : High, L : Low
The Average True Range is therefore the average of these TRs over a length defined by default in the strategy, i.e. 20.
RISK MANAGEMENT :
This strategy may incur losses. The method for limiting losses is to set a Stop Loss equal to 3*ATR. This means that if the price moves against our position and reaches three times the ATR, we exit with a loss.
Sometimes the ATR can result in a SL set below 10% of the trade value, which is not acceptable. In this case, we set the SL at 10%, limiting losses to a maximum of 10%.
MONEY MANAGEMENT :
The fixed ratio method was used to manage our gains and losses. For each gain of an amount equal to the value of the fixed ratio, we increase the order size by a value defined by the user in the "Increasing order amount" parameter. Similarly, each time we lose an amount equal to the value of the fixed ratio, we decrease the order size by the same user-defined value. This strategy increases both performance and drawdown.
Enjoy the strategy and don't forget to take the trade :)

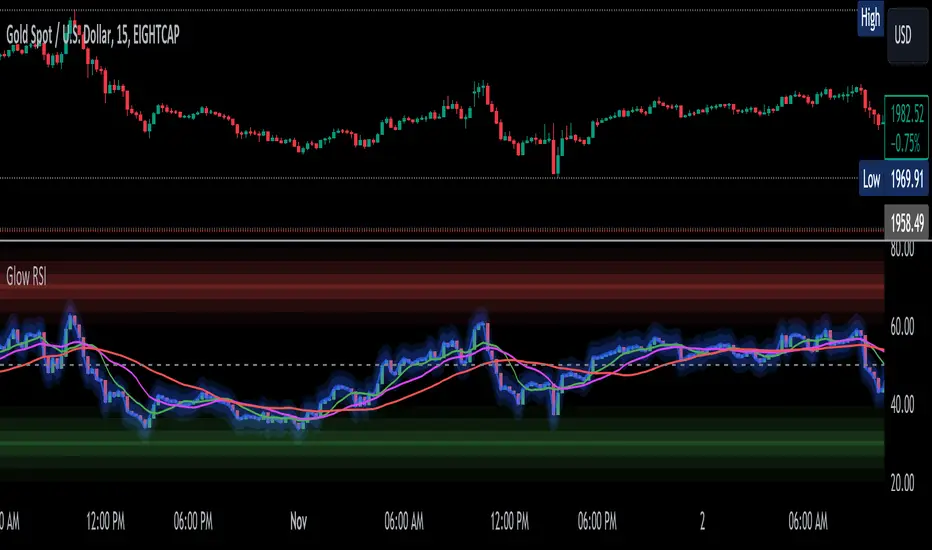
Glowing RSI Candlesticks (With Buy and Sell helpers)This is not your average, boring RSI indicator.
This indicator is still an RSI (momentum) indicator, but I have converted the line into candlesticks.
It has an option to make it glow neon blue to make it look cooler (dark background recommended for full effect).
There is a red zone at 70, because of course, and a green zone at 30 for the same reason.
On top of that, it has triple moving averages, two of which it uses to create some simple buy and sell indications (the vertical green and red lines).
Enjoy! :)
EUR/USD 45 MIN Strategy - FinexBOTThis strategy uses three indicators:
RSI (Relative Strength Index) - It indicates if a stock is potentially overbought or oversold.
CCI (Commodity Channel Index) - It measures the current price level relative to an average price level over a certain period of time.
Williams %R - It is a momentum indicator that shows whether a stock is at the high or low end of its trading range.
Long (Buy) Trades Open:
When all three indicators suggest that the stock is oversold (RSI is below 25, CCI is below -130, and Williams %R is below -85), the strategy will open a buy position, assuming there is no current open trade.
Short (Sell) Trades Open:
When all three indicators suggest the stock is overbought (RSI is above 75, CCI is above 130, and Williams %R is above -15), the strategy will open a sell position, assuming there is no current open trade.
SL (Stop Loss) and TP (Take Profit):
SL (Stop Loss) is 0.45%.
TP (Take Profit) is 1.2%.
The strategy automatically sets these exit points as a percentage of the entry price for both long and short positions to manage risks and secure profits. You can easily adopt these inputs according to your strategy. However, default settings are recommended.
