Three Inside [TradingFinder] 3 Inside Up & Down Chart Patterns🔵 Introduction
"3 inside up" and "3 inside down" denote a duo of candlestick reversal patterns, each comprising three individual candles, commonly observed on candlestick charts.
These patterns manifest as a sequence of three candles, signaling a potential loss of momentum in the current trend and a potential reversal in direction.
This pattern consists of 3 consecutive candles and can be either "bullish" or "bearish".
In the bullish pattern, known as "Inside Up," emerging at the conclusion of a downtrend, the final candle must exhibit bullish characteristics, while the third candle from the end must display bearish traits.
Conversely, in the bearish pattern, termed "Inside Down," occurring at the culmination of an uptrend, the last candle must demonstrate bearish behavior, with the third candle from the end reflecting bullish attributes.
🔵 How to Use
Using this indicator is very simple. Filtering "Strong 3 Inside Bar" and "Weak 3 Inside Bar" is a feature available in the settings section. You can turn the filter "On" or "Off." By default, the "Filter" is set to "On."
" Filter: On ":
" Filter: Off ":
🔵 How to Display
For better display and differentiation of "Strong 3 Inside Bar" and "Weak 3 Inside Bar," when the "Filter: On" is active, the 3 Inside Bars are displayed in green and red colors. When the "Filter: Off" is active, the 3 Inside Bars are displayed in blue and black colors.
Cerca negli script per "Candlestick"

MTFT Last HML wOpen, TheStrat Suite (3of5)Multi Time Frame Tools
Multi Time Frame Tools (MTFT) is a suite of scripts aimed to establish a standard timeframe-based color scheme. This can be utilized to overlay different timeframes calculations/values over a single timeframe. As one example, this would allow to observe the 5-month moving average, 5-week moving average, and 5-day moving average overlaid over each other. This would allow to study a chart, get accustomed to the color scheme and study all these at the same time much easier.
All indicators calculated using the below specific timeframes as input, will always use the color scheme outlined below. This is to get you in habit of recognizing the different timeframes overlaid in top of each other. These can be personalized.
Longer TF analysis.
Yearly - Black
Semi-Annual - Yellow
Quarterly - White
Monthly - Maroon
Weekly - Royal Blue
Daily - Lime
Shorter TF analysis.
4 hour - Fuchsia
1 hour - Orange
30 min - Red
15 min - Brown
10 min - Purple
5 min - Lilac
All color coordination is able to be modified in either the “Inputs” or “Style” section. If you need to make changes, make sure to select “Save as Default” on the bottom right of the settings menu.
Recommended Chart Color Layout
I played around with color coordination a lot. The final product was what worked best for me. I personally use the following chart settings to accent all available TF colors.
-> Click on the settings wheel on your chart. -> Click on “Appearance”.
Background - Solid -> On the top row pick the 6th color from the left.
Vert Grid Lines and Horz Grid Lines -> On the top row pick the 7th color from the left.
You may of course change these and the indicator line colors as you like.
Adding indicator to Chart
-> Open the TradingView “Indicators & Strategies” library, the icon has “ƒx”. -> All premium scripts will be located under “Invite-Only Scripts” -> Click indicator to add to your chart.
MTFT TheStrat Suite (5 Scripts)
Rob Smith is the creator of ‘TheStrat’ trading strategy. For ‘TheStrat’ I have put together a suite of 5 premium scripts that combined will offer people interested in learning ‘TheStrat’ a cleaner learning process. For 2 of the 5 scripts specifically, the MTFT approach of overlaying multiple longer timeframes(TF) over a shorter TF selected as a display cannot be utilized. The other 2 scripts will have full MTFT functionality and they are my personal favorite. I will be providing very basic info to utilize this script; it is up to you to dive deep into learning this strategy. I am not an expert with the tool or a financial advisor. As with all aspects of life, I recommend you research, learn, discern and practice extensively in order to become a master.
1. MTFT Patterns Pro/Noob
2. MTFT Full Time Frame Continuity Table
*3. MTFT Last HML wOpen
4. MTFT Actionable Signal Targets
5. MTFT Reversal Lines
MTFT Last HML wOpen, TheStrat Suite (3of5)
Plots previous High, Mean(50% line), and Low of the previous candlestick and the open for the active TF. This allows you to see how TheStrat Absolute Truths move within the different timeframes. In the image below you see the monthly TF selected. Price on the monthly candlestick has created several reversals up and down.
Now Utilizing this tool, you get to see how priced moved on the daily TF with the previous monthly HML lines plotted(Maroon lines) over the active month so you can see exactly how the absolute truths occur inside each month. Notice the previous High/Low are a thicker width then the Mean, this outlines more clearly which of the lines you are looking at. I’ve included some comments on basic observations.
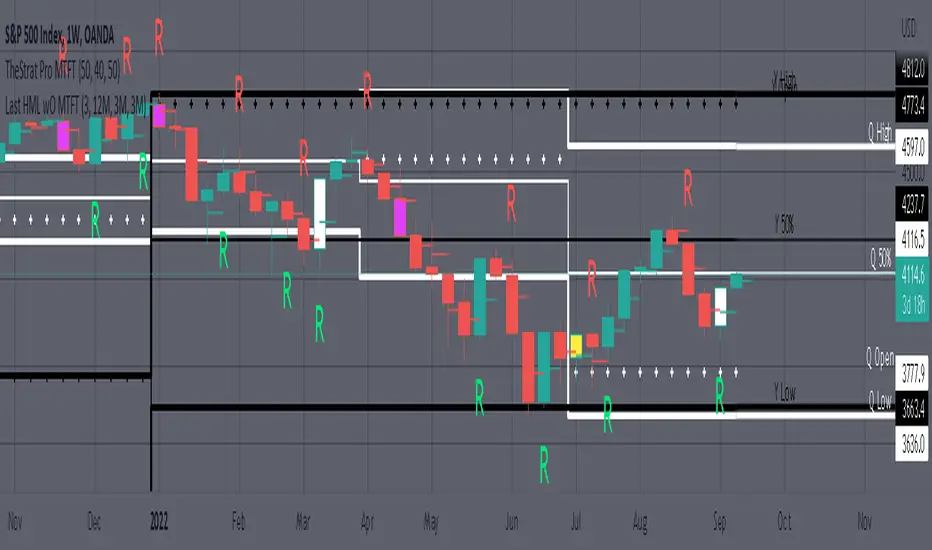
Now for contrast, below I show you the daily TF selected with the previous quarter HML lines plotted(White lines) over the active quarter.
Script Features includes:
1. Three Timeframes per script instance. Example below shows 3 timeframes in use, Yearly(Black Lines), Quarterly( White Lines), and Monthly (Maroon Lines) on the weekly timeframe candlestick. This is where using a timeframe-based color scheme per individual timeframe will come in very handy. The open of the active timeframe is displayed using the small circles that make a line. The displayed open feature is another way to track full time frame continuity if you are tracking the open of several timeframes. The open of the active timeframe is displayed using the small circles that make a line.
2. 20 different TF to pick from per slot. Timeframes(TF) include: Yearly(Y), Semi-annually(S), Quarterly(Q), Monthly(M), 2-Week(2W), Weekly(W), 3-Day(3D), Daily(D), 12 hour, 8 hour, 6 hour, 4 hour, 3 hour, 2 hour, 1 hour, 30 min, 15 min, 10 min, 5 min. Notice: 2W, 3D, 2D, 12h, 8h, 6h, 3h, and 2h don’t have a supported color scheme as I do not personally use them. They are available to pick from in the timeframe selection and you can set a color for these timeframes under the “Unsupported Color Scheme” section in the settings menu for the script if you would like to use them.
3. Enable/Disable High, Mean, Low or Open on any of the timeframe slots. Custom selection of plots will create clarity in observing timeframe-based analysis. Example below shows the Yearly Open enabled on a Monthly timeframe candlestick selected, along with the 6-month HML lines(This is similar to the quarter, the semi-annual)it shows how the start of the year gave a clear direction several times in the past few years for BTC/USD. A similar analysis can be done across multiple settings. TheStrat Actionable Signals paired with ideas like these can be great setups.
4. Auto-hide timeframes based on specific timeframes selected. For this script, I look for HML lines to have at least 4 total candlesticks within the selected TF. I disable any setting that has 3 or less candlesticks. This applies to all timeframes. This will allow for you to leave several instances of the script in your chart and zoom in and out to see macro/micro levels of a chart. The example below has 2 different instances of the script enabled, first instance (Y, Q, M), and second instance (W, D, 4h). with the Month candlestick selected. Notice how only the Year HML plots are displayed. All other lower timeframes are hidden, this will allow for an easy transition into a lower timeframe analysis.
Same example as above, but now with the Weekly timeframe candlestick selected. Notice that without changing any settings on the scripts the Quarterly (White) and Monthly (Maroon) are now visible.
One more time, this time with the 30m candlestick timeframe selected. Notice that without changing any settings on the scripts the Day(Green) and the 4 hour(Pink) plots appear.
5. Custom Width Selection in script settings per plot type, High, Mean, Low and Open.
IMPORTANT NOTE for TradingView Admin: One of the lessons I would consider most important in attaining clarity regarding trading, is “TheStrat” by Rob Smith. His lesson on “actionable signals” is something that can be applied to any strategy. For this reason, I am including “MTFT TheStrat Patterns Pro” script in all images that will depict confluence for a better trade selection.
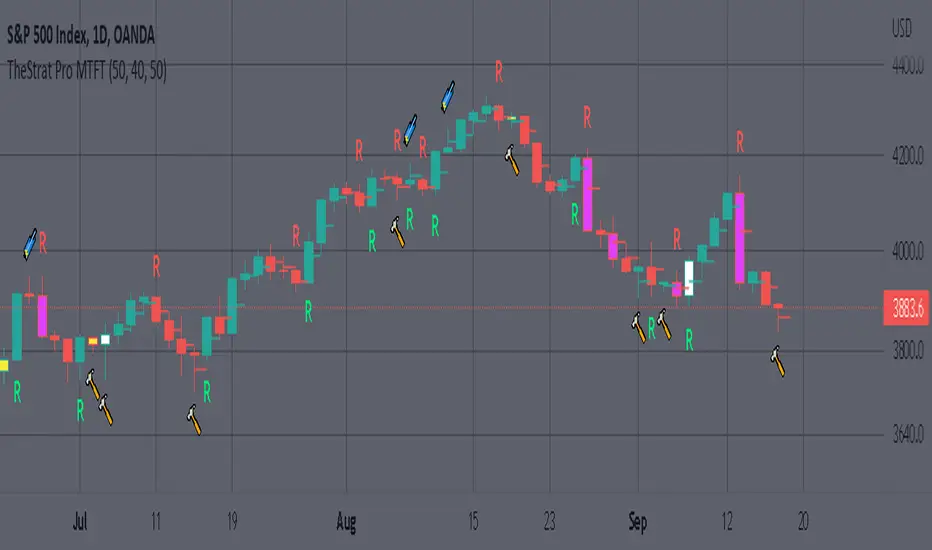
Example using TheStrat Pro MTFT with this indicator.
Look for a “TheStrat actionable signal” or a “TheStrat Reversal signal” on a smaller timeframe that has an instance of this indicator on a larger timeframe calculation that is in range of the candlestick that formed your actionable signal. This means that the indicators plot you are observing must be above the low and below the high of the candlestick that is the actionable signal/reversal signal. Image below shows what this would look like with this indicator.
The Image below shows what this would look like with this indicator. The selected timeframe is the Daily, it shows an ‘H’ char below which is an indication of a Hammer Actionable signal and the low from last week is in range showing some potential support. This actionable signal is meant to be played for LONGS. If the high is breached than you would enter a LONG position. For targets you would look at the previous pivots, for this example all targets were hit. This won’t always play out so nice and clean, but given that there is so many stocks and so many signals this is just a thought to improve the quality of the signal as it has extra confluence.
Malama's Candle Sniper Malama's Candle Sniper
This Pine Script is an overlay indicator crafted for TradingView to detect and highlight a variety of bullish and bearish candlestick patterns directly on the price chart. Its primary goal is to assist traders in identifying potential reversal or continuation signals by marking these patterns with labeled visual cues. The indicator is versatile, applicable across different markets (e.g., stocks, forex, cryptocurrencies) and timeframes, making it a valuable tool for enhancing technical analysis and informing trading decisions.
Originality and Usefulness
While the candlestick patterns detected by this script are well-established in technical analysis, "Malama's Candle Sniper" stands out due to its comprehensive nature. It consolidates the detection of numerous patterns—ranging from engulfing patterns to doji variations and multi-candle formations—into a single, unified indicator. This eliminates the need for traders to apply multiple individual indicators, streamlining their charting process and saving time.
The indicator’s usefulness lies in its ability to:
Provide Visual Clarity: Labels are plotted on the chart when patterns are detected, offering immediate recognition of potential trading opportunities.
Broad Pattern Coverage: It identifies both bullish and bearish patterns, accommodating various market conditions and trading strategies.
This makes it an ideal tool for traders who incorporate candlestick analysis into their decision-making, whether for spotting trend reversals or confirming ongoing momentum.
How It Works
"Malama's Candle Sniper" operates by defining helper functions in Pine Script that evaluate whether specific candlestick pattern conditions are met for the current bar. Each function returns a boolean value (true/false) based on predefined criteria involving the open, high, low, and close prices of the candles. The script then checks for transitions from false to true (i.e., a pattern newly appearing) and plots a corresponding label on the chart.
Bullish Patterns Detected
The script identifies the following bullish patterns, which typically signal potential upward price movements:
Bullish Engulfing: A small bearish candle followed by a larger bullish candle that engulfs it.
Three White Soldiers: Three consecutive bullish candles with higher closes.
Bullish Three Line Strike: Three bullish candles followed by a bearish candle that doesn’t negate the prior uptrend.
Three Inside Up: A bearish candle, a smaller bullish candle within its range, and a strong bullish confirmation candle.
Dragonfly Doji: A doji with a long lower wick and little to no upper wick, opening and closing near the high.
Piercing Line: A bearish candle followed by a bullish candle that opens below the prior low and closes above the midpoint of the prior candle.
Bullish Marubozu: A strong bullish candle with no upper or lower wicks.
Bullish Abandoned Baby: A bearish candle, a doji gapped below it, and a bullish candle gapped above the doji.
Rising Window: A gap up between two candles, with the current low above the prior high.
Hammer: A candle with a small body and a long lower wick, indicating rejection of lower prices.
Morning Star: A three-candle pattern with a bearish candle, a small-bodied middle candle, and a strong bullish candle.
Bearish Patterns Detected
The script also detects these bearish patterns, which often indicate potential downward price movements:
Bearish Engulfing: A small bullish candle followed by a larger bearish candle that engulfs it.
Three Black Crows: Three consecutive bearish candles with lower closes.
Bearish Three Line Strike: Three bearish candles followed by a bullish candle that doesn’t reverse the downtrend.
Three Inside Down: A bullish candle, a smaller bearish candle within its range, and a strong bearish confirmation candle.
Gravestone Doji: A doji with a long upper wick and little to no lower wick, opening and closing near the low.
Dark Cloud Cover: A bullish candle followed by a bearish candle that opens above the prior high and closes below the midpoint of the prior candle.
Bearish Marubozu: A strong bearish candle with no upper or lower wicks.
Bearish Abandoned Baby: A bullish candle, a doji gapped above it, and a bearish candle gapped below the doji.
Falling Window: A gap down between two candles, with the current high below the prior low.
Hanging Man: A candle with a small body and a long lower wick after an uptrend, signaling potential reversal.
Label Plotting
When a pattern is detected (i.e., its condition transitions from false to true):
Bullish Patterns: A label is plotted at the high of the bar, using a green background with white text and a downward-pointing style (e.g., "Bull Engulf" for Bullish Engulfing).
Bearish Patterns: A label is plotted at the low of the bar, using a red background with white text and an upward-pointing style (e.g., "Bear Engulf" for Bearish Engulfing).
This visual distinction helps traders quickly differentiate between bullish and bearish signals and their precise locations on the chart.
Strategy and Risk Management
Backtesting: "Malama's Candle Sniper" is strictly an indicator and does not include backtesting capabilities or automated trading signals. It does not simulate trades or provide performance statistics such as win rates or profit/loss metrics.
Risk Management: As an informational tool, it lacks built-in risk management features. Traders must independently implement strategies like stop-loss orders, take-profit levels, or position sizing to manage risk when acting on the detected patterns. For example, a trader might place a stop-loss below a Hammer pattern’s low or above a Hanging Man’s high to limit potential losses.
User Settings and Customization
Inputs: The script does not offer user-configurable inputs. All pattern detection logic is hardcoded, meaning traders cannot adjust parameters such as lookback periods or pattern sensitivity through the interface.
Customization: Advanced users with Pine Script knowledge can modify the code directly to:
Add or remove patterns.
Adjust the conditions (e.g., tweak the wick-to-body ratio for a Hammer).
Change label styles or colors.
However, the default version is fixed and ready-to-use as is.
Visualizations and Chart Setup
Plotted Elements:
Bullish Labels: Appear at the candle’s high with a green background, white text, and a downward-pointing arrow (e.g., "Hammer").
Bearish Labels: Appear at the candle’s low with a red background, white text, and an upward-pointing arrow (e.g., "Hanging Man").
Chart Setup: The indicator is configured as an overlay (overlay=true), meaning it integrates seamlessly with the price chart. Labels are displayed directly on the candlesticks, eliminating the need for a separate pane and keeping the focus on price action.
Usage Example
To use "Malama's Candle Sniper":
Add the indicator to your TradingView chart via the Indicators menu.
Observe the price chart for green (bullish) or red (bearish) labels as they appear.
Analyze the context of each pattern (e.g., trend direction, support/resistance levels) to decide on potential trades.
Apply your own entry, exit, and risk management rules based on the signals.
For instance, spotting a "Morning Star" label during a downtrend near a support level might prompt a trader to consider a long position, while a "Dark Cloud Cover" at resistance could signal a short opportunity.

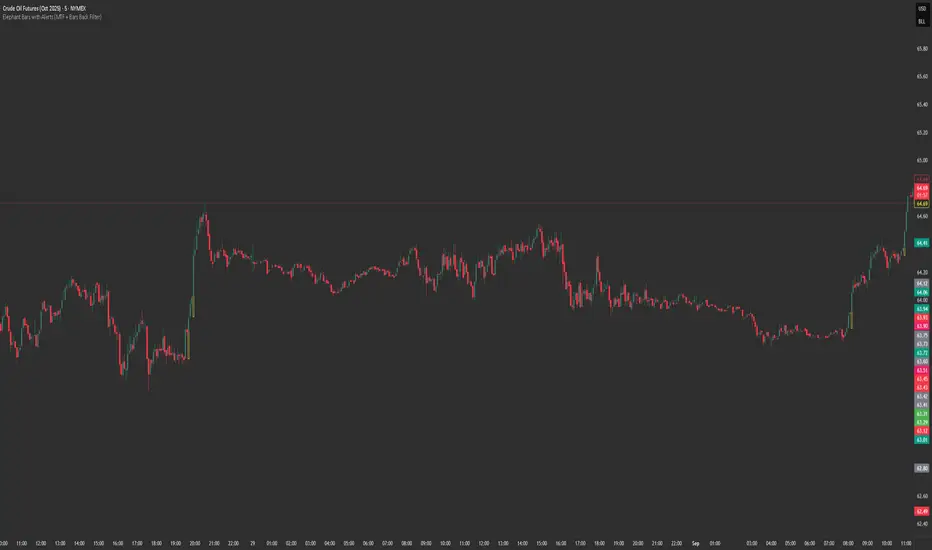
Fair Value Gap (FVG) UnderlayBy analyzing the size and characteristics of candlestick patterns, the Fair Value Gap indicator helps traders spot potential opportunities where the price of a currency or financial asset deviates from its fair value. The FVG is represented as a percentage and displayed as columns in an underlay on the chart.
Calculation and Interpretation:
The calculation of the FVG involves evaluating the body-to-wick ratio of a candlestick. This ratio compares the size of the body (the difference between the open and close prices) to the length of the wicks (the high and low prices). A high body-to-wick ratio indicates a significant price move within the candlestick, potentially signaling a strong market sentiment. The FVG indicator compares the size of the current candlestick with the previous candlesticks over a specified lookback period, typically the last 20 to 40 candlesticks. If the current candlestick meets the criteria for a fair value gap, it is classified as either a Bearish FVG or Bullish FVG, depending on the direction of the price movement.
Interpreting the FVG is relatively straightforward. When a Bearish FVG is detected, it suggests that the price is currently lower than its fair value, indicating a potential upward price movement in the future. This could be an opportunity to consider long positions or buying opportunities. On the other hand, when a Bullish FVG is identified, it implies that the price is higher than its fair value, signaling a possible downward price correction. Traders may consider short-selling or taking profits on long positions in such scenarios.
Coloration:
The coloration of the Fair Value Gap (FVG) indicator plays a crucial role in enhancing its visual representation and aiding interpretation. When a Bearish FVG is identified, the indicator utilizes the color scheme of lime green. This color signifies the potential for an upward price movement as the current price is considered lower than its fair value. On the other hand, a Bullish FVG is represented by the vibrant color of fuchsia, indicating a potential downward price correction as the price exceeds its fair value. The coloration serves as a visual cue, making it easier for traders to quickly identify and differentiate between different types of fair value gaps on the chart. Additionally, the barcolor is aligned with the respective FVG color, providing a comprehensive view of price inefficiencies and aiding traders in their decision-making process.
Potential Applications/Strategies:
The FVG indicator can be applied in various trading strategies and situations. One possible application is in price reversion strategies. Traders can use the FVG to identify overbought or oversold conditions in the market. When a Bullish FVG occurs, it may indicate an opportunity to consider short-selling or taking profits on long positions. Similarly, a Bearish FVG can suggest a potential buying opportunity, expecting the price to revert back to its fair value.
Another application is in confirming existing trends. The FVG can act as a confirmation tool for trends identified by other indicators or analysis techniques. When a Bullish FVG aligns with an uptrend, it may strengthen the bullish bias and provide more confidence in the upward momentum. Conversely, a Bearish FVG in conjunction with a downtrend may reinforce the bearish sentiment and support the idea of further downside potential.
Parameters:
Adjusting the parameters of the FVG indicator can be beneficial based on the trader's trading style and time frame. The body-to-wick ratio threshold and lookback period can be modified to capture different types of fair value gaps and adapt to different market conditions. Shorter lookback periods may help identify more recent FVGs, which could be suitable for short-term traders, while longer periods may capture larger price inefficiencies and cater to longer-term traders.
Limitations:
However, it's important to note that the FVG indicator, like any technical analysis tool, has its limitations. It relies on historical price patterns and may not always accurately predict future price movements. The interpretation of FVGs requires careful analysis and should be used in conjunction with other indicators, technical analysis tools, and fundamental factors to make well-informed trading decisions. Traders should also exercise proper risk management and consider the overall market context when using the FVG indicator.
In conclusion, the Fair Value Gap (FVG) indicator provides traders with valuable insights into price inefficiencies and deviations from fair value. By identifying Bearish and Bullish FVGs, traders can potentially uncover trading opportunities and make more informed decisions. However, it is crucial to combine the FVG indicator with other analysis tools, conduct thorough analysis, and exercise proper risk management to achieve consistent trading success.

Piercing Line Pattern Trading Setupthis study is the first one of a series of scripts based on the candlesticks pattern which will be published over time. There are several such scripts out there that can be found on TradingView but they seem to be inaccurate with a lot of noises and messy hard to understand code. In this script, I've tried to have a clean and easy to get
of the pattern itself and the method for detecting it with enough parameters to filter out the noises.
Piercing Pattern
A piercing pattern is a technical trading signal that is formed by a closing down day with a good-sized trading range, followed by a trading gap lower the following day with a bullish candlestick that covers at least half of the upward length of the previous day's bearish candlestick body, finishing with a close higher for the day. A piercing pattern often signals the end of a small to moderate downward trend. A piercing pattern can serve as a potential indicator for a bullish reversal. This pattern is formed by two consecutive candlestick marks. The first candlestick is bearish signifying a down day and the second is bullish signifying an up day. When a trader is watching for a bullish reversal any red candlestick followed by a green candlestick could be an alert. There are a few things that set a piercing pattern apart from a general red candlestick green candlestick pattern. In a piercing pattern, a green candlestick follows a red one with a significant gap in the red candlestick close and green candlestick open. On the second-day green candlestick, the candlestick’s body must also lengthen to cover at least half of the previous day’s red candlestick . Generally, the gap down and substantial increase to the closing price are good signs for a reversal. In a piercing pattern, the second-day green candlestick will close at or above the midpoint of the previous day’s red candlestick.
please provide me with your valuable comments,
thanks for your attention,

缠中禅V6Pro"ChanLun" is a highly regarded technical analysis method originating in China. Since its introduction in 2006, ChanLun has quickly gained significant attention and a strong following in the Chinese trading community due to its remarkable ability to navigate complex market dynamics.
ChanLun places great emphasis on market structure, price action, momentum, and the intricate interactions between market forces. It recognizes that the market operates in cyclical patterns and aims to capture the underlying structure and rhythm of price movements. Through detailed analysis of the intricate relationship between price and time, it provides traders with a unique perspective on market trends, potential reversals, and key turning points.
🟠 Algorithm
🔵 Step 1: Candlestick Conversion
In ChanLun, candlestick analysis pays less attention to the opening/closing prices and wicks, focusing instead on the range that the stock price reaches. Therefore, the first step in ChanLun involves converting each candlestick to include only the high and low prices, ignoring other elements.
🔵 Step 2: Candlestick Standardization
In the second step, the converted candlesticks are standardized to ensure strict directional consistency and to eliminate the presence of inner or outer bars. For any two adjacent candlesticks A and B, if one price range completely contains the other, A and B are merged into a new candlestick C. If A is in an uptrend from the previous candlestick, C is defined as High(C) = max(High(A), High(B)) and Low(C) = max(Low(A), Low(B)). If A is in a downtrend from the previous candlestick, C is defined as High(C) = min(High(A), High(B)) and Low(C) = min(Low(A), Low(B)).
After completing these steps, when considering any adjacent candlesticks A and B, we can always observe one of the following conditions:
1. High(A) > High(B) and Low(A) > Low(B)
2. High(A) < High(B) and Low(A) < Low(B)
The diagram below illustrates how the candlesticks are displayed after this step.
🔵 Step 3: Fractals
A "fractal" refers to a pattern formed by three consecutive "normalized" candlesticks, where the middle candlestick shows significantly higher or lower values compared to the surrounding candlesticks. When considering three adjacent candlesticks A, B, and C, we have one of two conditions:
1. High (B) > High (A) and High (B) > High (C) and Low (B) > Low (A) and Low (B) > Low (C)
2。 High (B) < Low (A) and High (B) < Low (C) and Low (B) < Low (A) and Low (B) < Low (C) For
In #1 above, we refer to the combination of A, B, and C as the "top fractal", while for #2 we specify it as the "bottom fractal".
The image below illustrates all fractals, with the red triangle indicating the top fractal and the green triangle indicating the bottom splitting.
🔵 Step 4: Strokes
A "stroke" is a line that connects the top fractal and the bottom fractal, following these rules:
1. There must be at least one "free" candlestick between these fractals, which means it is not part of the top or bottom split. This guarantees that the stroke contains at least five candlesticks from start to finish.
2. The top fractal must have a higher price compared to the bottom fractal.
3. The end fractal should represent the highest or lowest point within the entire stroke range. (There is an option in this indicator to enable or disable this rule.)
Brushstrokes enable traders to identify and visualize significant price movements or trends while effectively filtering out minor fluctuations.
🔵 Step 5: Segmentation
A "subdivision" is a higher-level line that connects the start and end points of at least three consecutive strokes, reflecting the trend of the current market structure. As new strokes emerge, it continues to extend until there is a break in the market structure. A breakout occurs when an uptrend forms lower highs and lower lows, or when a downtrend forms higher highs and higher lows. It is important to note that within the trading range, the brushstrokes typically exhibit higher highs and lower lows or higher lows and lower highs patterns (similar to the inner and outer bars). In this case, the brushstrokes will merge in a similar manner to the candlesticks described earlier until there is a clear breakout in the market structure. Contrary to brushstrokes, segments provide a relatively stable depiction of market trends on higher time frames.
It is important to note that the algorithm used to calculate line segments from strokes can again be applied recursively to the generated line segments, forming higher-level line segments that represent market trends over a larger time frame.
🔵 Step 6: Pivot
In ChanLun, the term "pivot" does not represent a price reversal point. Instead, it refers to a trading range where the security's price tends to fluctuate. Within a given "Segment," a pivot is determined by the overlap of two consecutive strokes moving in opposite directions along the segment. When two downward trend strokes, A and B, form a pivot P within an upward trend segment S, the upper and lower boundaries of the pivot are defined as follows:
1. Upper limit (P) = min(high(A), high(B))
2. Lower limit (P) = max(low(A), low(B))
The pivot range is usually where consolidation and high trading volume occur.
If future strokes moving in the opposite direction along the current segment overlap with the upper and lower boundaries of the pivot, those strokes will merge into the existing pivot, extending it along the x-axis. A new pivot is formed when two consecutive strokes moving in the opposite direction along the current segment intersect each other without overlapping the previous pivot.
Similarly, pivots can be recursively identified in higher-level segments. The blue boxes below indicate "Segment Pivots" identified in the context of higher-level segments.
🔵 Step 7: Buy/Sell Points
ChanLun defines three types of buy/sell points.
1. Type 1 Buy and Sell Points: Also called trend reversal points. These points mark where an old segment ends and a new segment begins.
2. Type 2 Buy and Sell Points: Also called trend continuation points. These points occur when the price is in a trend, indicating trend continuation. In an uptrend, Type 2 buy points are rebound points after the price retraces to previous lows or support levels, signaling a likely continuation of the upward movement. In a downtrend, Type 2 sell points are pullback points after the price bounces to previous highs or resistance levels, signaling a likely continuation of the downward movement.
3. Type 3 Buy and Sell Points: These points represent retests of a pivot range breakout. The presence of these retest points indicates that the price may continue to move up/down above/below the pivot level.
Astute readers may notice that these buy/sell points are lagging indicators. For example, multiple candlesticks will have occurred by the time a new segment is confirmed at a Type 1 buy/sell point in that segment. In fact, buy/sell points do lag behind actual market movements. However, ChanLun addresses this issue through multi-timeframe analysis. By examining buy/sell points confirmed in lower timeframes, additional confidence can be gained in determining the overall trend of higher timeframes.
🔵 Step 8: Divergence
Another core technique in ChanLun is using divergence to predict the occurrence of Type 1 buy/sell points. While MACD is the most commonly used indicator for detecting divergence, other indicators like RSI can also serve this purpose.
🟠 Summary
Essentially, ChanLun is a powerful technical analysis method that combines careful examination and interpretation of price charts, the application of technical indicators and quantitative tools, and keen attention to multiple timeframes. Its goal is to identify current market trends and uncover potential trading opportunities. What sets ChanLun apart is its holistic approach, which integrates both qualitative and quantitative analysis to facilitate informed and successful trading decisions.
“缠论”是一种起源于中国的备受推崇的技术分析方法。自 2006 年推出以来,ChanLun 凭借其驾驭复杂市场动态的非凡能力,迅速在中国交易社区中获得了极大的关注和强大的追随者。
ChanLun 非常重视市场结构、价格行为、动量以及市场力量之间错综复杂的相互作用。它认识到市场以周期性模式运作,旨在捕捉价格变动的底层结构和节奏。通过对价格和时间之间错综复杂的关系的细致分析,它为交易者提供了关于市场趋势、潜在逆转和关键转折点的独特视角。
该指标提供了 ChanLun 理论的细致而全面的实施。它有助于对所有基本组成部分进行深入分析和可视化表示,包括 “Candlestick Conversion”, “Candlestick Standardization”, “Fractal”, “Stroke”, “Segment”, “Pivot” 和 “Buying/Selling Point”。
🟠 算法
🔵 1 步:烛台转换
在 ChanLun 中,烛台分析较少关注开盘价/收盘价和灯芯,而是强调股价达到的价格范围。因此,ChanLun 的第一步涉及将每根烛条转换为仅包含最高价和最低价,而忽略其他元素。
🔵 第 2 步:烛台标准化
在第二步中,对转换后的烛台进行标准化,以确保严格的方向一致性,并消除内柱线或外柱线的存在。对于任何相邻的两根烛条 A 和 B,其中一根的价格范围完全包含另一根,A 和 B 被合并为新的烛条 C。如果 A 从前一根蜡烛开始呈上升趋势,则 C 将被定义为最高价 (C) = 最大值(最高价 (A), 最高价 (B)) 和最低价 (C) = 最大值(最低价 (A), 最低价 (B))。如果 A 从前一根蜡烛开始呈下降趋势,则 C 将被定义为最高价 (C) = min(最高价 (A), 最高价 (B)) 和最低价 (C) = min(最低价 (A), 最低价 (B))。
完成这些步骤后,在考虑任何相邻的烛条 A 和 B 时,我们始终可以观察到以下任一条件:
1. 最高价 (A) > 最高价 (B) 和最低价 (A) >最低价 (B)
2。最高价 (A) <最高价 (B) 和最低价 (A) <最低价 (B)
下图说明了此步骤后烛台的显示方式。
🔵 第 3 步:分形
“分形”是指由三个连续的“标准化”烛台形成的形态,其中中间的烛台与周围的烛台相比显示出明显的更高或更低的值。当考虑三个相邻的烛台 A、B 和 C 时,我们有以下两个条件之一:
1. 最高价 (B) > 最高价 (A) 和高点 (B) >最高价 (C) 和最低价 (B) >最低价 (A) 和最低价 (B) >最低价 (C)
2。高 (B) < 低 (A) 和高 (B) < 低 (C) 和低 (B) < 低 (A) 和低 (B) < 低 (C)对于
上面的 #1,我们将 A、B 和 C 的组合称为“顶部分形”,而对于 #2,我们将其指定为“底部分形”。
下图说明了所有分形,其中红色三角形表示顶部分形,绿色三角形表示底部分形。
🔵 第 4 步:笔画
“笔画” 是连接顶部分形和底部分形的一条线,遵循以下规则:
1. 在这些分形之间必须至少有一个 “自由” 烛台,这意味着它不是顶部或底部分形的一部分。这保证了笔画从头到尾至少包含五根烛条。
2. 与底部分形相比,顶部分形必须具有更高的价格。
3. 端点分形应表示整个笔画范围内的最高点或最低点。(此指示器中有一个选项用于启用或禁用此规则。
笔触使交易者能够识别和可视化重大的价格波动或趋势,同时有效地过滤掉微小的波动。
🔵 第 5 步:细分
“细分”是一条更高级别的线,连接至少连续三个笔画的起点和终点,反映了当前市场结构的趋势。随着新笔触的出现,它继续延伸,直到市场结构出现中断。当上升趋势形成较低的高点和较低的低点,或者当下降趋势形成更高的高点和更高的低点时,就会发生突破。值得注意的是,在交易区间内,笔触通常表现出更高的高点和更低的低点或更高的低点和更低的高点形态(类似于内柱和外柱)。在这种情况下,笔触将以与前面描述的烛台类似的方式合并,直到市场结构出现明显的突破。与笔触相反,分段在更高的时间范围内提供了对市场趋势的相对稳定的描述。
需要注意的是,用于从笔画计算线段的算法可以再次递归地应用于生成的线段,形成更高级别的线段,代表更大时间范围内的市场趋势。
🔵 第 6 步:枢轴
在 ChanLun 中,“枢轴”一词并不表示价格反转点。相反,它代表证券价格趋于波动的交易区间。在给定的 “Segment” 中,枢轴由沿线段相反方向移动的两个连续笔画的重叠决定。当两个下降趋势笔触 A 和 B 在上升趋势段 S 内形成枢轴 P 时,枢轴的上限和下限定义如下:
1. 上限 (P) = min(最高 (A), 最高 (
pein:
B)
2. 下限 (P) = 最大值(最低 (A), 最低 (B))
枢轴范围通常是发生盘整和交易量高的地方。
如果沿当前线段的相反方向移动的未来笔触与枢轴的上限和下限重叠,则该笔划将合并到现有枢轴中,并沿 x 轴延伸枢轴。当沿当前线段的相反方向移动的两个连续笔触彼此相交而不与前一个轴重叠时,将形成新的枢轴。
同样,也可以在更高级别的 segment 中递归识别 pivots。下面的蓝色框表示在更高级别区段的上下文中标识的“Segment Pivots”。
🔵 第 7 步:购买/出售积分
ChanLun 中定义了三种类型的购买/出售积分。
1. 类型 1 买入和卖出点:也称为趋势反转点。这些点是旧路段终止和生成新路段的位置。
2. 类型 2 买入和卖出点:也称为趋势延续点。这些点发生在价格处于趋势中时,标志着趋势的延续。在上升趋势中,类型 2 买点是价格回撤至先前低点或支撑位后的反弹点,表明价格可能会继续上涨。在下跌趋势中,类型 2 卖点是价格反弹至前高点或阻力位后的回调点,表明价格可能会继续下跌。
3. 类型 3 买入和卖出点:这些点表示对枢轴范围突破的重新测试。这些重新测试点的存在表明,价格有可能在枢轴水平上方/下方继续向上/向下移动。
挑剔的读者可能会注意到这些买入/卖出点是滞后指标。例如,当确认新区段时,自该区段的类型 1 买入/卖出点以来已经发生了多根烛台。
事实上,买入/卖出点确实落后于实际市场走势。然而,ChanLun 通过使用多时间框架分析解决了这个问题。通过检查较低时间框架中确认的买入/卖出点,可以在确定较高时间框架的整体趋势方面获得额外的信心。
🔵 第 8 步:背离
ChanLun 的另一个核心技术是应用背离来预测 1 型买入/卖出点的出现。虽然 MACD 是检测背离最常用的指标,但 RSI 等其他指标也可用于此目的。
🟠 总结
从本质上讲,ChanLun 是一种强大的技术分析方法,它结合了对价格图表的仔细检查和解释、技术指标和定量工具的应用以及对多个时间框架的敏锐关注。其目标是确定当前的市场趋势并发现潜在的交易前景。ChanLun 的与众不同之处在于其整体方法,该方法融合了定性和定量分析,以促进明智和成功的交易决策。

Chan Theory - Chanlun UltraChan Theory -Chanlun Ultra
Overview
This script is based on the core technical framework of Chan Theory, transforming complex market fluctuations into a multi-layered, quantifiable structural analysis system. Through real-time dynamic computation, it automatically parses key components in price movements such as fractals, pens, segments, and pivot zones. Integrated with momentum analysis and trading signal alerts, it provides traders with comprehensive market insights from micro to macro perspectives. The core distinction of Chan Theory from traditional technical indicators lies in its rigorous recursive logic and human-centric market philosophy. This script faithfully restores Chan Theory's essence of "using Zen to resolve market complexity," decomposing spiral price movements into an orderly trading decision system.
Technical Principles
This indicator implements the complete recognition process from candlesticks to fractals, pens, segments, and pivot zones using pure Pine Script under Chan Theory's framework. Core technical implementations include:
1. Candlestick Containment Processing
Employs specific algorithms to handle candlestick containment relationships, eliminating random noise:
In uptrends: Select the higher high and higher low values
In downtrends: Select the lower high and lower low values
Ensure complete elimination of containment through recursive processing
2. Fractal Identification System
Performs strict fractal judgment on processed candlesticks:
Top Fractal: The middle candlestick's high is higher than both adjacent candlesticks
Bottom Fractal: The middle candlestick's low is lower than both adjacent candlesticks
Validate fractal effectiveness via the filterOperateType function
3. Pen Construction Mechanism & Type Selection
Connects valid top/bottom fractals to form pen structures, offering four pen types:
Classic Pen: Traditional Chan Theory definition, strictly following classic rules
Optimized Pen: Enhanced algorithm for short-term volatility recognition
4K Pen: Builds pens based on fractals formed by at least 4 candlesticks (improves stability)
Strict Pen: Employs the most stringent validation conditions for reliability
4. Segment Partitioning Algorithm
Applies segment rules to pen sequences with three modes:
- Dynamic Real-time Progressive Correction: Adjusts forming segments continuously with new data
- Strict Mode: Fully complies with Chan Theory definitions
- Extension Mode: Flexible handling of trend developments
5. Pivot Zone Recognition Technology
Identifies pen-level and segment-level pivot zones
Calculates pivot zone price ranges and time durations
Analyzes pivot zone evolution characteristics
Supports display of pivot zones across different levels
Trading Signal System & Filters
Trading Signal Filtering System
This indicator provides comprehensive filtering functions:
Fractal Validity Filter: Verifies fractal patterns and post-fractal developments
Basic Fractal Filter: Eliminates non-compliant fractals through basic feature checks
Type I MACD Divergence Filter: Enhances Type I signal reliability via MACD divergence analysis
Type II Signal Filter: Custom conditions for Type II signals
-False Signal Trap Avoidance: Detects and bypasses deceptive price patterns
Chan Theory Trading Signal Principles
Type I Signals (Trend Reversals)
Principle: Forms when price makes new highs/lows with weakening internal momentum (divergence)
Identification: Compares structural features of adjacent same-direction pens
Application: Early trend reversal signals for swing trading
Type II Signals (Pullback Entries)
Principle: Occurs during retracements as sub-level reversal signals
Identification: Determined by pivot zone support/resistance and fractal combinations
Application: Optimal positions for pullback trades with controlled risk
Type III Signals (Breakout Confirmations)
Principle: Confirms pivot zone breakouts
Identification: Price breaks prior pivot zone boundaries with valid fractals
Application: Trend continuation signals for trend-following strategies
Indicator Features
Multi-Level Structural Analysis
Distinguishes structures across levels via level parameters
Higher-level trends guide lower-level operations
Implements cross-level collaborative logic
Displays sub-level pivot zones
Structural Visualization
Pens: Displayed per selected pen type
Segments: Rendered according to chosen segment mode
Pivot Zones: Color gradients indicate consolidation strength
Technical Implementation
Data Structure Design
Pen Object: Stores direction, timestamps, and price attributes
Segment Object: Manages segments and constituent pens
Pivot Object: Defines pivot zone ranges and characteristics
Grade Object: Organizes analysis results across levels
User Guide
Parameter Settings
Pen Type: Classic/Optimized/4K/Strict (adapt to analysis needs)
Segment Mode: Dynamic/Strict/Extension (match trading strategies)
Signal Filters: Enable/disable specific filters
Pivot Display: Toggle sub-level pivot zones
Divergence Settings: Configure types (regular/hidden) and display styles
Strategy Settings: Set trading rules linked to signals
Strategy Configuration
Follow Segments: Trade in alignment with segment direction
Signal Participation: Enable/disable Type I/II/III signals
Signal Conditions: Require signals to appear post-pivot zone formation
Prevent Early Entries:
Type I signals require ≥1 pivot zone or 5 pens
Type II Safety Control: Participate only if Type III signals are absent
Practical Recommendations
Select pen types/segment modes per market conditions
Adjust filters for different instruments and timeframes
Enhance accuracy through multi-level analysis
Confirm Type I signals with divergence indicators
Choose strategy parameters aligned with risk tolerance
Value Proposition
Systematizes Chan Theory into computable structures
Multiple pen/segment methods adapt to diverse markets
Advanced filtering significantly improves signal quality (historically validated)
Multi-level analysis provides holistic market insights
This tool is for technical analysis only. It does not constitute investment advice. Users must exercise independent judgment based on personal risk tolerance and objectives.
概述
本脚本基于缠论核心技术框架,将复杂的市场波动转化为多层次、可量化的结构分析系统。通过实时动态演算,自动解析价格走势中的分型、笔、线段、中枢等核心组件,并融合动量分析与交易信号预警功能,为交易者提供从微观到宏观的全方位市场透视。缠论区别于传统技术指标的核心在于其严格的递归逻辑与人性化市场哲学,本脚本忠实还原缠论"以禅破缠"的思想精髓,将螺旋缠绕的价格运动分解为有序的交易决策体系。
技术原理
本指标基于缠论技术分析框架,通过纯Pine Script实现了从K线到分型、笔、线段和中枢的完整识别流程。核心技术实现包括:
1. K线包含处理
采用特定算法处理K线包含关系,消除随机波动干扰:
- 上涨趋势中取高点高值、低点高值
- 下跌趋势中取高点低值、低点低值
- 通过递归处理确保包含关系完全消除
2. 分型识别系统
在处理后的K线基础上实现严格的分型判断:
- 顶分型:中间K线高点高于两侧K线
- 底分型:中间K线低点低于两侧K线
- 通过`filterOperateType`函数实现分型有效性验证
3. 笔的构建机制与类型选择
连接有效顶底分型形成笔结构,提供四种笔类型选择:
- **老笔**:传统缠论笔定义,严格遵循经典规则
- **新笔**:优化算法,增强对短期波动的识别能力
- **4K**:基于至少4根K线形成的分型构建笔,提高稳定性
- **严笔**:采用最严格的条件验证,确保形成的笔结构可靠
4. 线段划分算法
基于笔序列应用线段划分规则,支持三种线段模式:
- **当下延伸后修正**:实时计算当前形成中的线段,并随新数据更新修正
- **严格模式**:要求线段完全符合缠论定义,减少假信号
- **延伸模式**:更灵活地处理线段延伸情况,适合趋势分析
5. 中枢识别技术
- 实现笔中枢和线段中枢识别
- 计算中枢价格区间与时间范围
- 分析中枢演变特征
- 支持显示不同级别中枢功能
买卖点系统与过滤机制
买卖点过滤系统
本指标提供全面的买卖点过滤功能:
- **买卖点分型过滤**:检验分型形态有效性,验证分型后续发展
- **买卖点分型基础过滤**:针对分型基本特征进行验证,排除不合格分型
- **1买卖macd背驰过滤**:通过MACD判断背驰情况,提高一类买卖点可靠性
- **2买卖点过滤**:专门针对二类买卖点的过滤条件
- **防狼术**:避免陷阱式买卖点,提高交易安全性
缠论买卖点原理
1. **一类买卖点**
- 原理:基于趋势背驰原理,当价格创新高/低但内部结构力度减弱时形成
- 识别方法:通过比较相邻同向笔的结构特征判断力度变化
- 应用:提供趋势可能反转的早期信号,适合波段操作
2. **二类买卖点**
- 原理:发生在回调过程中,属于次级别转折信号
- 识别方法:通过中枢支撑位与分型组合判断
- 应用:回调买入或做空的较佳位置,风险相对可控
3. **三类买卖点**
- 原理:中枢突破确认信号
- 识别方法:价格突破前中枢边界并形成有效分型
- 应用:趋势延续的确认信号,适合追踪趋势
指标特点
多级别结构分析
本指标支持多级别联动分析:
- 通过级别参数区分不同级别结构
- 高级别趋势指导低级别操作
- 实现级别间的协同判断逻辑
- 支持显示次级别中枢功能
结构可视化
- 笔结构:根据选择的笔类型显示
- 线段结构:按照选定的线段模式呈现
- 中枢区域:颜色渐变标识不同强度
技术实现说明
数据结构设计
指标设计了完整的面向对象结构:
- Pen结构:存储笔的方向、时间、价格等属性
- Segment结构:管理线段及其组成笔
- Pivot结构:表示中枢范围和特性
- Grade结构:区分不同级别的分析结果
使用指南
参数设置
- 笔的类型:选择老笔、新笔、4K或严笔以适应不同分析需求
- 线段模式:根据交易策略选择合适的线段计算方式
- 买卖点过滤:根据需要启用不同的过滤机制
- 中枢显示:选择是否显示次级别中枢
- 背离设置:选择背离类型、显示方式和样式
- 策略设置:配置与买卖点相关的交易策略选项
策略应用配置
- 跟随线段:根据线段方向进行交易
- 买卖点参与设置:可选择性参与一类、二类和三类买卖点
- 买卖点条件限制:可设置买卖点需要在中枢形成后出现
- 防止过早进场:可要求一类买卖点至少出现一个中枢后或至少5笔后才参与
- 二类买卖点安全性控制:可选择仅在未出现三类买卖点的情况下参与
实际应用建议
- 结合市场环境选择合适的笔类型和线段模式
- 针对不同品种和时间周期调整过滤设置
- 通过多级别分析提高判断准确性
- 使用背离指标确认一类买卖点的有效性
- 根据策略风格选择适合的策略配置参数
技术特点与价值
本指标通过系统化实现缠论结构分析,提供了一种客观的技术分析工具。它的核心价值在于:
1. 将复杂的缠论理论系统化为可计算的结构
2. 提供多种笔、线段判断方法以适应不同市场环境
3. 完善的买卖点过滤系统大幅提高信号质量
4. 多级别联动分析提供全面市场视角
*本指标仅提供技术分析参考,不构成投资建议。用户应根据自身风险承受能力和投资目标进行判断。*

ChanLun ProChanLun, also known as Entanglement Theory or "缠论", is a highly regarded technical analysis methodology that originated in China. Since its introduction in 2006, ChanLun has rapidly gained significant attention and a strong following within the Chinese trader community due to its exceptional ability to navigate complex market dynamics.
ChanLun places great emphasis on market structure, price action, momentum, and the intricate interplay between market forces. It recognizes that the market operates in cyclical patterns and aims to capture the underlying structure and rhythm of price movements. Through meticulous analysis of the intricate relationships between price and time, it provides traders with a unique perspective on market trends, potential reversals, and critical turning points.
This indicator offers a meticulous and comprehensive implementation of the ChanLun theory. It facilitates in-depth analysis and visual representation of all essential components, encompassing “Candlestick Conversion”, "Candlestick Standardization", "Fractal", "Stroke", "Segment", "Pivot", and "Buying/Selling Point".
🟠 Algorithm
🔵 Step 1: Candlestick Conversion
In ChanLun, candlestick analysis focuses less on the opening/closing prices and wicks, but rather emphasizes the price range at which the stock price has reached. As a result, the initial step in ChanLun involves converting each candlestick to contain solely the high and low prices, disregarding other elements.
🔵 Step 2: Candlestick Standardization
In the second step, the converted candlesticks are standardized to ensure strict directional consistency and eliminate the presence of inner bars or outer bars. For any adjacent two candlesticks A and B where one’s price range completely encompasses another, A and B are merged into a new candlestick C. If A is trending up from its previous candle, then C will be defined such that high(C) = max(high(A), high(B)) and low(C) = max(low(A), low(B)). If A is trending down from its previous candle, then C will be defined such that high(C) = min(high(A), high(B)) and low(C) = min(low(A), low(B)).
After completing these steps, when considering any adjacent candlesticks A and B, we can always observe either of the following conditions:
1. high(A) > high(B) and low(A) > low(B)
2. high(A) < high(B) and low(A) < low(B)
The chart below illustrates how the candlesticks would appear after this step.
🔵 Step 3: Fractals
A "Fractal" refers to the pattern formed by three consecutive "standardized" candlesticks, where the middle candlestick shows a clear higher or lower value compared to the surrounding candlesticks. When considering three adjacent candlesticks, A, B, and C, we have either of the two conditions:
1. high(B) > high(A) and high(B) > high(C) and low(B) > low(A) and low(B) > low(C)
2. high(B) < low(A) and high(B) < low(C) and low(B) < low(A) and low(B) < low(C)
For #1 above, we refer to the combination of A, B, and C as a “Top Fractal”, whereas for #2 we designate it as a “Bottom Fractal”.
The chart below illustrates all the fractals, with the red triangles indicating the Top Fractals and the green triangles indicating the Bottom Fractals.
🔵 Step 4: Strokes
A “Stroke” is a line connecting a top fractal and a bottom fractal, subject to the following rules:
1. There must be at least one "free" candlestick positioned between these fractals, meaning it is not part of either the top or bottom fractal. This guarantees that a stroke encompasses a minimum range of five candlesticks from beginning to end.
2. The top fractal must have a higher price compared to the bottom fractal.
3. The endpoint fractals should represent the highest or lowest point throughout the entire span of the stroke. (There is an option within this indicator to enable or disable this rule.)
Strokes enable traders to identify and visualize significant price swings or trends while effectively filtering out minor fluctuations.
🔵 Step 5: Segments
A "Segment" is a higher-level line that connects the starting and ending points of at least three consecutive strokes, reflecting the current trend of the market structure. It continues to extend as new strokes emerge, until there is a break in the market structure. The break occurs when an uptrend forms a lower high and lower low, or when a downtrend forms a higher high and higher low. It's worth noting that during trading ranges, it is common for strokes to exhibit a higher high and lower low or a higher low and lower high pattern (similar to inner bars and outer bars). In such cases, the strokes will be merged in a similar manner as described earlier for candlesticks, until there is a distinct break in the market structure. Segments provide a relatively stable depiction of the market trend in a higher timeframe, as opposed to strokes.
It is important to note that the algorithm used to calculate segments from strokes can be recursively applied to the generated segments again, forming higher-level segments that represent the market trend on a even larger timeframe.
🔵 Step 6: Pivots
In ChanLun, the term "Pivot" does not indicate a price reversal point. Instead, it represents a trading range where the price of a security tends to fluctuate. Within a given "Segment," the pivot is determined by the overlap of two consecutive strokes moving in the opposite direction of the segment. When two downtrend strokes A and B form a pivot P within an uptrend segment S, the upper and lower bounds of the pivot are defined as follows:
1. upper(P) = min(high(A), high(B)
2. lower(P) = max(low(A), low(B))
The pivot range is typically where consolidation occurs and where there is a high trading volume.
If a future stroke, moving in the opposite direction of the current segment, overlaps with the upper and lower bounds of the pivot, it is merged into the existing pivot and extends the pivot along the x-axis. A new pivot is formed when two consecutive strokes moving in the opposite direction of the current segment, intersect with each other without overlapping the previous pivot.
Likewise, pivots can also be recursively identified within the higher-level segments. The blue boxes below represent the "Segment Pivots" that are identified within the context of higher-level segments.
🔵 Step 7: Buying/Selling Points
There are three types of buying/selling points defined in ChanLun.
1. Type 1 Buying and Selling Points: Also known as trend reversal points. These points are where the old segments terminate and new segments are generated.
2. Type 2 Buying and Selling Points: Also known as trend continuation points. These points occur while the price is in the midst of a trend and signify the continuation of the trend. In an uptrend, the Type 2 buying point is the rebound point after the price retraces to a previous low or support level, indicating that the price may continue to rise. In a downtrend, the Type 2 selling point is the pullback point after the price rallies to a previous high or resistance level, indicating that the price may continue to decline.
3. Type 3 Buying and Selling Points: These points indicate the retests of breakouts from pivot ranges. The presence of these retest points suggests that the price has the potential to continue its upward/downward movement above/below the pivot levels.
A discerning reader may notice that these buying/selling points are lagging indicators. For example, by the time a new segment is confirmed, multiple candlesticks have already occurred since the type 1 buying/selling point of that segment.
Indeed, it is true that the buying/selling points lag behind the actual market movements. However, ChanLun addresses this issue through the utilization of multi-timeframe analysis. By examining the confirmed buying/selling points in a lower timeframe, one can gather additional confidence in determining the overall trend of the higher timeframe.
🔵 Step 8: Divergence
Another core technique in ChanLun is the application of divergence to anticipate the emergence of type 1 buying/selling points. While MACD is the most commonly employed indicator for detecting divergence, other indicators such as RSI can also be utilized for this purpose.
🟠 Summary
In essence, ChanLun is a robust approach to technical analysis that integrates the careful examination and interpretation of price charts, the application of technical indicators and quantitative tools, and a keen attention to multiple timeframes. Its objective is to identify prevailing market trends and uncover potential trading prospects. What sets ChanLun apart is its holistic methodology, which blends both qualitative and quantitative analysis to facilitate informed and successful trading decisions.
🟠 NOTE
The freely available "ChanLun | AlgoTrader" script, published by the same account, incorporates only a limited set of fundamental concepts from ChanLun.
In contrast, this script is a premium invite-only version that represents a comprehensive implementation of the complete ChanLun methodology, specifically tailored for more experienced and professional traders.
________________________________________________________________________________
该指标严格按照缠论原文实现了包括“K线标准化”、“分型”、“笔”、“线段”、“中枢”和“买卖点”在内的所有关键元素。它旨在为缠友们提供一个准确可靠的缠论实现,以便快速而精准地分析市场,从而获得更优秀的交易业绩。
该指标的主要特点如下:
1. 实时标记所有缠论元素:该指标具备实时识别和标记分型、笔、线段、中枢和买卖点的功能,提供清晰的信号和准确的趋势判断。
2. 多种笔段算法选择:提供三种不同的笔算法(“老笔”、“新笔”和“4K”)以及两种线段算法(“特征序列”和“1+1终结”),满足不同交易者个性化需求,可根据偏好和策略选择最适合的算法。
3. 三级别联立:指标同步计算并显示笔、线段和递归高级段,提供更全面的市场动态分析。
4. 自定义颜色:用户可以根据个人喜好和需求自定义指标的颜色方案,与图表风格和视觉需求完美匹配。
5. 完美实现K线回放功能:指标充分利用了K线回放功能,让交易者能够回顾和分析历史市场数据,提高对市场趋势的研究和理解,增强市场洞察力和决策能力。

RF+ Replay for Heikin AshiRF+ Replay for Heikin Ashi
RF+ Replay for Heikin Ashi generates fully customisable Heikin Ashi candlesticks presented on a standard chart, enabling traders to utilise the Tradingview Replay feature with Heikin Ashi candlesticks when analysing and backtesting HA style strategies.
The features of this indicator include:
- Fully customisable Heikin Ashi Candles, including custom colour options for candle bodies, borders and wicks.
- Optional real-time, real-price close dots painted onto each candlestick.
- A optional set of 2 x Range Filters designed to indicate short term trend identification upon color change, ideal for low timeframe scalping.
- A optional set of 3 x fully customisable Moving Averages.
- An option to enable Heikin Ashi calculated data for the Range Filters and Moving Averages, so they present as they would on a Heikin Ashi non-standard chart type, without having to use an actual Heikin Ashi chart. Enabled by default.
- An optional sessions indicator, to highlight your prefered trading session for the purpose of backtesting.
- An optional watermark featuring customisable text and well as symbol and timeframe information, as seen in the screenshot of this indicator.
Instructions for use:
1) Because this indicator generates candlesticks and presents them onto your chart, you will need to hide the existing candlesticks so you do not see two sets of candles. You can do this by going into your Tradingview chart settings and making the candle bodies, borders and wicks fully transparent. You can then save this as a layout template. You can access your Chart Settings by clicking on the cog icon, or by right clicking on the chart itself and selecting 'Chart Settings' from the list.
2) Ensure you have the standard chart type selected - you do not need to select a Heikin Ashi type chart.
3) You will now be able to analyise and even backtest your Heikin Ashi style strategies including the use of the Tradingview Replay feature found at the top of the chart.
Heikin Ashi means 'average bar' in Japanese, which speaks to the fact that Heikin Ashi candles are calculated differently to standard Japanese candlesticks. The general idea of Heikin Ashi candles is to 'smooth' the appearance of price movement, by the use of averages within their calculation. It is important to understand that the Open and Close values of a Heikin Ashi candlestick do not reflect real Open and Close prices. You can use the real price dots feature to clearly see the real time and real price Close of each candle.
The formula for calculating a Heikin Ashi candlestick is as follows:
High = Maximum of High, Open, or Close (whichever is highest)
Low = Minimum of Low, Open, or Close (whichever is lowest)
Open = Open (previous bar) + Close (previous bar) /2
Close = (Open + High + Low + Close) / 4
If you found this useful, be sure to leave a like, comment and subscribe to show your support.
Until next time.

MTFT Patterns Noob, TheStrat Suite (1of5)Multi Time Frame Tools
Multi Time Frame Tools (MTFT) is a suite of scripts aimed to establish a standard timeframe-based color scheme. This can be utilized to overlay different timeframes calculations/values over a single timeframe. As one example, this would allow to observe the 5-month moving average, 5-week moving average, and 5-day moving average overlaid over each other. This would allow to study a chart, get accustomed to the color scheme and study all these at the same time much easier.
All indicators calculated using the below specific timeframes as input, will always use the color scheme outlined below. This is to get you in habit of recognizing the different timeframes overlaid in top of each other. These can be personalized.
Longer TF analysis.
Yearly - Black
Semi-Annual - Yellow
Quarterly - White
Monthly - Maroon
Weekly - Royal Blue
Daily - Lime
Shorter TF analysis.
4 hour - Fuchsia
1 hour - Orange
30 min - Red
15 min - Brown
10 min - Purple
5 min - Lilac
All color coordination is able to be modified in either the “Inputs” or “Style” section. If you need to make changes, make sure to select “Save as Default” on the bottom right of the settings menu.
Recommended Chart Color Layout
I played around with color coordination a lot. The final product was what worked best for me. I personally use the following chart settings to accent all available TF colors.
-> Click on the settings wheel on your chart. -> Click on “Appearance”.
Background - Solid -> On the top row pick the 6th color from the left.
Vert Grid Lines and Horz Grid Lines -> On the top row pick the 7th color from the left.
You may of course change these and the indicator line colors as you like.
Adding indicator to Chart
-> Open the TradingView “Indicators & Strategies” library, the icon has “ƒx”. -> All premium scripts will be located under “Invite-Only Scripts” -> Click indicator to add to your chart.
MTFT TheStrat Suite (5 Scripts)
Rob Smith is the creator of ‘TheStrat’ trading strategy. For ‘TheStrat’ I have put together a suite of 5 premium scripts that combined will offer people interested in learning ‘TheStrat’ a cleaner learning process. For 2 of the 5 scripts specifically, the MTFT approach of overlaying multiple longer timeframes(TF) over a shorter TF selected as a display cannot be utilized. The other 2 scripts will have full MTFT functionality and they are my personal favorite. I will be providing very basic info to utilize this script; it is up to you to dive deep into learning this strategy. I am not an expert with the tool or a financial advisor. As with all aspects of life, I recommend you research, learn, discern and practice extensively in order to become a master.
*1. MTFT Patterns Pro/Noob
2. MTFT Full Time Frame Continuity Table
3. MTFT Last HML wOpen
4. MTFT Actionable Signal Targets
5. MTFT Reversal Lines
MTFT Patterns Pro/Noob, TheStrat Suite (1of5)
Features includes:
1.) Absolute Truth #. This setting will provide the candlesticks absolute truth # below the CS.
2.) Color bars based on Absolute Truth. This setting will color all inside candlesticks yellow, all Green Outside Candlesticks White and all Red Outside Candlesticks Fuchsia. Scenario 2 candlesticks are left as is and will color based on the color of the original candlestick. This setting is default enabled and needs to be disabled in the “Style” tab under the indicator settings wheel. I found this more practical in getting used to the 3 absolute truth scenarios.
3.) Reversals. This setting will mark when reversal patterns as discussed by Rob are posted. Noob version will also include the description of the reversal pattern, while the Pro version will only plot an ‘R’ without the text description. Note: There should never be back-to-back green Rs or red Rs. I found this issue a lot on many of the other ‘TheStrat’ scripts out there. TradingView development team note: The plotchar function does not allow dynamic text so this is the only reason on why there needs to be two separate versions of the script. ‘Pro’ is important for experienced users that already identify the patterns without the text and ‘Noob’ is important for beginner users that still need the text description of the pattern.
4. Continuations. This setting will mark when continuation patterns as discussed by Rob are posted. Noob version will also include the description of the continuation pattern, while the Pro version will only plot a ‘C’ without the text description.
TradingView Admin note: The plotchar function does not allow dynamic text so this is the only reason why there needs to be two separate versions of the script. ‘Pro’ is important for experienced users that already identify the patterns without the text and ‘Noob’ is important for beginner users that still need the text description of the pattern.
5. Actionable Signals and Complex Actionable Signals (CAS). This has several objective parameters as defined by Rob’s course. ‘Complex Actionable Signals’ is a name I used when speaking of actionable signals that require a combination of 2 or more candlesticks.
Actionable Signals.
• All inside candlesticks(Absolute Truth #1)
• Hammers
• Shooting Stars
Complex Actionable Signals.
• (Absolute Truth Combo 1-3-1 )Inside Outside Inside
• Outside -> Hammer
• Outside -> Shooting Star
• Inside -> Hammer
• Inside -> Shooting Star
• Momentum Inside
• Momentum Hammer
• Momentum Shooting Star
• Hammer -> Shooting Star
• Shooting Star -> Hammer
5a. Example CAS 1-3G-1. I am including only one example of several of the CAS that are included in this script. The star is utilized for all CAS, the color and location designate the direction that the CAS would have you act on. Note the “Entry” and “Target” line were added manually and are not part of the script. This is one successful setup; don’t get excited thinking this is how it always works. I will let you discover and learn for yourself that there is many failed setups and many setups that never trigger the actionable signal. This is where setting alerts is very handy.
6. Alerts. Press on the “Create Alert” Icon for TradingView. When the prompt opens select the preferred script either “TheStrat Pro” or “TheStrat Noob” under “Condition” and then under the sub-menu select any of the following scenarios.
• C ▲/ ▼ = If the active CS shows a continuation up/down pattern, remember this CS is active and can still change direction and trigger a reversal in the other direction.
• R ▲/▼ = If the active CS shows a reversal up/down pattern, remember this CS is active and can still change direction and trigger a continuation in the previous trend direction.
• HM Trigger(Last High Cross) = Alert when the active CS breaks the high of the previous CS. As a new CS opens, it re-adjusts its values and is just constantly waiting for the active CS break through the previous CS high.
• SS Trigger(Last Low Cross) = Alert when the active CS breaks the low of the previous CS. As a new CS opens, it re-adjusts its values and is just constantly waiting for the active CS break through the previous CS low.
• Inside Trigger (Last High/Low Cross) = Alert when the active CS breaks the low or the high of the previous CS. As a new CS opens, it re-adjusts its values and is just constantly waiting for the active CS break through either the previous CS low or the high.
• Last CS Inside
• Last CS H
• Last CS S
• Last CS Actionable Signal (inside, H or S)
• Last CS Complex Actionable Signal
• Last CS Any Actionable Signal

MTFT Patterns Pro, TheStrat Suite (1of5)Multi Time Frame Tools
Multi Time Frame Tools (MTFT) is a suite of scripts aimed to establish a standard timeframe-based color scheme. This can be utilized to overlay different timeframes calculations/values over a single timeframe. As one example, this would allow to observe the 5-month moving average, 5-week moving average, and 5-day moving average overlaid over each other. This would allow to study a chart, get accustomed to the color scheme and study all these at the same time much easier.
All indicators calculated using the below specific timeframes as input, will always use the color scheme outlined below. This is to get you in habit of recognizing the different timeframes overlaid in top of each other. These can be personalized.
Longer TF analysis.
Yearly - Black
Semi-Annual - Yellow
Quarterly - White
Monthly - Maroon
Weekly - Royal Blue
Daily - Lime
Shorter TF analysis.
4 hour - Fuchsia
1 hour - Orange
30 min - Red
15 min - Brown
10 min - Purple
5 min - Lilac
All color coordination is able to be modified in either the “Inputs” or “Style” section. If you need to make changes, make sure to select “Save as Default” on the bottom right of the settings menu.
Recommended Chart Color Layout
I played around with color coordination a lot. The final product was what worked best for me. I personally use the following chart settings to accent all available TF colors.
-> Click on the settings wheel on your chart. -> Click on “Appearance”.
Background - Solid -> On the top row pick the 6th color from the left.
Vert Grid Lines and Horz Grid Lines -> On the top row pick the 7th color from the left.
You may of course change these and the indicator line colors as you like.
Adding indicator to Chart
-> Open the TradingView “Indicators & Strategies” library, the icon has “ƒx”. -> All premium scripts will be located under “Invite-Only Scripts” -> Click indicator to add to your chart.
MTFT TheStrat Suite (5 Scripts)
Rob Smith is the creator of ‘TheStrat’ trading strategy. For ‘TheStrat’ I have put together a suite of 5 premium scripts that combined will offer people interested in learning ‘TheStrat’ a cleaner learning process. For 2 of the 5 scripts specifically, the MTFT approach of overlaying multiple longer timeframes(TF) over a shorter TF selected as a display cannot be utilized. The other 2 scripts will have full MTFT functionality and they are my personal favorite. I will be providing very basic info to utilize this script; it is up to you to dive deep into learning this strategy. I am not an expert with the tool or a financial advisor. As with all aspects of life, I recommend you research, learn, discern and practice extensively in order to become a master.
*1. MTFT Patterns Pro/Noob
2. MTFT Full Time Frame Continuity Table
3. MTFT Last HML wOpen
4. MTFT Actionable Signal Targets
5. MTFT Reversal Lines
MTFT Patterns Pro/Noob, TheStrat Suite (1of5)
Features includes:
1.) Absolute Truth #. This setting will provide the candlesticks absolute truth # below the CS.
2.) Color bars based on Absolute Truth. This setting will color all inside candlesticks yellow, all Green Outside Candlesticks White and all Red Outside Candlesticks Fuchsia. Scenario 2 candlesticks are left as is and will color based on the color of the original candlestick. This setting is default enabled and needs to be disabled in the “Style” tab under the indicator settings wheel. I found this more practical in getting used to the 3 absolute truth scenarios.
3.) Reversals. This setting will mark when reversal patterns as discussed by Rob are posted. Noob version will also include the description of the reversal pattern, while the Pro version will only plot an ‘R’ without the text description. Note: There should never be back-to-back green Rs or red Rs. I found this issue a lot on many of the other ‘TheStrat’ scripts out there. TradingView development team note: The plotchar function does not allow dynamic text so this is the only reason on why there needs to be two separate versions of the script. ‘Pro’ is important for experienced users that already identify the patterns without the text and ‘Noob’ is important for beginner users that still need the text description of the pattern.
4. Continuations. This setting will mark when continuation patterns as discussed by Rob are posted. Noob version will also include the description of the continuation pattern, while the Pro version will only plot a ‘C’ without the text description.
TradingView Admin note: The plotchar function does not allow dynamic text so this is the only reason why there needs to be two separate versions of the script. ‘Pro’ is important for experienced users that already identify the patterns without the text and ‘Noob’ is important for beginner users that still need the text description of the pattern.
5. Actionable Signals and Complex Actionable Signals (CAS). This has several objective parameters as defined by Rob’s course. ‘Complex Actionable Signals’ is a name I used when speaking of actionable signals that require a combination of 2 or more candlesticks.
Actionable Signals.
• All inside candlesticks(Absolute Truth #1)
• Hammers
• Shooting Stars
Complex Actionable Signals.
• (Absolute Truth Combo 1-3-1 )Inside Outside Inside
• Outside -> Hammer
• Outside -> Shooting Star
• Inside -> Hammer
• Inside -> Shooting Star
• Momentum Inside
• Momentum Hammer
• Momentum Shooting Star
• Hammer -> Shooting Star
• Shooting Star -> Hammer
5a. Example CAS 1-3G-1. I am including only one example of several of the CAS that are included in this script. The star is utilized for all CAS, the color and location designate the direction that the CAS would have you act on. Note the “Entry” and “Target” line were added manually and are not part of the script. This is one successful setup; don’t get excited thinking this is how it always works. I will let you discover and learn for yourself that there is many failed setups and many setups that never trigger the actionable signal. This is where setting alerts is very handy.
6. Alerts. Press on the “Create Alert” Icon for TradingView. When the prompt opens select the preferred script either “TheStrat Pro” or “TheStrat Noob” under “Condition” and then under the sub-menu select any of the following scenarios.
• C ▲/ ▼ = If the active CS shows a continuation up/down pattern, remember this CS is active and can still change direction and trigger a reversal in the other direction.
• R ▲/▼ = If the active CS shows a reversal up/down pattern, remember this CS is active and can still change direction and trigger a continuation in the previous trend direction.
• HM Trigger(Last High Cross) = Alert when the active CS breaks the high of the previous CS. As a new CS opens, it re-adjusts its values and is just constantly waiting for the active CS break through the previous CS high.
• SS Trigger(Last Low Cross) = Alert when the active CS breaks the low of the previous CS. As a new CS opens, it re-adjusts its values and is just constantly waiting for the active CS break through the previous CS low.
• Inside Trigger (Last High/Low Cross) = Alert when the active CS breaks the low or the high of the previous CS. As a new CS opens, it re-adjusts its values and is just constantly waiting for the active CS break through either the previous CS low or the high.
• Last CS Inside
• Last CS H
• Last CS S
• Last CS Actionable Signal (inside, H or S)
• Last CS Complex Actionable Signal
• Last CS Any Actionable Signal
Hourly Trading System (Zeiierman)█ Overview
The Hourly Trading System (Zeiierman) is designed to enhance your trading by highlighting critical price levels and trends on an hourly basis. This indicator plots the open prices of hourly and 4-hour candles, visualizes retests, displays average price lines, and overlays higher timeframe candlesticks. It is particularly beneficial for intraday traders seeking to capitalize on short-term price movements and volume patterns.
█ How It Works
This indicator works by plotting significant price levels and zones based on hourly and 4-hour candle opens. It also includes functionalities for identifying retests of these levels, calculating and displaying average prices, and showing high and low labels for each hour.
█ Timeframe
The Hourly Trading System is designed to be used on the 1-minute or 5-minute timeframe. This system is tailored for intraday trading, allowing traders to find optimal entries around hourly opening levels and providing an easy method to identify the hourly trend. It works effectively on any market.
█ How to Use
Trend Analysis
Quickly gauge where the current price stands relative to key hourly and 4-hour levels. The plotted lines and zones serve as potential support and resistance areas, helping traders identify crucial points for entry or exit.
Utilize the 1-hour average and higher timeframe candles to understand the overall market trend. Aligning intraday strategies with larger trends can enhance trading decisions.
Use the bar coloring to quickly gauge the 1-hour trend on a lower timeframe. The bar colors indicate whether the hourly trend is bullish (green) or bearish (red), helping traders make quicker decisions in alignment with the overall trend.
Retest Identification
Enable retest signals to see where the price retested the hourly open levels. These retest points often signal strong price reactions, offering opportunities for trades based on support/resistance flips.
One effective strategy to incorporate is looking for price flips when a new hour starts. This approach involves monitoring price action at the beginning of each hour. If the price breaks and retests the hourly open level with strong momentum, it could indicate a potential trend reversal or continuation. This strategy is effective in volatile markets where price movements are significant at the start of each new hour.
Liquidity Sweep Strategy
Another common and effective strategy is the liquidity sweep. This involves identifying key levels where liquidity is likely to accumulate, such as previous hour highs and lows, and observing how the price interacts with these price levels. When the price sweeps through these levels, triggering stop-loss orders or pending orders, it often results in a sharp price movement followed by a reversal. Traders can capitalize on these movements by entering trades in the direction of the reversal once the liquidity sweep has occurred.
Equal Highs and Lows Strategy
The Equal Highs and Lows strategy leverages the concept of identifying levels where the price forms multiple highs or lows at the same level over different hourly periods. These equal highs and lows often indicate strong support or resistance levels where liquidity is accumulated. When the price approaches these levels, it is likely to trigger stop-loss orders and lead to significant price movements. Traders can look for breakouts or reversals around these levels to enter trades with higher probability setups.
█ Settings
Zone Width: Specifies the width of the zone around the 1-Hour Open as a percentage. Adjust this to widen or narrow the zone.
Show Retests: Enables or disables the display of retest markers. Retest markers show where the price has retested the 1-Hour Open line.
Number of Retests: Sets the number of retests to display. Adjust this to see more or fewer retest markers.
Volume Filter: Enables or disables the volume filter for retests. Use this to highlight retests with significant volume.
Volume Filter Length: Sets the length of the volume filter, smoothing the volume data to reduce noise.
1-Hour Average Line: Enables or disables the 1-hour average price line. This line shows the average price over the past hour.
Hourly High & Low Labels: Enables or disables the display of hourly high and low labels, marking the highest and lowest prices within each hour.
Candlesticks: Enables or disables the display of candlesticks on the chart, providing a detailed view of price action.
Bar Color: Enables or disables bar coloring based on price direction, with up bars in green and down bars in red.
Timeframe: Sets the timeframe for higher timeframe candles. Adjust this to match the period you want to analyze.
Number of Candles: Sets the number of higher timeframe candles to display. Increase this to see more candles on the chart.
Location: Sets the location for higher timeframe candles, allowing you to position them left or right on the chart.
-----------------
Disclaimer
The information contained in my Scripts/Indicators/Ideas/Algos/Systems does not constitute financial advice or a solicitation to buy or sell any securities of any type. I will not accept liability for any loss or damage, including without limitation any loss of profit, which may arise directly or indirectly from the use of or reliance on such information.
All investments involve risk, and the past performance of a security, industry, sector, market, financial product, trading strategy, backtest, or individual's trading does not guarantee future results or returns. Investors are fully responsible for any investment decisions they make. Such decisions should be based solely on an evaluation of their financial circumstances, investment objectives, risk tolerance, and liquidity needs.
My Scripts/Indicators/Ideas/Algos/Systems are only for educational purposes!
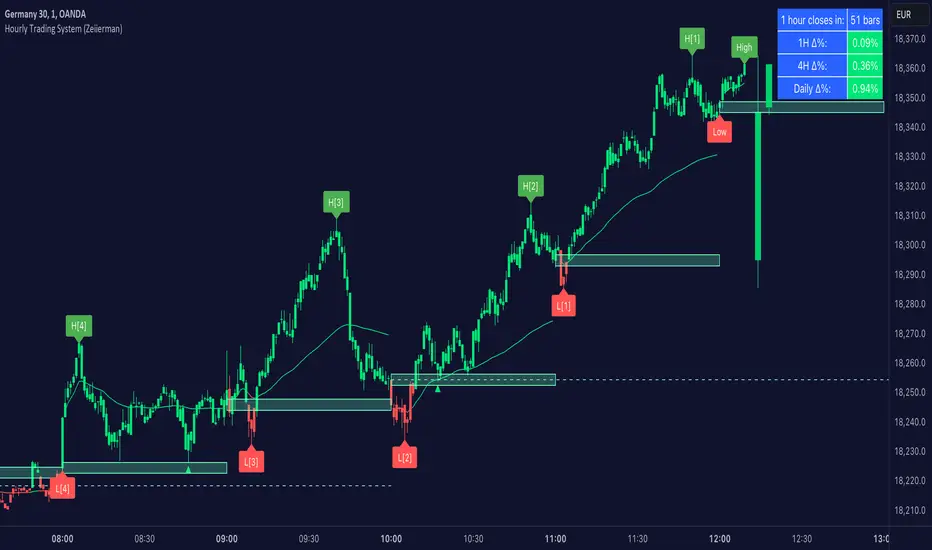
Chanlun ZSLX pen czsc Channel Chan Theory🏆 Chanzhongshuochan (CZSC) ZSLX Recursive Version Indicator - Flagship Edition
Background
A Decade of Craftsmanship, a Major Upgrade
This Chanzhongshuochan (Chan Theory) indicator has undergone nearly 10 years of meticulous refinement and continuous optimization. Since its initial design in 2015, it has been validated through real trading practice. Now, it makes its debut on TradingView with a brand-new upgrade, featuring more comprehensive functions and superior performance.
It truly implements all core theories from the original Chan Theory texts, including a complete system covering candlestick containment processing, fractal identification, pen-segment analysis, pivot zone theory, trading signal (buy/sell point) positioning, and divergence analysis. It serves as a professional and all-encompassing technical analysis tool for Chan Theory enthusiasts in the industry.
🎯 Chinese Translation for User Indicator Interface:
● 顶背离: Top Divergence
● 底背离: Bottom Divergence
● 顶背驰: Top Divergence Including Trend Structure
● 底背驰: Bottom Divergence Including Trend Structure
● 趋势: Trend
● 盘整: Consolidation
● 扩张: Expansion
● 大级别盘整: Higher-Timeframe Consolidation
● 一买: First Buy Signal
● 二买: Second Buy Signal
● 类二买:Quasi-Second Buy Signal
● 三买: Third Buy Signal
● 一卖: First Sell Signal
● 二卖: Second Sell Signal
● 类二卖:Quasi-Second Sell Signal
● 三卖: Third Sell Signal
📦 Parameter Settings
● Number of Candlesticks for Calculation: Up to 5,000 candlesticks. Even free TradingView users are limited to this data volume.
● Pen Detail Parameters: Adjustable options include "Old Pen", "New Pen", "Pen Based on Secondary High/Low", "Pen Based on Absolute High/Low", and "Strict Pen". Select via numerical options corresponding to each type.
● MA (Moving Average) and Bollinger Bands Display Parameters: Check the box to enable display; uncheck to hide (configure as needed).
● Pivot Zone Price & Pen-Segment Price Display: Check the box to enable display; uncheck to hide (configure as needed).
● MACD Parameters: Adjustable according to personal needs (set the periods for fast EMA, slow EMA, and signal line).
● MA Parameters: Default values can be manually adjusted.
● Pen Divergence, Segment Divergence, & Pen-Segment Divergence Display: Check the box to enable display; uncheck to hide (configure as needed).
● Pen-Segment Divergence Alert: Disabled by default. Enable by checking the box. To set up alerts:
a. Go to TradingView’s "Alerts" interface.
b. Under "Condition", select this indicator.
c. Choose "Any alert() function call".
d. Set the notification type, then create the alert to receive notifications.
🔥 Integration of Other Common Indicators & Rationale
● ✅ Moving Average (MA): Chan Theory inherently uses MA overlay for analysis. Adding MA here allows users to analyze price trends from multiple perspectives, making it an essential inclusion.
● ✅ Bollinger Bands: Combining Bollinger Bands (a price channel tool) with Chan Theory provides additional perspectives for trend analysis and improves accuracy, hence its integration.
● ✅ MACD: A 不可或缺 (indispensable) indicator for analyzing trend strength in Chan Theory. It is integrated to facilitate seamless analysis.
● ✅ Rationale for Integrating Shared Core Code between Two Scripts:
The scripts Chanlun ZSLX pen czsc Channel Chan Theory and Chanlun FBFD pen czsc Channel Chan Theory share some underlying code. Here’s why integration is necessary:
○ The core logics of the original Chan Theory — including candlestick containment processing, MACD divergence analysis, candlestick objects, and pen-related calculations — are identical in both scripts.
○ However, significant differences exist in the top-level logics for segment division, trend recursion, display effects, and functions.
○ Additionally, TradingView imposes limits on script code size, making it impossible to fully integrate the two versions’ line-drawing features into one.
○ Therefore, this indicator reuses shared code components, including:
■ The Start_kxian() function (returns candlestick objects),
■ The Start_bi() function (returns pen objects),
■ The showKxianzsfunc() function (draws candlestick-based pivot zones),
■ MACD divergence judgment code.
🎯 Technical Principles
🔥 1. Comprehensive Coverage of Original Chan Theory Functions
● ✅ Real-Time Candlestick Containment Processing – Intelligent Recognition of Containment Relationships
○ In uptrends: Select the higher high and higher low values (prioritize higher extremes).
○ In downtrends: Select the lower high and lower low values (prioritize lower extremes).
● ✅ Accurate Fractal Marking – Automatic Identification of Top/Bottom Fractals
○ When the "Old/New Pen" parameter is set to 2, the high/low points of each top/bottom fractal are plotted.
○ Top Fractal: Among three consecutive candlesticks, the middle candlestick has a higher high and a higher low than the adjacent two.
○ Bottom Fractal: Among three consecutive candlesticks, the middle candlestick has a lower low and a lower high than the adjacent two.
● ✅ Multi-Dimensional Pen-Segment Analysis – Complete System for Pens & Segments
○ Pens:
■ Old Pen: Strictly follows the traditional Chan Theory definition of "pen".
■ New Pen: Adheres to the more flexible "new pen" definition from the original Chan Theory.
■ Fractal Pen: Forms a pen directly from top/bottom fractals (responds to price changes; many peers misclassify this as a "sub-timeframe pen").
○ Segments: This version adopts a recursive logic. While some single pens are treated as segments (differing from pure segment division), most segment-drawing results align with standard methods — the core difference lies in the line-drawing logic.
● ✅ Multi-Level Pivot Zone Integration – Candlestick-, Pen-, & Segment-Based Pivot Zones
○ Candlestick Pivot Zone: The smallest-level pivot zone in Chan Theory.
○ Pen Pivot Zone: Follows the original Chan Theory for division — the zone’s high is the lowest high of overlapping pens; the zone’s low is the highest low of overlapping pens.
○ Segment Pivot Zone: Follows the original Chan Theory for division — the zone’s high is the lowest high of overlapping segments; the zone’s low is the highest low of overlapping segments.
● ✅ Intelligent Trading Signals – Accurate Positioning of Three Types of Buy/Sell Points
○ Type 1 Buy/Sell Signal
■ Principle: Based on Chan Theory’s "trend divergence" — momentum weakens when a trend structure forms.
■ Analysis Method: Identify bottom divergence (for buys) or top divergence (for sells) in the final pivot zone of a trend structure.
■ Application: For reference only. Comprehensive analysis requires combining momentum decay across multiple timeframes.
○ Type 2 Buy/Sell Signal
■ Principle: The first pullback low (for buys) or rebound high (for sells) after a Type 1 signal concludes.
■ Analysis Method: After a Type 1 structure forms, prices may occasionally break previous lows/highs.
■ Application: For reference only. Comprehensive analysis requires combining momentum decay across multiple timeframes.
○ Type 3 Buy/Sell Signal
■ Principle: A standard Type 3 buy signal occurs when prices break above the first pivot zone after a Type 1 buy, then pull back to test the zone. For ease of monitoring, all "breakout + pullback" patterns are marked as Type 3 signals here.
■ Identification Method: Beginners are advised to trade standard Type 3 structures (post-Type 1 signals), though such structures are relatively rare.
■ Application: For reference only. Comprehensive analysis requires combining momentum decay across multiple timeframes.
● ✅ Divergence Alert – Exclusive Divergence Algorithm
○ Principle: Uses MACD momentum statistics from the original Chan Theory to distinguish between "pen-structure divergence" and "segment-structure divergence". Specific values are labeled on the chart to differentiate MACD momentum for pens vs. segments. More complex statistical features will be added in future updates. For reference on the current timeframe only — multi-timeframe momentum analysis is still required.
● ✅ Trend Structure Recursion – Exclusive Trend Recursion Function
○ Principle: This is a "same-timeframe decomposition" version of trend types. Trends end as close to absolute highs/lows as possible. Some single pens may be treated as segments, resulting in more natural-looking trend structures.
⚙️ Indicator Features
🌟 1. Diverse Pen-Segment Algorithm Engines
● 🎨 Three Pen Algorithms: "Traditional Old Pen", "New Pen", "Top/Bottom Fractal Pen".
● 🔧 Extensive Parameter Adjustments: Fine-grained control over "secondary high/low pens", "fractal range judgment", etc.
● 📊 Dual Recursive Division: Recursion starting from pens + higher-timeframe recursion.
● 🎯 Customizable Parameters: Adapts to different Chan Theory interpretations and trading styles.
🌟 2. Multi-Level Intelligent Integration System
● 📈 Synchronized Calculation & Display: Linked analysis of pens, segments, and advanced recursive segments.
● 🏗️ Exclusive Recursion Algorithm: Accurate identification of advanced recursive segments.
● 🎪 Multi-Level Pivot Zone System: Full coverage of three pivot zone levels (candlestick, pen, segment).
● 📊 Holistic Market Analysis: Provides comprehensive insights into real-time market dynamics.
🎨 3. Professional Visual Customization
● 🌈 Custom Color Schemes: Perfectly matches personal chart styles.
● 💰 Price Label Display: Marks key prices for pens, segments, and pivot zones.
● 📐 Professional Auxiliary Tools: Practical features like MA and Bollinger Bands.
● 🎁 Included MACD: A supporting indicator for the sub-chart.
⏰ 4. Seamless Candlestick Replay Support
● 🔄 Historical Data Review: Fully compatible with TradingView’s replay function.
● 📚 Powerful Market Research Tool: Enhances the ability to analyze historical price trends.
● 🧠 Improved Decision-Making: Deepens market insights and judgment.
📦 Feature & Interface Showcase by Product Version
Advanced Recursive Version ⭐ Exclusive Algorithm
Suitable for: Advanced Chan Theory users seeking precise trend analysis.
Exclusive Features:
● 🚀 Rare Algorithm: A pure recursive version (most competitors only reach segment-level analysis, which is their limit).
● 🎯 Optimized High/Low Points: Trend endpoints are accurately positioned at absolute highs/lows.
● 🏆 Natural Trend Structures: More natural and rational distribution of high/low points.
● 💎 Complete Chan Theory Elements: Covers all core components of Chan Theory.
● ⚡ Rich Pen Details: Extremely detailed processing of pen structures.
User Feedback: The preferred version among many senior Chan Theory users, with excellent real-trading performance.
Screenshot:
---
🎊 Experience Now & Start Your Professional Chan Theory Analysis Journey!
Pre-Purchase Notes
Chanzhongshuochan (Chan Theory) is relatively complex. While this software strives to implement all functions from the original texts, minor imperfections or unaddressed details may exist — these will be gradually improved in future updates.
● Users with concerns are advised to test the indicator for a few days first. Purchase only if it meets your needs; otherwise, treat the test as a trial.
● Feedback on issues or bugs is welcome. The developer will update, modify, and optimize the indicator in their spare time.
Key Function Screenshots
1. Multi-Level Recursion
2. Candlestick Containment Processing
3. Area Statistics + Pivot Zone High/Low Price Display
4. Multi-Level Consolidation Divergence
5. Overlaid Practical Moving Averages
6. Fractal Pens
7. Candlestick-Based Pivot Zones
8. Dozens of Adjustable Parameters
9. Optional Alert Functions (More to be Added in Future Updates)
10. Trend Structure Markers
🏆 缠中说禅ZSLX 递归版指标 - 旗舰版
背景
十年匠心,重磅升级
这套缠中说禅指标历经近10年的精心打磨与持续优化,从2015年初版设计至今,已经过实战验证。现全新升级登陆TradingView,功能更加完善,性能更加卓越。
真正实现了缠论原文中的所有核心理论,包括K线包含、分型识别、笔段分析、中枢理论、买卖点定位、背离背驰等完整体系,为缠论爱好者提供业界专业、全面的技术分析工具。
📦参数设置
- 计算K线数量:最多计算5000根,免费tradingview用户也只能这么多数据
- 笔细节参数:新旧笔、次高低点笔、最高低点笔、严格笔 可以调整可按标的数字选
- 显示均线和布林线参数:根据需要设置打钩就是显示,取消打钩就是隐藏
- 显示中枢价格和笔段价格:根据需要设置打钩就是显示,取消打钩就是隐藏
- macd参数:可以根据自己需要调整参数 快 慢 信号线周期设置
- 均线参数:默认参数可以自己手动调整
- 显示笔背离、段背离、笔段背驰:根据需要设置打钩就是显示,取消打钩就是隐藏
- 笔段背离背驰报警:默认关闭可以设置打钩开启,然后在tradingview的警报界面,条件里选择指标,设置:任何alert()函数调用,再设置通知类型,然后创建报警就可以收到报警
🔥整合其他常用指标和原因:
✅均线:因为缠论里是有使用均线叠加分析,这种更方便用户从不同视角分析走势,所以必须增加
✅布林线:布林线通道,结合缠论,也可以更多的视角分析走势,提高准确度,所以也增加了
✅macd:这个是缠论分析理论里必不可少的分析走势力度的指标,所以也必须整合进来方便分析
✅Chanlun ZSLX pen czsc Channel Chan Theory这个脚本和Chanlun FBFD pen czsc Channel Chan Theory这个脚本有些底层的源码是一样的必须整合原因:
因为缠论原文底层的K线包含、macd背离背驰、K线对象和笔部分都是一样的,但是顶层的线段和走势递归两种划分原理和显示效果和功能是有很大区别,并且tradingview社区的源码量有限制,导致也无法两个版本划线完全整合成一个,所以,这个脚本里的Start_kxian函数返回的kxian对象、 Start_bi函数返回的bi 对象 、showKxianzsfunc画K线中枢部分的源码、macd背离背驰判断部分代码,会有一样的整合部分源码
🎯 技术原理
🔥 1. 全方位缠论原文功能覆盖
● ✅ 实时K线包含处理 - 智能识别包含关系
○ - 上涨K线中取高点高值、低点高值,高高取高
- 下跌K线中取高点低值、低点低值,低低取低
● ✅ 精准分型标记 - 顶底分型自动识别
○ - 通过新旧笔参数设置2,会画出每个顶底分型高低点
○ - 顶分型:三根k线中,中间K线高点高于两侧K线,低点也高于两侧
- 底分型:三根k线中,中间K线低点低于两侧K线,高点也低于两侧
● ✅ 多维笔段分析 - 笔、线段完整体系
○ - 老笔:传统缠论严格笔定义,符合原文
- 新笔:传统缠论新笔定义,符合原文宽松笔条件
- 分型笔:顶底分型就成笔,价格反应比较敏锐(同行很多人把本周期分型笔标成次级别)
○ - 线段:这个版本采用递归思路,有的地方一笔处理成段,大部分地方跟纯分段一样,但是划线原理不同
● ✅ 多级中枢联立 - K线中枢、笔中枢、线段中枢
○ - K线中枢:最小级别的缠论中枢
- 笔中枢:采用原文的笔中枢划分区间,高点取重叠部分的最低点,低点取重叠部分最高点
- 线段中枢:采用原文的线段中枢划分区间,高点取线段重叠部分的最低点,低点取线段重叠部分最高点
● ✅ 智能买卖点 - 三类买卖点精准定位
○ 1类买卖点
- 原理:基于缠论趋势背驰原理,形成趋势结构时候,力度减弱
- 分析方法:通过判断趋势结构中最后中枢形成底背驰
- 应用:只是参考,具体分析需要多周期力度衰减结合判断
2类买卖点
- 原理:基于1类买卖点结束后,第一个回调低点
- 分析方法:在形成一类结构后,有时候也会破低点
- 应用:只是参考,具体分析需要多周期力度衰减结合判断
3类买卖点
- 原理:标准的三买是在1买形成后,突破第一个中枢的第一个回踩,这边为了方便看盘,统一突破回踩就标三买
- 识别方法:新手建议选择一类买点后的标准三买结构操作,但是可能这种结构比较少
- 应用:只是参考,具体分析需要多周期力度衰减结合判断
● ✅ 背离背驰预警 - 独家背离背驰算法
○ - 原理:采用缠论原文的macd力度统计,区分笔结构的背离背驰和段结构的背离背驰,并且在图形上标上具体数值,区分笔和段的macd力度,后期这个还要继续升级更复杂的统计,仅做本周期的参考,具体也是要多周期力度分析
● ✅ 走势结构递归 - 独家走势递归功能
- 原理:走势类型版本,这个是同级别分解版本,走势尽量结束在最高最低点,有的地方可能一笔成段,· 走势更为自然
⚙️ 指标特点
🌟1. 多样化笔段算法引擎
○ 🎨 三大笔算法: "传统旧笔"、"新笔"、"顶底分型笔"
○ 🔧 海量参数调节: 次高低笔、分型区间判断等精细化控制
○ 📊 双重递归划分: 笔开始递归 + 大级别递归
○ 🎯 个性化参数调整: 满足不同缠友的理解需求与交易风格
🌟 2. 多级别智能联立系统
○ 📈 同步计算显示: 笔、线段、递归高级段联动分析
○ 🏗️ 独家递归算法: 高级递归段精准识别
○ 🎪 多级中枢体系: 三重中枢级别完整覆盖
○ 📊 全景市场分析: 提供全面的市场动态洞察
🎨 3. 专业视觉定制
○ 🌈 自定义配色方案 - 完美匹配个人图表风格
○ 💰 价格标识显示 - 笔、段、中枢关键价位标注
○ 📐 专业辅助工具 - 均线、布林线等实用功能
○ 🎁 附带MACD - 配套附图指标
⏰ 4. 完美K线回放支持
○ 🔄 历史数据回顾 - 完美支持TradingView回放功能
○ 📚 市场研究利器 - 提升历史走势分析能力
○ 🧠 决策能力增强 - 深化市场洞察与判断水平
📦 产品版本功能界面展示
高级递归版 ⭐ 独家算法
适合:高阶缠友,追求极致走势分析
独家特色:
● 🚀 全网罕见算法: 纯递归版本,其他家最多只能设计到分段级别就是极限了
● 🎯 优化高低点: 走势结束点精准定位最高最低点
● 🏆 自然走势结构: 高低点分布更加自然合理
● 💎 完整缠论元素: 涵盖所有缠论核心要素
● ⚡ 超丰富笔细节: 笔的处理细节极其丰富
🌟 客户反馈: 众多资深缠友首选版本,实战效果卓越
快照
---
🎊 立即体验,开启专业缠论分析之旅!
售前说明:缠中说禅理论,相对比较复杂,软件尽量实现原文的功能,但是也难免有些瑕疵地方,无法处理到位,这边后期会陆续完善,介意的客户可以先试用几天,觉得合适再买,不合适就当测试下,欢迎大家反馈问题和bug,掌柜有空会后期更新修改和优化
1.多级别递归
2.K线包含
3.面积统计+中枢高低点价格显示
4.多级别盘整背离背驰
5.叠加实用均线
6.分型笔
7。k线中枢
8.几十个可选参数调整
9,可选的一些报警功能,后期陆续完善,更丰富
10.走势结构标志

10x HTF Candles Dynamic with LTF FVG and Key LevelsPurpose
The 10x HTF Candles Dynamic Pine Script is a versatile, all-in-one trading tool designed for TradingView to empower traders with actionable insights across multiple timeframes. It combines advanced price action analysis, Fair Value Gap (FVG) detection, market structure evaluation, and key level visualization into a single, highly customizable interface. Built for day traders, swing traders, and scalpers, this script enhances decision-making by providing a clear, multi-dimensional view of market dynamics, liquidity zones, and trend biases. Its purpose is to streamline technical analysis, reduce chart clutter, and deliver real-time, visually intuitive data to support precise trading strategies.
What the Script Does
How the Script Works:
The script leverages Pine Script v5’s advanced features to deliver a robust and efficient trading tool. Below is a step-by-step explanation of its functionality:
1. Initialization and Configuration:
- Initializes with @version=5, enabling dynamic requests, and sets limits for bars (500), lines, labels, boxes, and polylines to manage resources.
- Defines user inputs for candle settings, timeframe selection, FVG parameters, DWM levels, market structure table, and visual preferences.
- Dynamically calculates 10 higher timeframes based on the current chart timeframe (e.g., 1m chart → 5m, 15m, 60m, etc.) or allows custom timeframes.
2. Data Acquisition:
- Fetches OHLC data for up to 10 timeframes using request.security, storing it in optimized TfData objects (arrays for open, high, low, close).
- Loops through enabled timeframes to minimize redundant code, improving processing speed.
3. Candlestick Rendering:
- Draws HTF candlesticks at user-defined offsets, with customizable bullish/bearish colors, wick colors, and widths.
- Calculates bar types (Inside, Normal, Outside) and optionally labels them above candles for pattern analysis.
4. FVG Detection and Visualization:
- Scans for FVGs by comparing candle highs and lows across three bars (e.g., low of candle 1 > high of candle 3 for bullish FVG).
- Detects IFVGs based on user-selected methods (wick, close, or midpoint) and highlights them with distinct colors.
- Draws FVG boxes with configurable borders, midpoint lines, and labels, tracking mitigation status.
- Limits FVG display to a user-defined maximum (1–200) to maintain chart clarity.
5. Horizontal Levels and DWM Lines:
- Computes Highs, Lows, Midpoints, and Quarter Points for each timeframe, drawing lines with customizable styles and extensions.
- Plots DWM open, close, high, low, and control point lines, with optional alerts for high/low breaks.
- Supports session-based opening price lines (e.g., 09:30 Market Open) with similar customization.
6. Market Structure and Bias:
Calculates trend bias by comparing the current close to the midpoint of the timeframe’s range (highest high to lowest low).
Updates a market structure table with timeframe, bias, and premium/discount status, using color-coded cells for quick interpretation.
7. Countdown Timers:
- Converts timeframe strings to seconds and calculates the time remaining until the next candle using timenow.
- Renders countdown labels with timeframe names (e.g., “1h\n(00:45)”) at user-defined positions.
8. Optimization and Cleanup:
- Uses VisualElements UDTs to manage lines, wicks, and labels, reducing memory usage.
- Deletes outdated drawings when limits are exceeded, ensuring a clean and responsive chart.
- Employs loops and arrays to streamline repetitive tasks, enhancing performance.
How to Use the Script:
This script is user-friendly yet powerful, suitable for traders of all experience levels. Follow these steps to maximize its potential:
1. Add to TradingView:
- Copy the script into TradingView’s Pine Editor.
- Click “Add to Chart” to apply it to your active chart.
2. Customize Settings:
- Candle Settings: Adjust the number of candles (1–10), starting position, group spacing, bullish/bearish colors, wick colors, and candle width.
- Timeframe Settings: Enable/disable up to 10 timeframes, choosing dynamic (auto-selected) or custom timeframes (e.g., 3m, 60m, D).
- FVG Settings: Toggle FVG detection, set detection methods (wick/close/midpoint), adjust thresholds, and customize colors, borders, and midpoint lines.
- DWM Settings: Enable daily/weekly/monthly lines (open, close, high, low, midpoint), set colors, and configure alerts for high/low breaks.
- Market Structure Table: Show/hide columns for timeframe, trend bias, and premium/discount, and adjust table position (top-left, bottom-right, etc.).
- Countdown Timers: Enable timers, adjust offsets, and customize text/background colors.
- Label Settings: Configure price label precision, transparency, and offsets for clarity.
3.Interpret Visuals:
- Candlesticks: Analyze HTF candles to gauge trend direction and momentum across timeframes.
- FVGs: Look for unmitigated FVGs (colored boxes) as potential support/resistance zones or trade setups.
- Key Levels: Use Highs, Lows, Midpoints, and Quarter Points to identify breakout or reversal areas.
4. Market Structure Table: Check trend bias and premium/discount status to align trades with market conditions.
- DWM Lines: Monitor daily/weekly/monthly levels for institutional reference points.
- Countdown Timers: Time entries/exits based on upcoming candle formations.
5. Integrate with Strategy:
- Combine script insights with your trading plan (e.g., use FVGs for entries, key levels for stops/targets).
- Set alerts for high/low breaks or liquidity zone approaches to stay proactive.
- Export table data or screenshot visuals for documentation and analysis.
6. Optimize Performance:
Limit the number of candles, FVGs, and lines to match your device’s capabilities.
Regularly review settings to focus on the most relevant timeframes and features.
Why the Script is Original
The 10x HTF Candles Dynamic script stands out in the TradingView community due to its innovative design, comprehensive functionality, and trader-centric approach. Here’s what makes it unique:
1. Seamless Multi-Timeframe Integration:
- Unlike single-timeframe indicators, this script synthesizes data from up to 10 timeframes, offering a holistic view of market structure.
- Dynamic timeframe selection adapts to the chart’s timeframe, ensuring relevance across all trading styles.
2 . Advanced FVG and IFVG Detection:
- Provides granular control over FVG detection with three IFVG methods (wick, close, midpoint), a rarity in most scripts.
- Tracks mitigation status and highlights unmitigated FVGs, enabling traders to capitalize on high-probability setups.
- Visualizes FVGs with boxes, midpoint lines, and labels, enhancing clarity and usability.
3. Sophisticated Market Structure Analysis:
-The bias calculation, introduced in recent updates (2 days ago), uses a robust algorithm to assess trend direction based on range midpoints.
- The market structure table, with premium/discount zones (added 20 hours ago), offers a unique summary of market conditions, unmatched by standard indicators.
4. Comprehensive DWM and Session Support:
- Integrates daily, weekly, and monthly levels alongside session-based opening prices, catering to institutional and retail traders alike.
- Customizable alerts for high/low breaks add actionable functionality.
5. Visual Hierarchy and Clarity:
- Scales line widths and transparency by timeframe, prioritizing higher timeframes for strategic focus.
- Countdown timers provide real-time context, a feature rarely seen in multi-timeframe scripts.
6.Performance Optimization:
- Recent updates introduced loops and UDTs to reduce code redundancy and boost processing speed.
- Automated cleanup mechanisms prevent chart clutter, ensuring smooth operation even on low-resource devices.
7. High Customizability:
- Offers extensive settings for visuals, timeframes, FVGs, DWM lines, and alerts, accommodating diverse trading preferences.
- Balances complexity with accessibility, making it approachable for beginners and powerful for advanced users.
8.Continuous Evolution:
- Regular updates (e.g., bias filter table, premium/discount feature, code optimization) demonstrate ongoing commitment to improvement.
- Closed-source protection (noted 20 hours ago) ensures intellectual integrity while allowing free use, fostering trust in the TradingView community.
Conclusion
The 10x HTF Candles Dynamic Pine Script is a groundbreaking tool that redefines multi-timeframe analysis on TradingView. By combining candlestick visualization, FVG detection, market structure insights, DWM levels, and countdown timers, it provides traders with a comprehensive, real-time view of market dynamics. Its advanced optimization, customization options, and continuous updates make it a standout choice for traders seeking precision, clarity, and efficiency. Whether you’re scalping intraday moves or swing trading weekly trends, this script equips you with the tools to master the markets with confidence.

RTH Candles Overlay--Overview
Unlock a new way to analyze Regular Trading Hours (RTH) with this powerful indicator! Designed for traders who focus on the 09:30–16:00 market session (default EST), it redefines hourly price action by aligning candlesticks with the RTH start at 09:30, rather than the standard XX:00. It also plots hourly high/low lines and projection zones to pinpoint potential support, resistance, and price targets. Plus, it displays compact hourly candlesticks on the right side of your chart for quick, at-a-glance analysis.
--Key Features
Shifted RTH Candles: Unlike standard hourly candles starting at XX:00, this indicator aligns candles with the RTH open at 09:30 (e.g., 09:30–10:30, 10:30–11:30). This captures true market momentum from the opening bell, offering a more accurate view of price action.
Session High/Low Lines: Marks the high and low prices for each session with clear, labeled lines (e.g., “0930-1030 High”) to highlight key levels.
Projection Zones: Draws shaded boxes above and below each session’s range (default: 0.25 and 0.5 Projection levels) to show potential price targets or reversal zones.
Shifted Candlesticks: Displays each shifted Hour as a candlestick (open, high, low, close) on the right side of the chart, with bullish candles in green and bearish in gray for easy comparison.
Vertical Markers: Dotted vertical lines mark the start of each period (e.g., 09:30) for clear time segmentation.
Historical Analysis: View up to 5 days of past sessions to spot trends and recurring levels.
Fully Customizable: Adjust session times, timezone, colors, and projection levels to fit your trading style.
--How It Works
RTH-Aligned Candles: The indicator divides the trading day into up to seven sessions (default: hourly from 09:30 to 16:00 EST). Each session starts at times like 09:30, 10:30, etc., aligning with the RTH open instead of standard hourly intervals. This shift ensures you see price action as it unfolds during key market hours.
High/Low Lines: Horizontal lines mark the highest and lowest prices for each session, with customizable labels for easy reference.
Fibonacci Zones: Shaded boxes extend above (0.25 to 0.5 times the session’s range) and below (–0.25 to –0.5) each session’s high/low, highlighting potential price targets or areas where price may reverse.
Candles: Each shifted hour is summarized as a candlestick on the right side of the chart, showing open, high, low, and close prices. Bullish candles are green, bearish are gray, and you can adjust their size and spacing.
Vertical Lines: Dotted lines at the start of each session (e.g., 09:30) help you visualize session boundaries.
Historical Data: Analyze up to 5 days of past sessions to identify patterns or key levels.
--Settings
Timezone: Set your market’s timezone (default: EST, -4 hours).
Session Times: Customize up to seven sessions (default: hourly from 09:30 to 16:00).
Max Days to Plot: Show up to 5 days of historical sessions (default: 1 day).
Candle Styles: Toggle session candles, adjust width, spacing, and offset. Customize bullish (green) and bearish (gray) colors.
High/Low Lines: Enable/disable high/low lines, set color (default: gray), style (solid, dotted, dashed), and label size. Optionally show session open lines and labels.
Fibonacci Zones: Turn projection zones on/off, adjust levels (default: 0.25 and 0.5), and choose fill color (default: translucent gray).
Vertical Lines: Toggle session start lines and customize their color and style.
--Best Used For
Day Trading: Spot key levels and price targets during RTH sessions, aligned with the 09:30 market open.
RTH Analysis: Get a clearer picture of price action with candles that match the market’s true rhythm, starting at 09:30 instead of XX:00.
Fibonacci Trading: Use projection zones to identify potential support, resistance, or breakout levels.
Session Comparison: Compare price action across sessions using compact candlesticks and historical data.
--How to Use
1. Add the indicator to your TradingView chart (works best on 1-hour or lower timeframes).
2. Set the timezone and session times to match your market (default: 09:30–16:00 EST).
3. Enable/disable features like Fibonacci zones, high/low lines, or session candles in the settings.
4. Use the shaded zones to anticipate price targets or reversals based on Fibonacci levels.
5. Analyze session candles and historical data to spot trends or recurring levels.
--Why This Indicator?
The RTH Session Candles with projection Zones indicator is a game-changer for traders who want to focus on the market’s true rhythm. By aligning candles with the 09:30 RTH open, it captures price action as it happens, unlike standard hourly charts. Paired with projection zones and clear session markings, it’s a simple yet powerful tool to identify key levels and potential price moves. Perfect for day traders, swing traders, or anyone who wants a cleaner, more precise view of the market.

TechniTrend: CandleMetrics🟦 Overview
The TechniTrend: CandleMetrics Indicator is a powerful tool designed to give traders an in-depth analysis of candlestick structures. This indicator allows users to identify potential reversal points, trend continuations, and other crucial market behaviors by examining key ratios between candle components—such as body, shadow, and overall range—alongside volume conditions. The advanced filtering options offer flexibility for both novice and experienced traders, enabling tailored setups to suit different trading strategies.
🟦 Key Features
🔸Customizable Ratios: Set thresholds for Body-to-Range, Shadow-to-Range, Upper Shadow-to-Range, and Lower Shadow-to-Range ratios.
🔸Volume-Based Filters: Integrate volume conditions to strengthen the reliability of signals.
🔸Flexible Conditions: Choose whether filters should work independently or in combination, allowing for precise pattern identification.
🔸Visual Markers: Mark potential signals with a distinct background color and symbols on the chart.
🔸Alerts: Receive notifications for each selected condition, ensuring you never miss an opportunity.
🟦 How It Works
The CandleMetrics Indicator operates by analyzing the relationship between different components of each candlestick, combined with volume data to determine the strength of signals. Here’s a detailed breakdown of each feature:
🔸 Body to Range Ratio:
This filter compares the size of the candle's body to its total range (from high to low).
Example Setting: If you’re interested in spotting candles with small bodies relative to their total range, you might set the Body-to-Range Ratio to “Less than 0.3.”
🔸 Shadow to Range Ratio:
This examines the combined size of both shadows (upper and lower) relative to the entire candle range.
Example Setting: Use a Shadow-to-Range Ratio set to “More than 0.8” to find candles with significant wick lengths, suggesting market indecision.
🔸 Upper Shadow to Range Ratio:
This filter assesses the proportion of the upper shadow (wick) in relation to the candle’s full range.
Example Setting: “Less than 0.05” can help identify situations where the upper shadow is minimal, indicating strong downward pressure.
🔸 Lower Shadow to Range Ratio:
It measures the lower shadow compared to the entire candle range.
Example Setting: “More than 0.7” is useful for detecting potential rejection patterns at lower prices, hinting at a possible bullish reversal.
🔸 Volume Filter:
Integrates volume data to verify the reliability of each candle pattern.
Example Setting: Apply a Volume Filter Length of 100 with an SMA type to smooth volume data over a longer period, filtering out short-term noise and focusing on significant volume shifts.
🟦 Combining Filters
The indicator offers an option to Combine Filters. When this setting is enabled, all selected conditions must be met simultaneously for a candle to be marked. If disabled, each condition functions independently, allowing more flexibility in detecting diverse patterns.
🟦 Examples & Use Cases
🔸Example 1: Spotting Reversal Opportunities
I used the following configuration to find potential bullish reversals:
Upper Shadow to Range Ratio: “Less than 0.05” – Looking for candles with almost no upper shadow.
Lower Shadow to Range Ratio: “More than 0.7” – Highlighting candles with a significant lower shadow.
Volume Filter Length: 100 with SMA.
This setup effectively highlights candles where price rejection is happening at lower levels, suggesting a potential trend reversal to the upside.
🔸Example 2: Detecting Market Uncertainty
If you want to focus on candles showing market hesitation, try:
Shadow to Range Ratio: “More than 0.85” – Emphasizing long-wick candles that could indicate indecision.
Disable Combine Filters to allow flexibility, marking any candle meeting the above criteria.
🟦 Detailed Explanation of Each Option
Here’s a clear and concise breakdown of each option for a better understanding:
1. Body to Range Ratio
Purpose: This ratio shows how significant the candle's body is compared to its overall range. A smaller body-to-range ratio can indicate a potential reversal if the market appears indecisive.
How to Use: Increase the ratio to filter for stronger trend candles; decrease it to identify reversal or indecision candles.
2. Shadow to Range Ratio
Purpose: This filter captures the size of both shadows relative to the candle's total range. A larger ratio often points to market hesitation, while a smaller ratio suggests a decisive move.
How to Use: Adjust this filter to focus on candles with long wicks (indecision) or short wicks (decisiveness).
3. Upper Shadow to Range Ratio
Purpose: Helps to identify candles with strong downward moves by focusing on the upper wick length. A small upper shadow can imply sellers' dominance.
How to Use: Lower the ratio to detect candles with minimal upward rejection.
4. Lower Shadow to Range Ratio
Purpose: Targets candles with strong buying pressure by analyzing the lower shadow. A larger lower shadow may indicate a bullish reversal.
How to Use: Increase the ratio to spot rejection candles with significant lower shadows.
5. Volume Filter
Purpose: Adds a volume component to verify the validity of each candlestick pattern. Higher-than-average volume often signifies the strength of a move.
How to Use: Adjust the filter length and type to smooth out volume fluctuations based on your trading timeframe.
🟦 Indicator Alerts
Each filter has its own alert configuration, enabling traders to stay updated on market conditions that meet their selected criteria. You can customize alerts to trigger whenever a condition is met, helping to manage trades even when away from the screen.
BERLIN CandlesA problem with Heikin Ashi is that while it gives you a great overview of overall direction, it is rarely possible to use it as a replacement for normal japanese
candlesticks. The reason for this is that actual price data is lost, since the candles are more akin to a moving average than a different way to see price action. Also, with Heikin Ashi, most of the actual price action is lost, because the candles can be bigger than the high and low of the underlying japanese candlestick.
With BERLIN Candles I have tried to fix that problem. By using a smoothed out version of the previous Heikin Ashi candle close as the current BERLIN Candle open, the high and low of the actual japanese candlestick for the high and low of the BERLIN Candle, and the current Heikin Ashi close as the BERLIN Candle close, while setting hard limits for BERLIN Candle open and close values so that they can never exceed the high and low of the underlying japanese candlestick.
One problem still persists though. The actual current price data is lost. However, the BERLIN Candles have solved this by adding a fifth part to the candles. The close of the underlying japanese candlesticks are indicated with a plus-sign. This way, actual price data is never lost, while keeping all of the other benefits of this type of candles.
A few added bonuses:
The addition of the 14 period ATR at the latest candle
The baseline from Ichimoku is included as an option
The 14 period ATR value of each candle can be seen in the indicator data as
the orange value

Trend Bars Pro (HTF PO3)Hello Traders!
The innovative TRN Trend Bars Pro are designed to help traders to analyze markets in an intuitive way and provide high probability entry and exit signals. It combines three core concepts:
TRN Trend Bars to see the current trend and reversals (replaces the default chart bars)
Bar Ranges to highlight consolidations
Dynamic Trend to see the overall trend.
First, let's have a look at each of these concepts individually. Afterwards, we describe how a combination of all three gives you a crystal-clear picture of the market.
TRN Trend Bars Pro
They show bullish and bearish trends and reversals based on color coding the bars and give high probability trade opportunities with special colors. The trend analysis is based on a new algorithm that includes several different inputs:
classical and advanced bar patterns and their statistical frequency
probability distributions of price expansions after certain bar patterns
bar information such as wick length in %, overlapping of the previous bar in % and many more
historical trend and consolidation analysis
The algorithm weighs these concepts and outputs a color scheme for the chart bars or candlesticks.
Bar Types
Trend bars in green and red
Reversal Bars in blue and fuchsia
Continuation Bars in turquoise and orange
Breakout Bars in dark green and pink
Green Bars signify a sustained uptrend, indicating bullish market sentiment. On the other hand, Red Bars indicate a persistent downtrend, representing bearish market sentiment. The transition from red to green denotes a bullish trend reversal, suggesting a shift from bearish to bullish sentiment. Conversely, the shift from green to red signals a bearish trend reversal, indicating a transition from bullish to bearish sentiment. By monitoring these color changes, traders can identify potential trend reversals and make informed trading decisions.
The presence of gray and black bars indicates a neutral market state, often observed before an impending color change from red to green or green to red. These neutral bars serve as a transition phase between the previous trend and the potential reversal.
The TRN Trend Bars Pro incorporate signal bars, distinguished by their distinct colors, to offer potential buy and sell signals and deeper insights into market dynamics.
Reversal Bars
The presence of blue Reversal Bars indicates a trend reversal to the upside, while pink Reversal Bars indicate a reversal to the downside. These bars not only serve as signals for potential trend shifts but also present favorable opportunities to enter the market or increase one's position size.
Continuation Bars
In addition to the reversal bars, the indicator also includes bullish continuation bars (colored turquoise) and bearish continuation bars (colored orange). These bars act as signals for the continuation of an existing trend. Like the reversal bars, they can be utilized as entry points or opportunities to augment one's position size.
Breakout Bars
The dark green breakout bars within TRN Trend Bars Pro show a powerful breakout from a price range detected by our integrated bar range feature. They signify the continuation or potential change in a trend following a consolidation phase. As such, these bars hold dual functionality, serving as reversal signals and validating the persistence of an ongoing trend.
Bar Ranges
The bar range feature automatically finds consolidations where the price range of several consecutives bars is rather small. The detection of the bar ranges includes among other things the overlapping percentage of these bars.
How to Use Price Ranges
Here are a few ways you can use the bar ranges in your trading:
Identify Support and Resistance Levels
The price ranges can help you identify key support and resistance levels on a chart. By observing price ranges and identifying these levels, you can make more informed decisions about entering or exiting trades.
Breakout Trading
Price ranges can also provide insights into potential breakout opportunities. Breakouts occur when the price breaks out of a defined range, signaling a potential shift in market sentiment and the start of a new trend. The Color highlighted Breakout Bars from the TRN Trend Bars Pro are signaling a powerful breakout of a price range. Traders can enter positions in the direction of the breakout and set appropriate stop-loss orders to manage risk. Note that not every price range is left by a powerful breakout.
Dynamic Trend
The Dynamic Trend combines elements from standard trend strength indicators (e.g. DI-, DI+, Parabolic SAR) and volatility indicators (e.g. ATR, Standard Deviation). It produces a moving average line that adapts to changing market volatility. It is inspired by the ideas of the programmer and trader Fat Tails. The adaptive behavior provides more relevant information for traders when compared to traditional moving averages which do not consider volatility and trend strength together. This makes the Dynamic Trend completely unique, and no other moving average indicator can give you this precision.
How to use Dynamic Trend
Generally, a rising Dynamic Trend line, displayed in green, indicates that an uptrend is strong, while a falling Dynamic Trend, displayed in red, suggests that the downtrend is sharp. The Dynamic Trend turns gray when there is insufficient clarity to establish a distinct trend and especially when there is not volatility in the market.
Identify potential trade entries and exits: When used in conjunction with price action, the Dynamic Trend can provide potential trade signals. For example, if the price crosses above the Dynamic Trend, it may be a bullish sign, suggesting a potential buy entry. Conversely, if the price crosses below the Dynamic Trend, it may indicate bearish conditions and a potential sell signal.
Trend Identification and Pullback trading
Observe the Dynamic Trend's color. When it's on the rise and appears green, it indicates a bullish trend. Conversely, if it's in decline and displayed in red, it signals a bearish trend.
If Dynamic Trend is green and price pulls from above back to the Dynamic Trend, then this can be considered as a bullish signal.
If Dynamic Trend is red and price pulls from below back to the Dynamic Trend, then this can be considered as a bearish signal.
In the event of a bearish signal, such as a bearish TRN Signal Bar, and the Dynamic Trend is red, it provides additional confirmation to the bearish signal. Likewise, bullish signals gain added conviction when the Dynamic Trend is green.
Crossovers
As with other moving averages, crossovers between the Dynamic Trend and the price can be significant.
If price is crossing above the Dynamic Trend, then this can be considered as a bullish signal.
If price is crossing below the Dynamic Trend, then this can be considered as a bearish signal.
If you currently hold a position, both bullish and bearish crossovers can serve as potential exit signals. For instance, in the case of a long position, a bearish crossover can indicate a potential shift in sentiment, signaling a bearish reversal and a potential opportunity to close your long position.
Filtering Noise
Due to its adaptive nature, the Dynamic Trend can be a useful tool to filter out market noise. When the market is choppy or consolidating, the Dynamic Trend tends to remain flat and colored gray, signaling traders to potentially stay out of the market.
Stop Losses
The Dynamic Trend can also be used as a dynamic stop loss. For instance, in a long trade, traders can use the Dynamic Trend as a trailing stop, selling their position if the price crosses below the Dynamic Trend.
Combining TRN Trend Bars Pro, Bar Ranges and Dynamic Trend together
Combining all three concepts gives you a crystal-clear picture of the market. The Dynamic Trend shows you the overall trend. If price pulls back to the dynamic trend line and then price picks up the trend direction again, then the TRN Trend Bars Pro immediately switches the color to the trend direction. Therefore, you can easily identify high probability entry signals based on the bar color.
As a simple trading model, you can set the stop loss below the last swing or below a TRN signal bar (vice versa for short entries) and use 2.5 R or 3 R as target.
You can increase the success rate of the high probability TRN signal bars entries even more if they are in line with the Dynamic Trend line.
On the other hand, the TRN Bar Ranges help you to stay out of the market in case the price does not really change. As a confluence signal to stay flat in this period the dynamic trend line tends to be grey as well. If the price breaks out of the range, then the indicator prints a breakout bar which serves as a high probability entry signal.
Although it is possible to switch off any of these concepts, it is highly recommended to use all three in combination to get a crystal-clear picture of the market.
Alerts
Experience the power of our TRN Trend Bars Pro alerts, delivering real-time notifications for trend changes, price range breakouts, and signal bar formations or confirmations. Stay on top of the market with these versatile alerts, customizable to your preferred assets and timeframes.
Conclusion
While signals from TRN Trend Bars Pro can be informative, it is important to recognize that their reliability may vary. Various external factors can impact market prices, and it is essential to consider your risk tolerance and investment goals when executing trades.
Risk Disclaimer
The content, tools, scripts, articles, and educational resources offered by TRN Trading are intended solely for informational and educational purposes. Remember, past performance does not ensure future outcomes.

MTF ChartingKey Features
Visual Settings: The script allows customization of the visual aspects of the candlesticks. Traders can select colors for the bodies, borders, and wicks of bullish (rising) and bearish (falling) candles. This customization enhances readability and personal preference alignment.
Timeframe Settings: Traders can choose up to five different timeframes (labeled as HTF 1 to HTF 5) to display on the main chart. For each selected timeframe, traders can specify the number of candlesticks (bars) to display.
Candlestick Representation: The script redraws the candlesticks from the selected timeframes onto the main chart. This redrawing includes the high, low, opening, and closing prices of the candlesticks for each timeframe, providing a multi-dimensional view of market trends.
Labeling: The script includes an option to label each set of candlesticks with their respective timeframe for easy identification.
Practical Usage for Traders
Market Analysis: By displaying candlesticks from different timeframes, traders can analyze the market more comprehensively. For instance, while the main chart might show a short-term trend, the MTF charting can reveal a different longer-term trend, aiding in more informed decision-making.
Trend Confirmation: Viewing multiple timeframes simultaneously helps in confirming trends. If multiple timeframes show a similar trend, it might indicate a stronger, more reliable trend.
Identifying Reversals: The script can be useful in spotting potential trend reversals. For example, if the lower timeframe shows a bearish trend while the higher timeframe remains bullish, it might signal a potential reversal.
Customization for Strategy Alignment: Traders can customize the timeframes and the number of bars to align with their specific trading strategies, whether they are short-term day traders or long-term position traders.
Technical Aspects
The script uses arrays to store and manipulate candlestick data for each timeframe. This approach ensures efficient handling of data and updates.
Examples
- Display up to 5 timeframes on your main price chart. You are able to get a zoomed out view of the market without taking up too much screen real estate.
- Show a lower timeframe on your primary chart. In this instance maybe you primarily look at the 5 minute chart, but like to refine your entries on the 1 minute. Here you can do it with one chart.
- Look at how the daily candle is forming relative to the timeframe that you are currently on. You can more easily spot where price closed and opened on certain days.
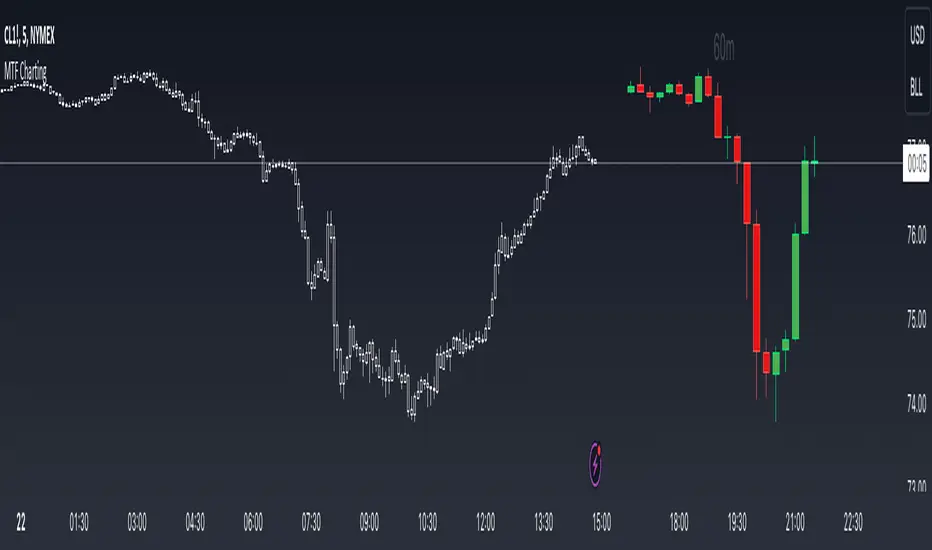
Pattern Forecast (Expo)█ Overview
The Pattern Forecast indicator is a technical analysis tool that scans historical price data to identify common chart patterns and then analyzes the price movements that followed these patterns. It takes this information and projects it into the future to provide traders with potential price actions that may occur if the same pattern is identified in real-time market data. This projection helps traders to understand the possible outcomes based on the previous occurrences of the pattern, thereby offering a clearer perspective of the market scenario. By analyzing the historical data and understanding the subsequent price movements following the appearance of a specific pattern, the indicator can provide valuable insights into potential future market behavior.
█ Calculations
The indicator works by scanning historical price data for various candlestick patterns. It includes all in-built TradingView patterns, credit to TradingView that has coded them.
Essentially, the indicator takes the historical price moves that followed the pattern to forecast what might happen next.
█ Example
In this example, the algorithm is set to search for the Inverted Hammer Bullish candlestick pattern. If the pattern is found, the historical outcome is then projected into the future. This helps traders to understand how the past pattern evolved over time.
█ How to use
Providing traders with a comprehensive understanding of historical patterns and their implications for future price action allows them to assess the likelihood of specific market scenarios objectively. For example, suppose the pattern forecast indicator suggests that a particular pattern is likely to lead to a bullish move in the market. A trader might consider going long if the same pattern is identified in the real-time market. Similarly, a trader might consider shorting the asset if the indicator suggests a bearish move is likely, if the same pattern is identified in the real-time market.
█ Settings
Pattern
Select the pattern that the indicator should scan for. All inbuilt TradingView patterns can be selected.
Forecast Candles
Number of candles to project into the future.
-----------------
Disclaimer
The information contained in my Scripts/Indicators/Ideas/Algos/Systems does not constitute financial advice or a solicitation to buy or sell any securities of any type. I will not accept liability for any loss or damage, including without limitation any loss of profit, which may arise directly or indirectly from the use of or reliance on such information.
All investments involve risk, and the past performance of a security, industry, sector, market, financial product, trading strategy, backtest, or individual's trading does not guarantee future results or returns. Investors are fully responsible for any investment decisions they make. Such decisions should be based solely on an evaluation of their financial circumstances, investment objectives, risk tolerance, and liquidity needs.
My Scripts/Indicators/Ideas/Algos/Systems are only for educational purposes!

AutoCandlesHi everyone!, this Script is the first in my series of candlesticks indicators. Currently it supports only a few, but it´s quite strict about them, contrary to most scripts I do thorough calculations to avoid false signals, if you would like to soften the indicators so it generates more signals feel free to ask.
It uses the same interface for showing as the Candlestick Scanner by Nicolas, but use different formulas.
I encourage everyone to comment what indicators they would like to add (with proper reference so I can actually add them) or to correct improper behavior in the indicator. This way I will be able to perfect the indicator and make it more useful to everyone.
If anyone reads the pine code and wonders why I compare to the average true range frequently the answer is quite simple, it's done to make the algorithm work in ANY symbol, so concepts like long bars or "visible" gaps can actually be coded.
If anyone needs to hide the 0.0000 values of the script it needs to go to the properties of the chart, then background and then uncheck indicator values.

Bull Bear Pivot by RawstocksThe "Bull Bear Pivot" indicator is a custom Pine Script (v5) tool designed for TradingView to assist traders in identifying key price levels and pivot points on intraday charts (up to 1-hour timeframes). It combines time-based open price markers, pivot high/low detection, and candlestick visualization to provide a comprehensive view of potential support, resistance, and trend reversal levels. Below is a detailed description of the indicator’s functionality, features, and intended use.
Indicator Overview:
The "Bull Bear Pivot" indicator is tailored for intraday trading, focusing on specific times of the day to mark significant price levels (open prices) and detect pivot points. It plots horizontal lines at the open prices of user-defined sessions, identifies pivot highs and lows on the current chart timeframe, and overlays custom candlesticks to highlight price action. The indicator is designed to work on timeframes of 1 hour or less (e.g., 1-minute, 3-minute, 5-minute, 15-minute, 30-minute, 60-minute) and includes a warning mechanism for invalid timeframes.
Key Features:
Time-Based Open Price Markers:
The indicator allows users to define up to five time-based sessions (e.g., 4:00 AM, 8:30 AM, 9:30 AM, 10:00 AM, and a custom time) to capture the open price at the start of each session.
For each session, it plots a horizontal line at the 1-minute open price, extending from the session start to the market close at 4:00 PM EST.
Each line is accompanied by a label positioned 5 bars to the right of the market close (4:00 PM EST), with the text right-aligned and vertically centered on the line.
Users can enable/disable each marker, customize the session time, label text, line color, and text color via the indicator’s settings.
Pivot Highs and Lows:
The indicator calculates pivot highs and lows on the current chart timeframe using the ta.pivothigh and ta.pivotlow functions.
Pivot highs are marked with green triangles above the bars, and pivot lows are marked with red triangles below the bars.
The pivot period (lookback/lookforward) is user-configurable, allowing flexibility in detecting short-term or longer-term reversals.
Custom Candlesticks:
The indicator overlays custom candlesticks on the chart, colored green for bullish candles (close > open) and red for bearish candles (close < open).
This feature helps visualize price action alongside the open price markers and pivot points.
Timeframe Restriction:
The indicator is designed to work on timeframes of 1 hour or less. If the chart timeframe exceeds 1 hour (e.g., 4-hour, daily), a warning label ("Timeframe > 1H\nIndicator Disabled") is displayed, and no elements are plotted.
Customizable Appearance:
Users can customize the appearance of the open price marker lines, including the line style (solid, dashed, dotted) and line width.
Labels for the open price markers have no background (transparent) and use customizable text colors.

Elephant Bars
**Elephant Bars Indicator**
This indicator identifies and highlights candlesticks that are significantly larger than the recent average candlestick size. It helps traders quickly spot strong price movements.
- **Percentage Threshold:** The candlestick must be this much larger than the average of the last 5 candles (default is 50%).
- **Body Percentage Threshold:** The candle body must be at least this percentage of the total candle size (default is 80%).
- **Border Color:** Sets the color of the highlighted candle's border.
- **Border Thickness:** Sets the thickness of the border around the highlighted candle.
**How It Works:**
1. The script calculates the size of the current candlestick and its body.
2. It computes the average size of the last 5 candlesticks.
3. The indicator highlights candles that are both significantly larger than the average size and have a body that is a substantial portion of the total candle size.
This indicator is particularly useful for identifying potential breakout or reversal points, as large candlesticks often signify strong market sentiment.
Feel free to tweak the description to better fit your needs! 🚀