IsAlgo - AI Trend Strategy► Overview:
The AI Trend Strategy employs a combination of technical indicators to guide trading decisions across various markets and timeframes. It uses a custom Super Trend indicator and an Exponential Moving Average (EMA) to analyze market trends and executes trades based on specific candlestick patterns. This strategy includes options for setting stop losses, take profit levels, and features an alert system for trade notifications.
► Description:
This strategy focuses on identifying the optimal "entry candle," which signals either a potential correction within the ongoing trend or the emergence of a new trend. The entry criteria for this candle are highly customizable, allowing traders to specify dimensions such as the candle's minimum and maximum size and body ratio. Additional settings include whether this candle should be the highest or lowest compared to recent candles and if a confirmation candle is necessary to validate the entry.
The Super Trend indicator is central to the strategy’s operation, dictating the direction of trades by identifying bullish or bearish trends. Traders have the option to configure trades to align with the direction of the trend identified by this indicator, or alternatively, to take positions counter to the trend for potential reversal strategies. This flexibility can be crucial during varying market conditions.
Additionally, the strategy incorporates an EMA alongside the Super Trend indicator to further analyze trend directions. This combined approach aims to reduce the occurrence of false signals and improve the strategy's overall trend analysis.
The learning algorithm is a standout feature of the AI Trend Strategy. After accumulating data from a predefined number of trades (e.g., after the first 100 trades), the algorithm begins to analyze past performances to identify patterns in wins and losses. It considers variables such as the distance from the current price to the trend line, the range between the highest and lowest prices during the trend, and the duration of the trend. This data informs the algorithm's predictions for future trades, aiming to improve accuracy and reduce losses by adapting to the evolving market conditions.
► Examples of Trade Execution:
1. In an Uptrend: The strategy might detect a suitable entry candle during a correction phase, which aligns with the continuing uptrend for a potential long trade.
2. In a Downtrend: Alternatively, the strategy might identify an entry candle at the end of a downtrend, suggesting a potential reversal or correction where a long trade could be initiated.
3. In an Uptrend: The strategy may also spot an entry candle at the end of an uptrend and execute a short trade, anticipating a reversal or significant pullback.
4. In a Downtrend: The strategy might find a suitable entry candle during a correction phase, indicating a continuation of the downtrend for a potential short trade.
These examples illustrate how the strategy identifies potential trading opportunities based on trend behavior and candlestick patterns.
► Features and Settings:
⚙︎ Trend: Utilizes a custom Super Trend indicator to identify the direction of the market trend. Users can configure the strategy to execute trades in alignment with this trend, take positions contrary to the trend, or completely ignore the trend information for their trading decisions.
⚙︎ Moving average: Employs an Exponential Moving Average (EMA) to further confirm the trend direction indicated by the Super Trend indicator. This setting can be used in conjunction with the Super Trend or disabled if preferred.
⚙︎ Entry candle: Defines the criteria for the candle that triggers a trade. Users can customize aspects such as the candle's size, body, and its relative position to previous candles to ensure it meets specific trading requirements before initiating a trade.
⚙︎ Learning algorithm: This component uses historical trade data to refine the strategy. It assesses various aspects of past trades, such as price trends and market conditions, to make more informed trading decisions in the future.
⚙︎ Trading session: Users can define specific trading hours during which the strategy should operate, allowing trades to be executed only during preferred market periods.
⚙︎ Trading days: This option enables users to specify which days the strategy should be active, providing the flexibility to avoid trading on certain days of the week if desired.
⚙︎ Backtesting: Enables a period during which the strategy can be tested over a selected start and end date, with an option to deactivate this feature if not needed.
⚙︎ Trades: Detailed configuration options include the direction of trades (long, short, or both), position sizing (fixed or percentage-based), the maximum number of open trades, and limitations on the number of trades per day or based on trend changes.
⚙︎ Trades Exit: Offers various strategies for exiting trades, such as setting limits on profits or losses, specifying the duration a trade should remain open, or closing trades based on trend reversal signals.
⚙︎ Stop loss: Various methods for setting stop losses are available, including fixed pips, based on Average True Range (ATR), or utilizing the highest or lowest price points within a designated number of previous candles. Another option allows for closing the trade after a specific number of candles moving in the opposite direction.
⚙︎ Break even: This feature adjusts the stop loss to a break-even point under certain conditions, such as reaching predefined profit levels, to protect gains.
⚙︎ Trailing stop: The trailing stop feature adjusts the stop loss as the trade moves into profit, aiming to secure gains while potentially capturing further upside.
⚙︎ Take profit: Up to three take profit levels can be established using various methods, such as a fixed amount of pips, risk-to-reward ratios based on the stop loss, ATR, or after a set number of candles that move in the direction of the trade.
⚙︎ Alerts: Includes a comprehensive alert system that informs the user of all significant actions taken by the strategy, such as trade openings and closings. It supports placeholders for dynamic values like take profit levels, stop loss prices, and more.
⚙︎ Dashboard: Provides a visual display of detailed information about ongoing and past trades on the chart, helping users monitor the strategy’s performance and make informed decisions.
► Backtesting Details:
Timeframe: 15-minute BTCUSD chart.
Initial Balance: $10,000.
Order Size: 4% of equity per trade.
Commission: 0.01%.
Slippage: 5 ticks.
Risk Management: Strategic stop loss settings are applied based on the most extreme price points within the last 18 candles.
Cerca negli script per "Candlestick"

Engulfing CandlesThis script serves as the "Engulfing Candles" indicator in TradingView. Here's what it does:
- It identifies bullish candlestick patterns where the current candle's high is lower than the previous candle's high, the current candle's low is higher than the previous candle's low, the current candle's close is higher than the previous candle's close, and the current candle's open is higher than the previous candle's open. It also identifies bearish candlestick patterns where the conditions are reversed.
- The indicator colors bullish candles in a specific color (Yellow Green) to visually highlight the bullish pattern, and colors bearish candles in another color (Purple pink) to visually highlight the bearish pattern.
- Additionally, it triggers an alert when either the bullish or bearish triangle shape appears, notifying traders with the message "A Southern Star Shadows pattern has appeared!"

Heikin Ashi and Optimized Trend Tracker and PVSRA [Erebor]Heikin Ashi Candles
Let's consider a modification to the traditional “Heikin Ashi Candles” where we introduce a new parameter: the period of calculation. The traditional HA candles are derived from the open , high low , and close prices of the underlying asset.
Now, let's introduce a new parameter, period, which will determine how many periods are considered in the calculation of the HA candles. This period parameter will affect the smoothing and responsiveness of the resulting candles.
In this modification, instead of considering just the current period, we're averaging or aggregating the prices over a specified number of periods . This will result in candles that reflect a longer-term trend or sentiment, depending on the chosen period value.
For example, if period is set to 1, it would essentially be the same as traditional Heikin Ashi candles. However, if period is set to a higher value, say 5, each candle will represent the average price movement over the last 5 periods, providing a smoother representation of the trend but potentially with delayed signals compared to lower period values.
Traders can adjust the period parameter based on their trading style, the timeframe they're analyzing, and the level of smoothing or responsiveness they prefer in their candlestick patterns.
Optimized Trend Tracker
The "Optimized Trend Tracker" is a proprietary trading indicator developed by TradingView user ANIL ÖZEKŞİ. It is designed to identify and track trends in financial markets efficiently. The indicator attempts to smooth out price fluctuations and provide clear signals for trend direction.
The Optimized Trend Tracker uses a combination of moving averages and adaptive filters to detect trends. It aims to reduce lag and noise typically associated with traditional moving averages, thereby providing more timely and accurate signals.
Some of the key features and applications of the OTT include:
• Trend Identification: The indicator helps traders identify the direction of the prevailing trend in a market. It distinguishes between uptrends, downtrends, and sideways consolidations.
• Entry and Exit Signals: The OTT generates buy and sell signals based on crossovers and direction changes of the trend. Traders can use these signals to time their entries and exits in the market.
• Trend Strength: It also provides insights into the strength of the trend by analyzing the slope and momentum of price movements. This information can help traders assess the conviction behind the trend and adjust their trading strategies accordingly.
• Filter Noise: By employing adaptive filters, the indicator aims to filter out market noise and false signals, thereby enhancing the reliability of trend identification.
• Customization: Traders can customize the parameters of the OTT to suit their specific trading preferences and market conditions. This flexibility allows for adaptation to different timeframes and asset classes.
Overall, the OTT can be a valuable tool for traders seeking to capitalize on trending market conditions while minimizing false signals and noise. However, like any trading indicator, it is essential to combine its signals with other forms of analysis and risk management strategies for optimal results. Additionally, traders should thoroughly back-test the indicator and practice using it in a demo environment before applying it to live trading.
PVSRA (Price, Volume, S&R Analysis)
“PVSRA” (Price, Volume, S&R Analysis) is a trading methodology and indicator that combines the analysis of price action, volume, and support/resistance levels to identify potential trading opportunities in financial markets. It is based on the idea that price movements are influenced by the interplay between supply and demand, and analyzing these factors together can provide valuable insights into market dynamics.
Here's a breakdown of the components of PVSRA:
• Price Action Analysis: PVSRA focuses on analyzing price movements and patterns on price charts, such as candlestick patterns, trendlines, chart patterns (like head and shoulders, triangles, etc.), and other price-based indicators. Traders using PVSRA pay close attention to how price behaves at key support and resistance levels and look for patterns that indicate potential shifts in market sentiment.
• Volume Analysis: Volume is an essential component of PVSRA. Traders monitor changes in trading volume to gauge the strength or weakness of price movements. An increase in volume during a price move suggests strong participation and conviction from market participants, reinforcing the validity of the price action. Conversely, low volume during price moves may indicate lack of conviction and potential reversals.
• Support and Resistance (S&R) Analysis: PVSRA incorporates the identification and analysis of support and resistance levels on price charts. Support levels represent areas where buying interest is expected to be strong enough to prevent further price declines, while resistance levels represent areas where selling interest may prevent further price advances. These levels are often identified using historical price data, trendlines, moving averages, pivot points, and other technical analysis tools.
The PVSRA methodology combines these three elements to generate trading signals and make trading decisions. Traders using PVSRA typically look for confluence between price action, volume, and support/resistance levels to confirm trade entries and exits. For example, a bullish reversal signal may be considered stronger if it occurs at a significant support level with increasing volume.
It's important to note that PVSRA is more of a trading approach or methodology rather than a specific indicator with predefined rules. Traders may customize their analysis based on their preferences and trading style, incorporating additional technical indicators or filters as needed. As with any trading strategy, risk management and proper trade execution are essential components of successful trading with PVSRA.
The following types of moving average have been included: "SMA", "EMA", "SMMA (RMA)", "WMA", "VWMA", "HMA", "KAMA", "LSMA", "TRAMA", "VAR", "DEMA", "ZLEMA", "TSF", "WWMA". Thanks to the authors.
Thank you for your indicator “Optimized Trend Tracker”. © kivancozbilgic
Thank you for your indicator “PVSRA Volume Suite”. © creengrack
Thank you for your programming language, indicators and strategies. © TradingView
Kind regards.
© Erebor_GIT

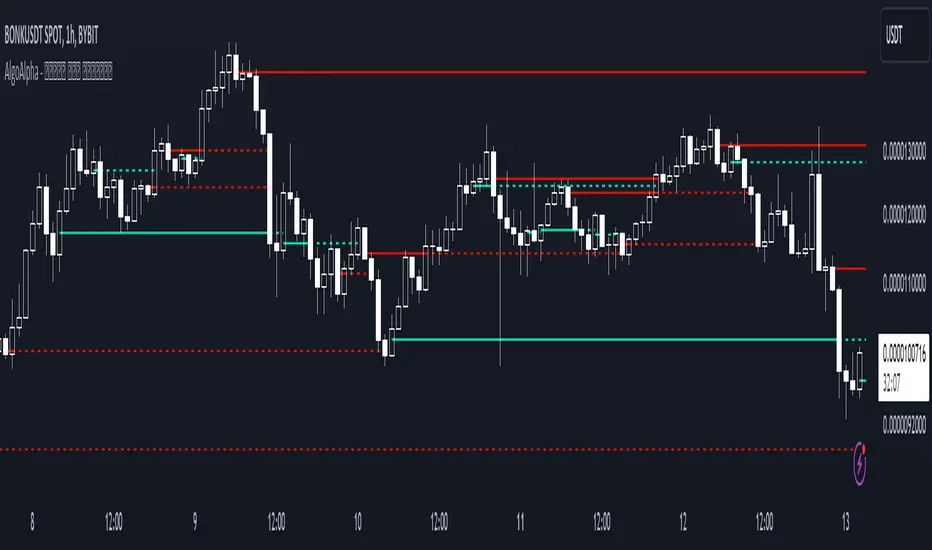
Peak & Valley Levels [AlgoAlpha]The Peak & Valley Levels indicator is a sophisticated script designed to pinpoint key support and resistance levels in the market. By utilizing candle length and direction, it accurately identifies potential reversal points, offering traders valuable insights for their strategies.
Core Components:
Peak and Valley Detection: The script recognizes peaks and valleys in price action. Peaks (potential resistance levels) are identified when a candle is longer than the previous one, changes direction, and closes lower, especially on lower volume. Valleys (potential support levels) are detected under similar conditions but with the candle closing higher.
Color-Coded Visualization:
Red lines mark resistance levels, signifying peaks in the price action.
Green lines indicate support levels, representing valleys.
Dynamic Level Adjustment: The script adapts these levels based on ongoing market movements, enhancing their relevance and accuracy.
Rejection Functions:
Bullish Rejection: Determines if a candlestick pattern rejects a level as potential support.
Bearish Rejection: Identifies if a pattern rejects a level as possible resistance.
Usage and Strategy Integration:
Visual Aid for Support and Resistance: The indicator is invaluable for visualizing key market levels where price reversals may occur.
Entry and Exit Points: Traders can use the identified support and resistance levels to fine-tune entry and exit points in their trading strategies.
Trend Reversal Signals: The detection of peaks and valleys serves as an early indicator of potential trend reversals.
Application in Trading:
Versatile for Various Trading Styles: This indicator can be applied across different trading styles, including swing trading, scalping, or trend-following approaches.
Complementary Tool: For best results, it should be used alongside other technical analysis tools to confirm trading signals and strategies.
Customization and Adaptability: Traders are encouraged to experiment with different settings and timeframes to tailor the indicator to their specific trading needs and market conditions.
In summary, the Peak & Valley Levels by AlgoAlpha is a dynamic and adaptable tool that enhances a trader’s ability to identify crucial market levels. Its integration of candlestick analysis with dynamic level adjustment offers a robust method for spotting potential reversal points, making it a valuable addition to any trader's toolkit.
NisonCandleScannerNison Candle Scanner (NCS) - the only indicator personally designed and tested by the acknowledged Western world’s top candlestick expert Steve Nison. Harness the proprietary technology of NCS to reveal important candle signals to quickly uncover potential entry and exit signals in any market and time frame. NCS is easy to set up and use... Discover for yourself how quickly it will boost your trading and investing confidence.
*Highlight 28 different candle patterns in either standard or strict criteria
*Strict Criteria candle patterns provide a tighter and higher quality definition of a pattern
*Utilize either pattern abbreviations or full names highlighted on your charts
*Scan for and be alerted to any or all of the candle patterns in any time frame, and any market
I’ve spent over 30 years totally immersed in candlestick charting techniques and using them correctly to help traders and investors around the world (my book has been translated in 22 languages and we have students from over 85 countries.)
Now using my decades of real world experience, I designed the easy to use tools in Nison Candle Scanner™ (NCS) to highlight, scan, and alert you to the 28 most powerful candle patterns that I personally use in my own trading. The research into this software was originally intended to save me hours of time to find in minutes the best potential setups in any market and any time frame. I’ve now opened up the power of NCS to TradingView and all of its users.
Since candle signals require both the correct shape of the candle lines AND the correct prior trend, we derived our proprietary formula to accurately take trend and the shape of the candle lines to ensure accurate results.
NCS will highlight these candle patterns for you in either full name or abbreviations, scan for any or all 28 of those patterns in your watchlists and time frames of choice, and then alert you to these critical candle signals in real time!
NCS will help you quickly find potential entry/exit points in any market and time frame before your competition.
Example of Highlighting Patterns with either Full Names or Pattern Abbreviations
Select between Yes, No, or Strict on 28 Different Candle Patterns
Bull :
Hammer
Inverted Hammer
Bull Counter Attack
Bullish Engulfing
Bull Harami
Piercing
Bull Sash
Bull Seperating Line
Tweezers Bottom
Rising Window
Morning Star
Rising Three
Three White Soldiers
Bear
Hanging Man
Shooting Star
Bear Counter Attack
Bearish Engulfing
Bear Harami
Dark Cloud Cover
Bear Sash
Bear Seperating Line
Tweezers Top
Falling Window
Evening Star
Falling Three
Three Black Crows
Neutral
Doji
High Wave
Scan for and Be alerted to any or all of the 28 patterns in your watchlists and timeframes
For those with proper candle education, the ability to highlight, scan, and be alerted to candle patterns will aide in identifying reversal and continuation patterns. Utilize Nison Candle Scanner to find the best potential setups that fit your criteria!

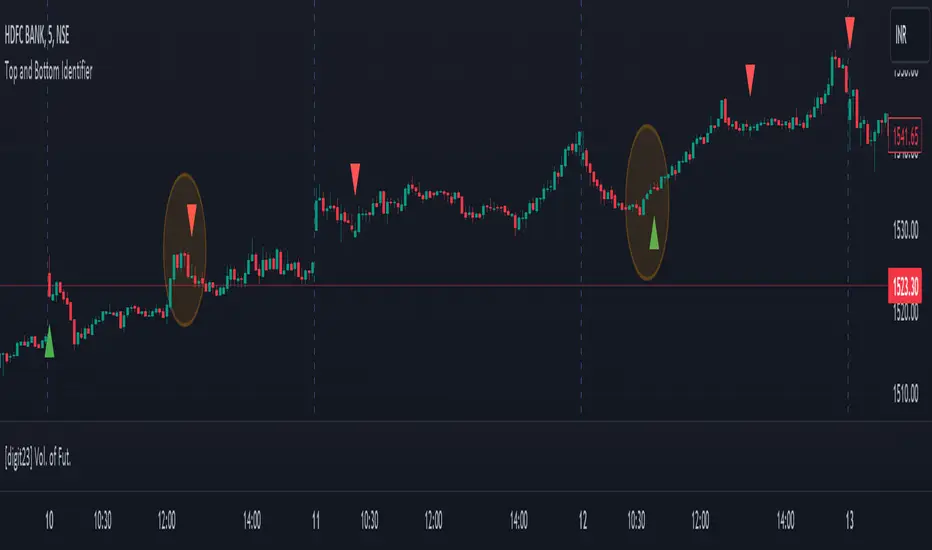
Top and Bottom Identifier [digit23]This indicator is designed to identify potential market tops and bottoms based on customizable conditions. It employs price action analysis, considering candlestick patterns, body size, and recent price history. Traders can adjust parameters like the threshold multiplier and body size multiplier to fine-tune sensitivity.
Features:
Identifies potential tops and bottoms.
Customizable threshold and body size multipliers.
Utilizes price action analysis exclusively.
User-friendly and visually represented on the chart.
Usage:
Red Triangles: Indicate potential market tops.
Green Triangles: Indicate potential market bottoms.
Parameters:
Threshold Multiplier: Adjusts sensitivity.
Body Size Multiplier: Controls the significance of candlestick body size.
Note:
This indicator is for traders preferring price action analysis to identify potential reversals. It's recommended to use alongside other technical analysis tools for comprehensive trading decisions.
Disclaimer:
Trading involves risk; thorough analysis is crucial before making decisions. This indicator is a tool for technical analysis and should be part of a broader trading strategy.
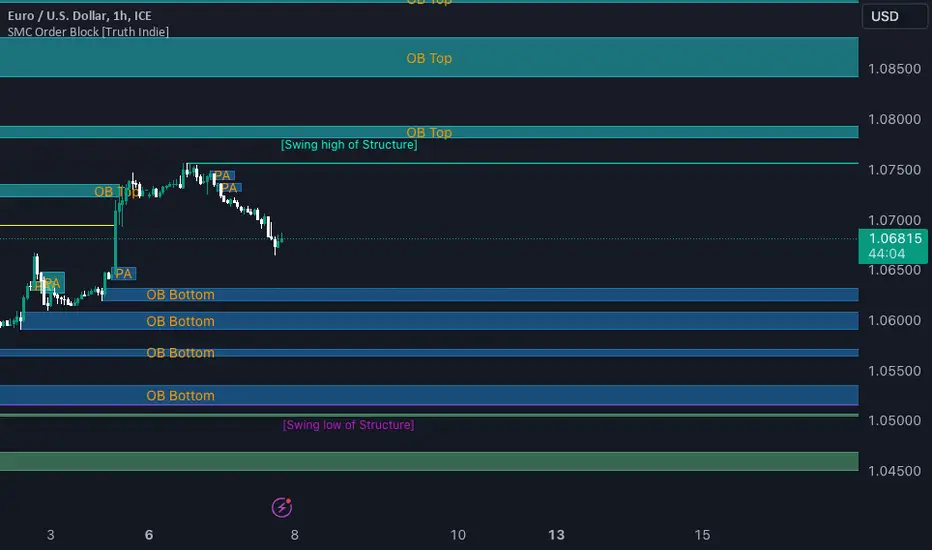
SMC Order Block [Truth Indie]Smart Money Concept (SMC)
For me, SMC is a trading philosophy that stems from those with knowledge and understanding of the structure of the Smart Money group's trading system. It is developed through the observation of price behavior.
SMC is related to the Smart Money group or those entities that can influence the market, such as financial institutions, banks, or funds. Market movements are often driven by market fundamentals or economics. The Smart Money group possesses extensive research data for analyzing the market's fundamentals and has the ability to steer the market in various directions based on market and economic fundamentals at a given time.
The SMC concept is adapted from the ICT concept, and it was developed and shared by The Inner Circle Trader.
I have been studying and trying to understand SMC for some time, and I have many questions I would like to explore. The challenge lies in the fact that different sources of knowledge on this topic often have varying teachings, and my proficiency in the English language is limited. As a result, I haven't had the opportunity to study from the primary source, The Inner Circle Trader.
This indicator was created for the purpose of researching Market Structure and Order Blocks, which are integral parts of the SMC Concept.
The fundamental principle for identifying Order Blocks is as follows:
1.Locate swings that create candlestick imbalances.
2.An imbalance refers to a candlestick that is larger than the preceding one and contains a Fair Value Gap (FVG).
This indicator categorizes Order Blocks into four types, and you are encouraged to customize them to suit your preferences.
OB Type1
1.The closing price of candle has an opposite direction to the candle .
2.Candle has a wick longer than its body, by at least 1 times or more (adjustable).
3.Candle has a wick longer than candle , by at least 2 times or more (adjustable).
4.There is a Fair Value Gap (FVG) between the wicks of candle and .
OB Type1_HTF
-This condition is the same as OB Type1, but it involves analyzing 6 candles instead. This means looking at a larger time frame, twice as big as the original one.
OB Type2
1.The closing price of candle has the opposite direction to candle .
2.Candle has a body larger than its wick by at least 1 times or more (adjustable).
3.Candle has a body larger than candle by at least 2 times or more (adjustable).
4.There is a Fair Value Gap (FVG) between the wicks of candle and .
OB Type2_HTF means observing a larger time frame, specifically twice as big as the previous one.
OB Type3
1.The closing price of candle has the same direction as candle .
2.Candle has a wick longer than its body, by at least 1 times or more (adjustable).
3.Candle has a wick longer than candle , by at least 2 times or more (adjustable).
4.There is a Fair Value Gap (FVG) between the wicks of candle and .
OB Type3_HTF means observing a larger time frame, specifically twice as big as the previous one.
OB Type4
1.The closing price of candle has the same direction as candle .
2.Candle has a body larger than its wick by at least 1 times or more (adjustable).
3.Candle has a body larger than candle by at least 2 times or more (adjustable).
4.There is a Fair Value Gap (FVG) between the wicks of candle and .
OB Type4_HTF is an indicator that involves looking at a larger time frame, specifically twice as big as the original one.
Order Block Setting
1.Click to activate the OB search in different Types.
2.Adjust the body of the candle .
3.Adjust the strength of the candle or the Imbalance candle.
4.You can change the name of OB.
5.Adjust the font size and color.
6.Adjust the color of the OB BOX and History BOX.
7.Adjust the font of OB HTF.
1.It refers to the value of W for a specific candle.
2.It refers to the value of Im for a specific candle.
3.It refers to the values of W and Im in the HTF.
4.For OB Type1 and Type3, a higher W value will search for candles with a larger wick and a smaller body. When the W value is lower, it will search for candles with a smaller wick and a larger body, moving from low to high.
5.For OB Type2 and Type4, a lower W value will search for candles with a smaller wick and a larger body. When the W value is higher, it will search for candles with a larger wick and a smaller body, moving from high to low.
Market Structure
Comprising the process of breaking the price structure, resulting in BOS (Breakout of Structure) or CHoCH (Change of Character High), and creating new High or Low based on the price structure.
1.When the market forms a price structure with High and Low, when the price moves to disrupt the structure in either direction, it will lead to BOS or CHoCH, resulting in a new High or Low. You can adjust the method of breaking the structure using the close, high, or low.
2.When you break the price structure, a High or Low will be formed on one side, and it will lead to an Inducement Swing. When the price moves and collides, it will create a price range of High and Low. You can adjust the method of breaking the structure using the close, high, or low.
3.There is an option for testing Fibonacci (Fibo). Its function is similar to the Inducement Swing. You can adjust the Fibonacci settings.
Premium & Discount Zone
1.The Premium & Discount Zone will appear based on the current price structure. It helps you see the price zones you are interested in.
2.You can adjust the %Premium & Discount as needed.
3.The OB (Order Block) will be displayed when a price structure of High and Low forms within the Premium & Discount Zone. The OB in this indicator is not a recommendation to buy or sell. You need to research and test various conditions before making trading decisions.
Everyone's trading strategies are different, and it comes down to backtesting and selecting the strategy that suits your individual needs. Hopefully, this indicator will assist the TradingView community of traders in their trading endeavors.
Contraction Box & Doji LinesContraction & Doji Lines indicator is designed to identify and visualize potential support and resistance levels on a price chart. It does this by detecting doji candlestick patterns and drawing horizontal lines from the middle of the doji bodies to the right. Additionally, it also highlights price contraction zones with colored boxes.
The indicator first identifies doji candlestick patterns that it suggests indecision in the market, a horizontal line and these horizontal lines can act as potential support or resistance levels. Traders can observe price reactions around these lines. If the price approaches a line and bounces off it, it may indicate a significant level in the market.
In addition to doji lines, this indicator also highlights price contraction zones. When a contraction zone is detected, a colored box is drawn to highlight this zone. The box extends from the fifth bar ago (left side) to the current bar (right side), with the highest high and lowest low of the identified zone. The color and width of this box can be customized using the "Box Line Border Color," "Box Background Color," and "Box Width" parameters.
A possible strategy could be can use the doji lines as potential support and resistance levels to make trading decisions. For example, if the price breaks above a doji line and holds, it may indicate a bullish signal.
The colored boxes highlight areas of price contraction, which often precede significant price movements. Traders can use these zones to anticipate potential breakouts or breakdowns.
For example, you might enter a long (buy) position if it anticipate a breakout from a contraction zone with a target price set above the breakout level. Conversely, you might enter a short (sell) position if they anticipate a breakdown from a contraction zone with a target price set below the breakdown level.

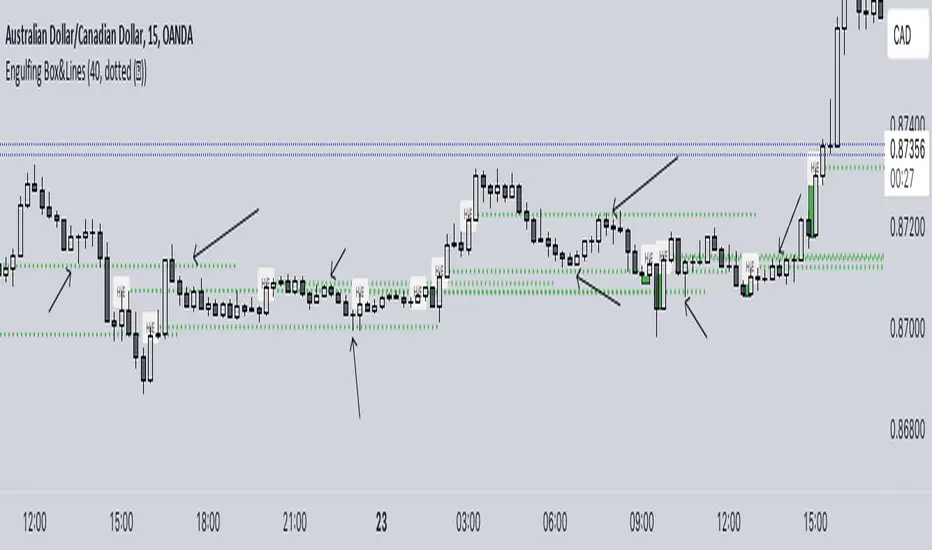
Engulfing Box & LinesThe "Engulfing Box & Lines" indicator aims to spot and highlight Engulfing candlestick patterns within a trend. These patterns can provide valuable indications of a possible trend reversal, and the indicator underlines them through the use of colored rectangles and horizontal lines. To fully understand the functioning and use of this indicator, let's explore its key elements and associated strategies.
Identification of Engulfing Patterns:
The indicator focuses on detecting two types of Engulfing candles:
Bullish Engulfing: Occurs when a bullish candle (open lower than close) completely encloses the body of the previous bearish candle. This could indicate a possible upside reversal.
Bearish Engulfing: Occurs when a bearish candle (opening higher than closing) entirely engulfs the body of the previous bullish candle. This could signal a potential bearish reversal.
Using the EMA 200:
The indicator uses the 200-period Exponential Moving Average (EMA) as a reference to determine the position of the candles with respect to the long-term trend. When the price is above the 200 EMA, the bullish Engulfing candles are highlighted with a green box, while below the 200 EMA, red boxes are shown for the bearish Engulfing candles.
Size of Boxes and Lines:
The colored boxes represent the size of the body of the candle that caused the Engulfing. Additionally, a horizontal line is drawn close to the body of the candle, serving as the fulcrum of the indicator.
Trading Strategies:
This indicator can be used for different trading strategies:
Trend Continuation: During a positive trend, the onset of an engulfing pattern suggests a possible continuation of the trend. The horizontal lines represent potential support areas, where the price could bounce. Traders might consider buying during such bounces.
Retracements and Entries: Lines can act as support or resistance zones, depending on the trend. When the price approaches a line, a retracement could occur. Traders might move to a lower timeframe to spot entry signals, using the line as a reference.
Closing Positions: Lines could also be used to define exit levels. For example, a trader might decide to exit a position when the price approaches a resistance line.
Confirmations with Other Indicators: The indicator could be used in conjunction with other technical tools, such as oscillators or candlestick analysis, to confirm signals and improve the accuracy of trading decisions.
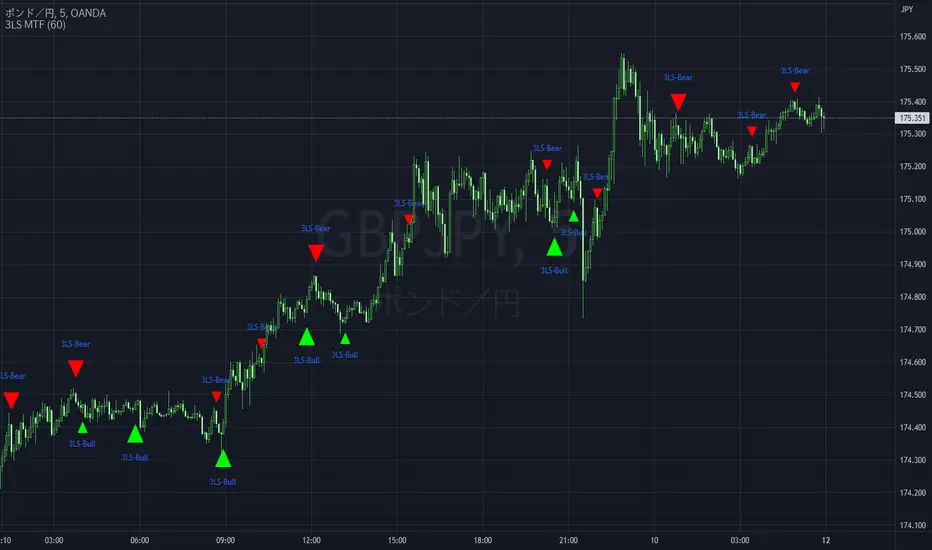
3 Line Strike MTF [MsF]Japanese below / 日本語説明は英文の後にあります。
-------------------------
*This indicator is based on TheTrdFloor's "3 Line Strike ". It's a very cool indicator. thank you.
In addition to the original indicator, it will be judged Engulfing only when the display of the MTF signal and the candle have a difference of 2 times or more.
=== Function description ===
1. Display of the MTF signal
Detects Engulfing of the specified Multi Time Frame. MTF Engulfing is displayed with 🍆 and 🍑.
2. Judged Engulfing on a difference of 2 times or more
Show a signal if the body of the current candle is more than twice as large as the body of the previous candle. This will make the signal mark appear larger than normal.
=== Parameter description ===
- COMMON SETTING
- Show Signal on MTF ? … If the check this, you can get MTF 3 Line Strike
- Judge Double Engulfing ? … If you check it, the signal will come up only when the Engulfing has doubled or more.
- 3 LINE STRIKE
- Show Bearish 3 Line Strike … The Bearish 3 Line Strike (3LS-Bear) is a candlestick pattern comprised of 3 bullish (green) candles, followed by a bearish engulfing candle (see 'Big A$$ Candles' below). This pattern tends to be best used as a signal of the end of a retracement period as part of a trend continuation strategy. Default: Checked
- Show Bullish 3 Line Strike … The Bullish 3 Line Strike (3LS-Bull) is a candlestick pattern comprised of 3 bearish (red) candles, followed by a bullish engulfing candle (see 'Big A$$ Candles' below). This pattern tends to be best used as a signal of the end of a retracement period as part of a trend continuation strategy. Default: Checked
- BIG A$$ CANDLES
- Show Bearish Big A$$ Candles … Bearish 'Big A$$ Candles' are the same as Bearish Engulfing candles.
- Show Bullish Big A$$ Candles … Bullish 'Big A$$ Candles' are the same as Bullish Engulfing candles.
-------------------------
本来のインジケーターに、①MTFシグナルの表示と②ローソク足の表示に2倍以上の差がある場合のみ包み足の判定を追加しました。
=== 機能説明 ===
1. MTFシグナルの表示
指定された時間足の包み足を検出します。 🍆 と 🍑 で表示されます。
2. 2倍以上の差で包み足判定
現在のローソクの実体が前のローソクの実体よりも 2 倍以上大きい場合にシグナルを表示します。マークは通常よりも大きく表示されます。
=== パラメータの説明 ===
- COMMON SETTING
- Show Signal on MTF ? … MTFシグナルを表示します
- Judge Double Engulfing ? … 包み足が前の足の2倍以上になった場合のみシグナルを発報します
- 3 LINE STRIKE
- Show Bearish 3 Line Strike … 陰線が3連続続いた後の包み足を検出します
- Show Bullish 3 Line Strike … 陽線が3連続続いた後の包み足を検出します
- BIG A$$ CANDLES
- Show Bearish Big A$$ Candles … 陽線の包み足を検出します
- Show Bullish Big A$$ Candles … 陰線の包み足を検出します
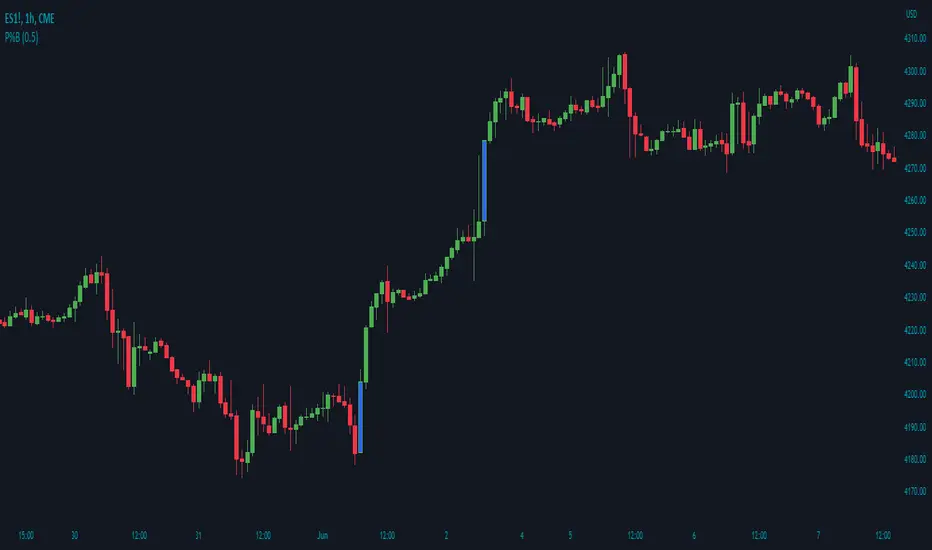
Price Percentage Breakout by Time PeriodDescription:
The Price Percentage Breakout by Time Period (P%BTP) indicator is a technical analysis tool designed to identify potential breakout signals based on the percentage change in price over a specified lookback period. It helps traders identify significant price movements that exceed a user-defined threshold, indicating potential trading opportunities.
How it Works:
The P%BTP indicator calculates the percentage change between the open and close prices of each candle. It compares this percentage change to the highest percentage change observed over the specified lookback period. When the percentage change exceeds or equals this highest value, it indicates a potential breakout signal. The indicator colors the bars on the chart based on whether it's a bullish or bearish breakout.
Usage:
To effectively utilize the Price Percentage Breakout by Time Period indicator, follow these steps:
1. Apply the P%BTP indicator to your chart by adding it from the available indicators.
2. Customize the input settings to suit your preferences. You can define the lookback period, which determines the number of bars used for calculating the percentage change, as well as choose colors for bullish and bearish breakouts.
3. Observe the bars on the chart:
- Bars highlighted in the bullish color indicate potential bullish breakout signals.
- Bars highlighted in the bearish color indicate potential bearish breakout signals.
4. Interpret the breakout signals:
- A bullish breakout signal occurs when the percentage change in price exceeds or equals the highest percentage change observed over the lookback period, indicating a potential upward movement.
- A bearish breakout signal occurs when the percentage change in price exceeds or equals the highest percentage change observed over the lookback period, indicating a potential downward movement.
5. Consider additional analysis:
- Combine the breakout signals from the P%BTP indicator with other technical analysis tools, such as support and resistance levels, trend lines, or candlestick patterns, to confirm potential trade setups.
6. Implement appropriate risk management strategies, including setting stop-loss orders and position sizing, to manage your trades effectively and protect your capital.
Note: The Price Percentage Breakout by Time Period indicator provides insights into potential breakout signals based on the percentage change in price over a specified lookback period. However, it is recommended to use this indicator in conjunction with other technical analysis tools and perform thorough analysis before making trading decisions.

Price Percentage Breakout by Chosen PercentageDescription:
The Price Percentage Breakout indicator (P%B) is a technical analysis tool designed to identify potential breakout signals based on percentage changes in price. It helps traders identify significant price movements that exceed a specified threshold, indicating potential trading opportunities.
How it Works:
The Price Percentage Breakout indicator calculates the percentage change between the open and close prices of each candle. It compares this percentage change to a user-defined threshold to determine if a breakout has occurred. When the percentage change exceeds the threshold, indicating a significant price movement, the indicator highlights the breakout on the chart. Additionally alerts can be created by the user that display the percentage of the breakout.
Usage:
To effectively utilize the Price Percentage Breakout indicator, follow these steps:
1. Apply the P%B indicator to your chart by adding it from the available indicators.
2. Customize the input settings to suit your preferences. You can choose the color for highlighting the breakout and set the percentage threshold for detecting breakouts.
3. Observe the bars on the chart:
- Bars highlighted in the chosen color indicate potential breakout signals.
4. Interpret the breakout signals:
- A breakout signal occurs when the percentage change in price exceeds the specified threshold. This suggests a significant price movement.
5. Consider additional analysis:
- Combine the breakout signals from the Price Percentage Breakout indicator with other technical analysis tools, such as support and resistance levels, trend lines, or candlestick patterns, to confirm potential trade setups.
6. Implement appropriate risk management strategies, including setting stop-loss orders and position sizing, to manage your trades effectively and protect your capital.
Note: The Price Percentage Breakout indicator provides insights into potential breakout signals based on percentage changes in price. However, it is recommended to use this indicator in conjunction with other technical analysis tools and perform thorough analysis before making trading decisions.
Open High Low StrategyThis is a very simple, yet effective and to some extend widely followed scalping strategy to capture the underling sentiments of the counter whether it will go up or down.
What is it?
This is Open-High-Low (OLH) strategy.
As you already aware of Candlestick patterns, there is patterns called as Marubozu patterns where the sell wick or buy wick either ceases to exists (or very small). This is exactly in the same principle.
In OLH strategy: The buy signal appears when the Open Price is the Low Price. It means if you draw the candlestick, there is no bottom wick. So after the opening of the candle, the demand drives the price up to the level, some selling may or may not come and closes in green. This indicates a strong upward biasness of the underlying counter.
Similarly, a sell signal appears when the Open price is the High Price. It means there is no upper wick. So there is no buying pressure, since the opening of the candle, sellers are in force and pulls down the price to a closing.
This strategy generates the signal at the close of the candle (technically barstate.isconfirmed). Because until the bar is real-time there is no option to know the final closing or high. So you will see the bar on which it generates the buy or sell signal is actually indicates the previous bar as OLH bar.
To determine the Stop-Loss, it uses the most widely known SL calculation of:
For buy signal, it takes the low of the last 7 candles and substract the ATR (Average True Range) of 14-period.
For sell signal, it takes the high of the last 7 candles and add it to the ATR (Average True Range) of 14-period.
One can plot the SL lines as dotted green and red lines as well to see visually.
Default Risk:Reward is 1:2, Can be customizable.
What is Unique?
Of course the utter simplistic nature of this strategy is it's key point. Very easy and intuitive to understand.
There are awesome strategies in this forum that talks about the various indicators combinations and what not.
Instead of all this, in a 15m NSE:NIFTY chart, it generates a good ~ 47% profit-factor with 1:2 Risk Reward ratio. Means if you loose a trade you will loose 1% of account and if you win you will gain 2%. Means 3 trades (2 profits and 1 loss) in a trading session result 3% overall gain for the day. (Assuming you are ready with 1% draw down of your account per trade, at max).
Disclaimer:
This piece of software does not come up with any warrantee or any rights of not changing it over the future course of time.
We are not responsible for any trading/investment decision you are taking out of the outcome of this indicator.

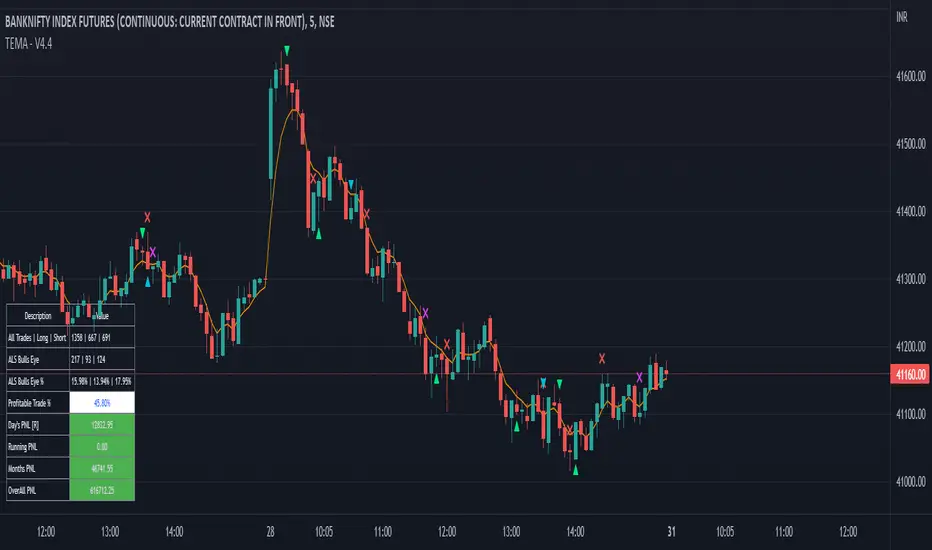
Tripple EMA Strategy - Dhan HQDear Traders,
Here with presenting the new Indicator (Strategy) which is primarily built based on the the EMA moving Average and Candlestick Pattern.
Idea behind this Indicator: I am sure every trader would have traded using Moving average one day or the other. And Moving average is theoretically they are Lagging and the EMA are used in place of Moving average just to avoid a bit of Lag to take advantage of those accuracy while avoiding the Lag. In order to be successful in trading Money Management and Risk Management is very much crucial and should be part of every trade we place.
What this indicator is providing:
Based on the EMA and candlestick patterns and using the inputs provided for RISK and Money Management options, Indicator continuously scans for trading opportunities and provides alerts for possible trades. I have tried to capture some analytical inputs for one to think and take control over the Reward, Risk and Money management parameters to tweak the indicator accordingly.
Below are the Analytical outputs provided:
1. Total Trades taken (History till present) and its profitability % & appx PNL
2. Current Dates & Yesterday's Trades along with its appx PNL
3. Long Trades performance vs Short Trades performance
4. Retrieve PNL values post specified Date in the Input settings.
5. Last 7 Days PNL
6. Month's PNL
Note: There is known BUG in the calculation where the first date of the month for Monthly PNL value is a trading Holiday then Monthly PNL is being displayed as 0. similarly this Bug is flowed for Last 7 Days PNL. This will be addressed in upcoming version along with planned release.
Alerts & Notifications:
There are basically 2 types of Alerts provided one with General Notification and Other with Dhan HQ notifications to support Algo Trades for Dhan HQ Baskets.
Overview for Dhan HQ Trade Alerts:
1. When the Day Beginning (At Session Start) Hedge Position can be placed and shall be squared off post Closing the session
2. During the course of the Day Buy & Sell Baskets shall be executed
3. Can map the Trade Level SL values
4. Can map Daily Limit for SL to avoid excessive Loss. Upon Loss you could stop trades for the complete day or you may restart the trade post completion of X no of hours.
Enjoy!
DISCLAIMER: No sharing, copying, reselling, modifying, or any other forms of use are authorized for our documents, script / strategy, and the information published with them. This informational planning script / strategy is strictly for individual use and educational purposes only. This is not financial or investment advice. Investments are always made at your own risk and are based on your personal judgement. I am not responsible for any losses you may incur. Please invest wisely.
Happy to receive suggestions and feedback in order to improve the performance of the indicator better.
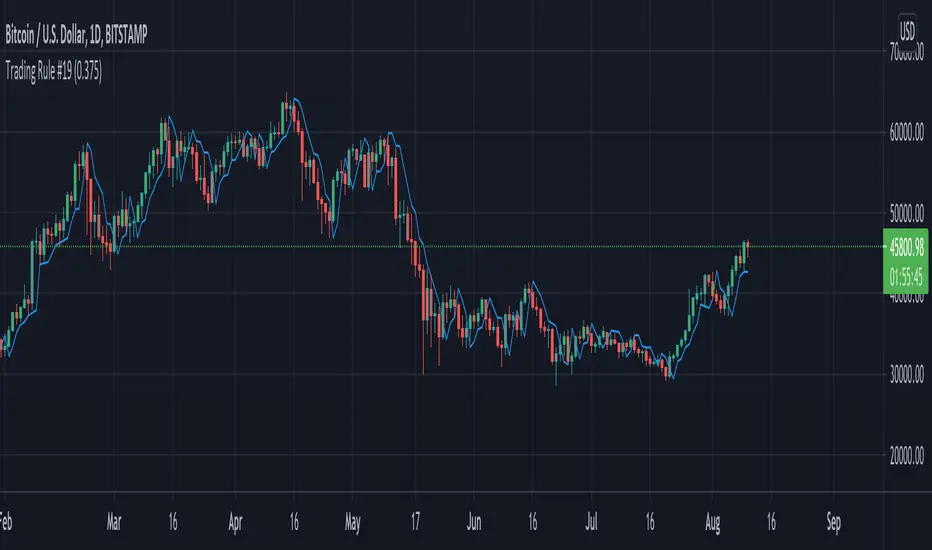
Trading Rule #19This script is based on Trading Rule #19 from Chester Keltner's book How To Make Money On Commodities. It is best applied to candlestick charts with longer time frames and plans with minimal losses (i.e. swing trades). The rule is based on "Key" trend days (this is applied to daily charts in the book).
An initial Key-Up day is established on the third day of 3 consecutive new highs. Subsequent key-up days are determined as follows:
1. The first day following an initial key-up day trades 0.375% above the previous key-up day
2. The second day or any following day trades 0.125% above the previous key-up day
An initial Key-Down day is established on the third day of 3 consecutive new lows. Subsequent key-down days are determined as follows:
1. The first day following an initial key-up day trades 0.375% below the previous key-down day
2. The second day or any following day trades 0.125% below the previous key-down day
Green candles are considered up-trend, red candles are down-trend. Gray candles are undecided - when there is a new high and low in the same time frame, when there is no new high or low in that time frame, or the order price was cleared.
Order prices are represented as a blue line, with some days being "na" when order prices remain unchanged. On key-up days, orders are placed 0.375% below the low of the previous key-up day or the day previous (whichever is lower). Order prices on key-down days are placed 0.375% above the high of the previous key-down day or the day previous (whichever is higher).
The tolerance setting mainly effects the plot point of order price, at a certain point key-trend rules will take priority over order price (meaning if tolerance is high enough, order price will have no effect on determining key-trends).
FxASTLite Strategy[ALLDYN]This strategy can be used on ANY instrument (Forex, Stocks, Cryptocurrency, etc.) AND on ANY TF (Time Frame). The purpose of me sharing this is to show people the power of using a Fibonacci-based trading system combined with Institutional market looks and how associated price action reacts and responds at these levels within the market. This is nothing new with the work that Charles Dow did with the Dow Theory and what Ralph Nelson Elliott expanded upon with the Elliott Wave principle. It is about synergism and simplicity with what works. There is no "holy grail" in trading except the one between your ears. This is just a tool to give you a confirmation with multiple built-in confluences that can be tied with an oscillator for additional confluence.
It is helpful to know Supply & Demand Zones as well as candlestick patterns and where these reversal patterns happen within the market. They are more meaningful if they happen within Supply & Demand Zones. The 4 candlestick patterns I look for in Supply & Demand Zones are Hammer/Hanging Man (Pinbar), Engulfing Candle Pattern (blended lines), Dark Cloud Cover/Piercing Candle Pattern (blended lines), and Tweezer Tops/Bottoms.
I through The Ichimoku Cloud on top of this so you can see the transitions as the market moves in its fractal nature. I use the MACD, TDI, and RSI for confirmation of what associated price action is doing on the chart. I say associated price action because nothing happens without volume. There are some built-in Volume tools in TV that give some good insight into what is happening (overall volume - VPVR, at price - session volume, & overtime - vol. )
***PURPOSE of the RIBBON***:
-The Ribbon allows you to get in at the START/BEGINNING of a Correction/Trend Change (Associated price action should always be the ENTRY condition).
-If the associated price action stays above the Ribbon, then this allows you to stay in the BUY trade longer.
*Note - Exit of the BUY trade would be if associated price action BELOW the Ribbon.
-If associated price actions stay below the Ribbon, this allows you to stay in the SELL trade longer (Associated price action should always be the ENTRY condition).
*Note - Exit of the SELL trade would be if associated price action closed ABOVE the Ribbon.
***PURPOSE of the Oracle (Solid purple line)***
-The Oracle will act as Trend confirmation and associated price action target as the Trend is TRANSITIONING
***SYSTEM FEATURES***
-Inputs (Style, Visibility = NA):
You are able to toggle ALLDYN FxASTLite from the chart.
You are able to toggle PSARs from the chart.
You are able to toggle background (Affects White/Black line)
If you suffer from any type of Color Blindness you can select different options to help.
*****DISCLAIMER*****
I am not a financial advisor or commodity trade advisor. This "TOOL" is for EDUCATIONAL PURPOSES ONLY. Any use of this financial educational tool in ANY demo/live market you do so at your own RISKS. Trading in leveraged financial markets has inherent RISKS associated with such actions. Do Not Trade Money YOU Can't Afford to LOSE.
Cumulative Volume Delta Candles Aggregated (Lite)Cumulative Volume Delta Candles Aggregated (Lite)
Multi-Exchange CVD Visualization in Candle Format
This indicator provides an aggregated Cumulative Volume Delta (CVD) view across multiple major perpetual futures exchanges in one chart. It is designed for traders who want a broader perspective on buying and selling pressure without switching between multiple charts or relying on a single exchange feed.
What It Does
Combines volume delta data from Binance, Bybit, OKX, Bitget, and Coinbase into a unified representation.
Displays CVD as candlesticks, where each candle reflects the open, high, low, and close of cumulative delta for the selected period.
Offers a clear visual of how buying and selling pressure evolves across markets in a structured, familiar candle format.
Key Features
✔ Exchange Aggregation: Incorporates data from several top futures markets available on TradingView.
✔ Anchor Reset: Allows you to set an anchor timeframe (e.g., daily) to reset cumulative values for better readability and analysis.
✔ Unit Normalization: Since exchanges report volumes in different units, the indicator normalizes all data and outputs values denominated in the base currency (coins) for consistency.
✔ Hidden OHLC Outputs: Provides open, high, low, and close values as hidden plots for use with other indicators or strategies.
✔ Lightweight Design: Optimized for efficiency while handling multiple real-time data requests.
Why It’s Different
Unlike standard single-exchange CVD tools, this indicator aggregates the majority of perpetual volume data available on TradingView, offering a more representative view of market sentiment. The candle-based representation of CVD introduces an additional layer of structure, helping traders identify shifts in momentum and pressure with more context than a simple cumulative line.
Use Cases
- Spotting aggregated buy/sell pressure trends across multiple exchanges.
- Confirming breakout or reversal signals with broader volume delta context.
- Serving as a custom data source for other indicators or algorithmic strategies.

NSDT Bearish-Bullish CandlesThis is another interesting take on candlesticks . These Bearish-Bullish Candles do not show the wicks. Instead, the upper wick is made into a Red body and the lower wick is made into a Green body. If you match the candle body color in the chart settings (or turn off the candles completely), you get a unique way of seeing how Bearish or how Bullish a candle is because the wick will now match the body size and color.
This indicator is very similar to our NSDT Special High-Low Candles.

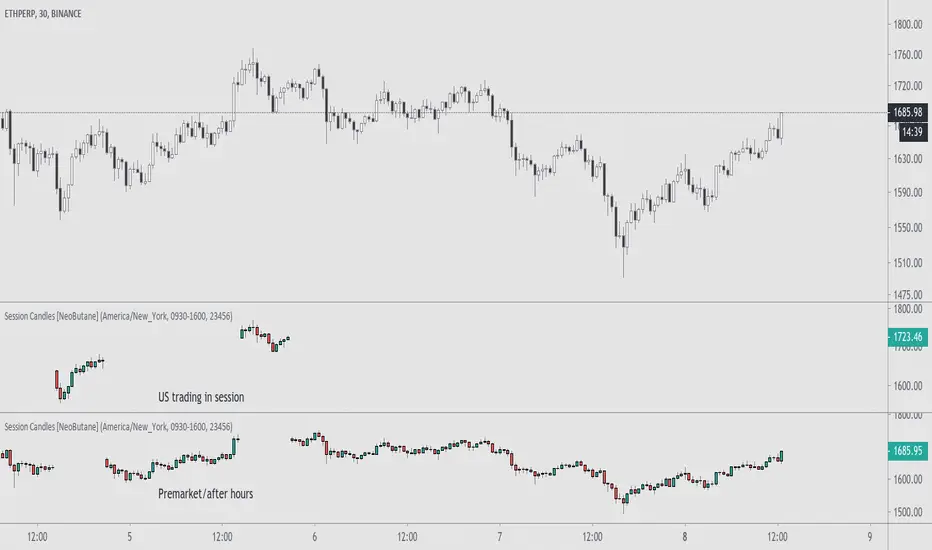
Trading Session Candles [NeoButane]█ OVERVIEW
Display candlesticks for the selected session, regular or extended.
█ CONFIGURATION
Options to change include displaying the regular or extended session, timezone, session hours, and session days.
█ CONCEPTS
Meant for charts with longer trading sessions or to view only extended hours trading action on US stocks that have afterhours available.
█ Notes
For trading days, '23456' refers to Monday to Friday.
Rate ConverterThis is a simple rate converter that can convert almost anything into almost anything else. It supports cryptocurrencies, currencies and most commodities.
On the chart we see the following:
USD (US Dollar) into EUR (Euro) as a candle stick chart
WTICO (West Texas Intermediate Crude Oil) into ISK (Icelandic Krona) as a bar chart
ADA (Cardano) into JMD (Jamaican Dollar) as a line chart
XPT (Platinum) into XAG (Silver) as a scatter plot
It supports plotting the rates as japanese candlesticks, bars, lines, or as a scatter plot.

.BXBT IndexThe current .BXBT index weighted as close as possible to BitMEX's with updates as BitMEX refreshes their index.
Difference between this and the script titled '2020 March 27 .BXBT Index': this one will receive updates because it doesn't have a date in its title.
Methodology
www.bitmex.com
"BitMEX Index Weights, assuming no constituent exchanges have been excluded due to Index Protection Rules, last updated 27 December 2019 at 12:00:05 UTC."
Binance: -
Bitstamp: 10.61%
Bittrex: 2.53%
Coinbase: 52.30%
Gemini: 6.89%
Huobi: -
Itbit: 4.21%
Kraken: 23.46%
Poloniex: -
ItBit's weight is combined with Gemini's due to ItBit not being on TradingView as of now. BITTREX:BTCUSD substituted with BITTREX:BTCUSDT*POLONIEX:USDTUSD to backfill because Bittrex only recently (late 2018) started to offer a fiat BTC/USD pair. Not that it matters since the index used in 2018 didn't include Bittrex if I remember correctly.
What is actually used for 27/12/2019 to 27/03/2020:
Binance: -
Bitstamp: 10.61%
Bittrex: 2.53%
Coinbase: 52.30%
Gemini: 11.10%
Huobi: -
Itbit: -
Kraken: 23.46%
Poloniex: -
Options:
Toggle candlesticks or close line
Change price source to be used for indicators
To be added: Change quarter to show indexes for different times, with labels that apply to the appropriate index used
Reasons to use this vs. the index itself: (not many)
It is helpful as a reference for other indicators or creation of an index.


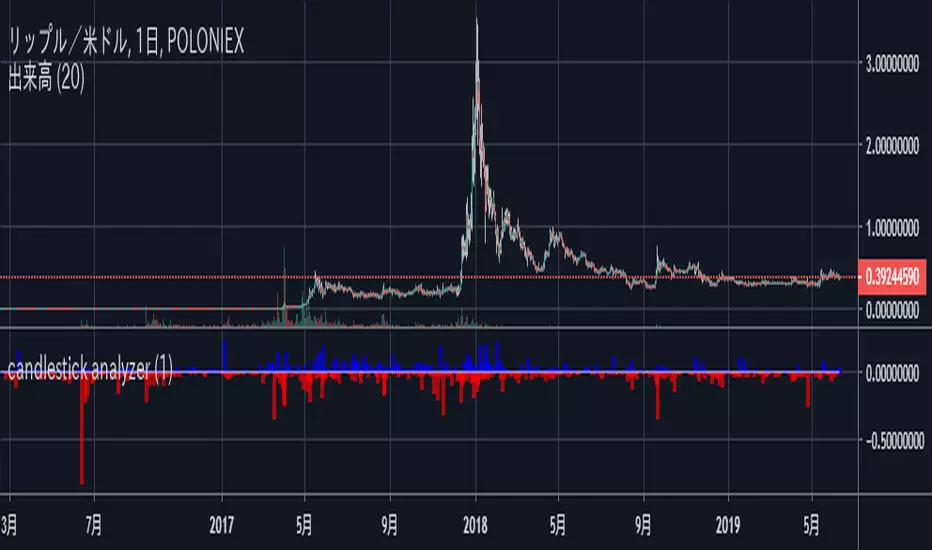
candlestick analyzerThis indicator measures lengths of shadows of candlesticks, which is defined as "(close - open+high - max(open,close))/(close - open+low - min(open,close))*(high-low) "