MTF FVG Confluence v6 — JSON Alerts via alert()This strategy combines multi-timeframe confluence with candlestick analysis and fair value gaps (FVGs) to generate structured long/short entries. It aligns Daily and 4H EMA trends with 1H MACD momentum, then confirms with engulfing candles and FVG zones for precision entries. Risk management is built-in, featuring stop-loss, 3R take-profit targets, and optional break-even logic, with dynamic JSON alerts for webhook automation.
Categories:
Candlestick analysis
Chart patterns
Cycles
Cerca negli script per "Candlestick"

Demand and Supply by Stock Fusion 1.1Title: Demand and Supply by Stock Fusion 1.1
Description: The "Demand and Supply by Stock Fusion 1.1" indicator is designed to identify and visualize institutional demand and supply zones on a chart, helping traders spot potential areas of price reversal or continuation. It highlights key price levels based on specific candlestick patterns and Momentum volume characteristics, making it suitable for various trading styles such as intraday, swing, or positional trading. The indicator supports customizable settings for timeframes, zone styles, and visual elements, ensuring flexibility for both novice and experienced traders.
Key features include:
• Dynamic Zone Detection: Identifies demand (DZ- RBR, DBR) and supply (SZ- DBD, RBD) zones on user-selected lower timeframes (LTF) or the chart’s native timeframe.
• Candle Coloring: Highlights explosive bullish/bearish candles and accumulation/base candles to emphasize significant price movements or consolidation phases.
• Zone Visualization: Plots zones as colored boxes with optional right extensions and customizable labels for clarity.
• Zone Management: Automatically removes zones after price retests or mitigation, ensuring the chart remains uncluttered.
• Informative Table: Displays real-time data on the closest zone, including the symbol, last traded price (LTP), zone type, proximal/distal prices, and proximity percentage.
• Customizable Settings: Offers options for trading modes (Manual, Normal, Conservative, Study), timeframe selection, zone strength, colors, transparency, and more.
This indicator is ideal for traders seeking to analyze market structure through institutional price action and Explosive Momentum volume based zones, with a focus on clarity and usability.
Functional Overview
1. Input Configuration:
o Trading Mode: Users can select from "Manual," "Normal," "Conservative," or "Study" modes to adjust zone sensitivity and behavior.
o Timeframe Selection: Allows users to choose a lower timeframe (e.g., 1-minute to yearly) for zone detection or use the chart’s native timeframe.
o Zone Strength: Adjustable multiplier for lower timeframe zones to control sensitivity.
o Visual Customization: Options to toggle candle coloring, zone labels, borders, and right extensions, with customizable colors, transparency, and label sizes.
o Table Settings: Configurable table for displaying zone data, with options for position, background color, text color, and font size.
o Zone Removal: Features to automatically remove zones after price retests or full mitigation to keep the chart clean.
2. Zone Detection:
o Identifies demand zones (Rally-Base-Rally , Drop-Base-Rally ) and supply zones (Drop-Base-Drop , Rally-Base-Drop ) based on candlestick patterns, volume thresholds, and price action relative to a moving average.
o Uses a base candle range (1 to 3 candles by default) to detect consolidation periods before explosive price movements.
o Incorporates momentum volume analysis to ensure zones are formed during high-Low volume periods, enhancing reliability.
3. Candle Analysis:
o Explosive Candles: Detects bullish or bearish candles with large body-to-range ratios and high volatility (based on ATR) to highlight significant price movements.
o Boring/Accumulation Candles: Identifies candles with small body-to-range ratios to mark consolidation phases, often preceding breakouts.
o Colors candles based on user preferences to visually distinguish explosive and accumulation phases.
4. Zone Visualization:
o Plots demand and supply zones as colored boxes, with options for "Wick to Wick" or "Body to Wick" zone styles.
o Supports right-extended zones for better visibility of active levels.
o Adds labels to zones (e.g., "D-DZ" / "D-SZ" for daily demand zone) with customizable sizes and colors.
5. Zone Management:
o Automatically removes zones when price closes within or beyond them, depending on user settings for retest or second-leg mitigation.
o Tracks removed zones to prevent redundant plotting and maintain chart clarity.
6. Table Display:
o Displays a table summarizing the closest active zone, including the symbol, current price, zone type (DZ/SZ), proximal/distal prices, and proximity percentage.
o Updates dynamically based on price action and zone changes.
7. Performance Optimization:
o Uses arrays to manage zones, labels, and table data efficiently.
o Limits the number of plotted elements (boxes, labels, lines) to comply with resource constraints (e.g., max 500 boxes/labels).
o Supports dynamic requests to handle data across different timeframes.
Disclaimer:-
The Demand and Supply by Stock Fusion 1.1 indicator is intended solely for informational and technical analysis purposes and does not provide financial advice or trading recommendations. Trading carries significant risks, including the potential for substantial financial losses. Users are fully responsible for their trading decisions and should perform their own research, assess their risk tolerance, and consult a licensed financial advisor before making any trades. The indicator’s signals are derived from market data, and historical performance does not guarantee future results. The developers and providers of this indicator are not liable for any losses or damages resulting from its use.

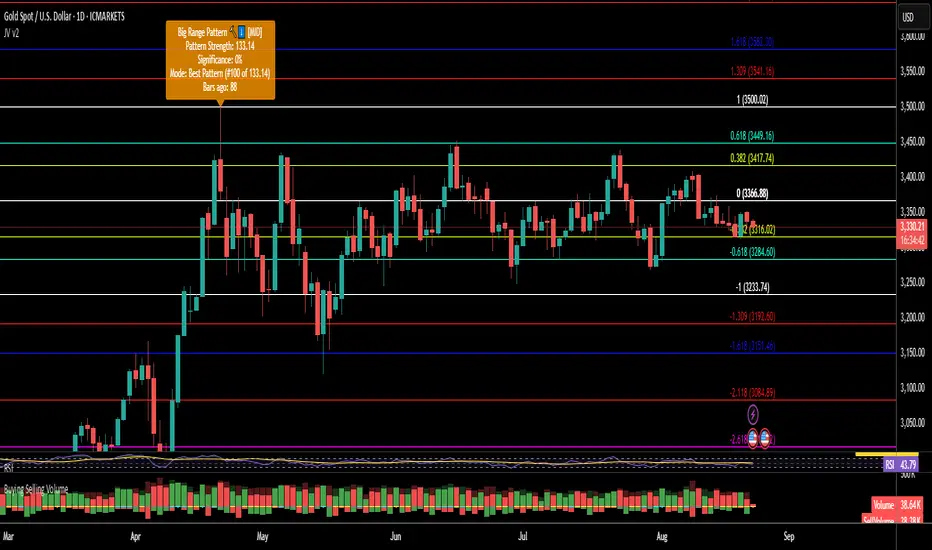
Jinny Volunacci - Magic_xDJinny Volunacci – Magic_xD is a multi-tool Fibonacci framework that merges volume context, candlestick patterns (Hammer / Shooting Star / Big Range), and fully customizable Fibonacci retracements/extensions.
It auto-selects a reference candle (or lets you pick one), then projects Fibonacci levels that adapt to your trading style.
🔧 How to Use
Candle Selection Modes
Auto Volume – automatically picks the highest-volume candle in your chosen Lookback Bars.
Custom Date – manually select any candle by date/time.
Advanced Filter – detects key candlestick setups (Hammer, Shooting Star, Big Range) and ranks them for you.
Cycle Through Candidates (Select Best #)
When multiple candidates qualify (using Advanced Filter), use Select Best # to step through them:
#1 = top match, #2 = next, #3, … — based on your chosen sorting method (Best Pattern, Most Recent, Strongest).
Fibonacci Scaling
Switch between Linear or Logarithmic scale — or plot both simultaneously.
Custom Fib Levels & Styling
Add or remove Fibonacci levels freely.
Adjust each level’s value, label (price, %, or both), line style, and individual color.
Toggle visibility for retracements vs. extensions.
Labels & Info
Enable Show Candle Info to display a quick snapshot: which candle was picked, bars ago, pattern type, and volume context.
Reverse Option
Instantly flip the projection to the opposite direction.
🎯 Why Traders Use It
Turns a high-impact candle into a Fibonacci map of support/resistance.
Flexible selection: auto, pattern-based, custom date.
Quick cycling through ranked candidates with Select Best #.
Full customization of Fib levels, scaling, colors, and labels.
Works for both retracement and extension analysis.
⚠️ Disclaimer: For educational use only. Not financial advice. Always pair with your own system and risk management.
Expanded Reversal System (4 Pattern Types)Overview
This is the final, refined version of a comprehensive candlestick reversal strategy, built with a core focus on reliability and safety. Its unique execution logic is designed to prevent common backtesting errors and ensure that the integrated risk management works precisely as intended on any timeframe.
The strategy aims to capture high-momentum reversals by identifying an expanded set of classic candlestick patterns and waiting for confirmation before entering a trade.
The "Confirm and Execute" Engine 🛡️
To eliminate bugs seen in simpler backtesting models, this strategy uses a deliberate, three-step execution process:
Signal: It first identifies a high-probability reversal pattern on a "Signal Candle."
Confirmation: It then waits for the next candle to break the high or low of the signal candle. This confirms momentum is moving in the desired direction.
Execution: Finally, it enters a market order on the open of the following candle.
This method ensures a robust and stable entry, allowing the Stop Loss and Take Profit orders to function with 100% reliability.
An Expanded Arsenal of Reversal Signals
This strategy looks for four distinct types of bullish and bearish patterns, giving it more opportunities to find valid trades:
Flexible Pin Bars: Loosened rules for Hammers and Shooting Stars to capture more opportunities.
Classic Engulfing Patterns: Identifies powerful, full-body engulfing candles.
Piercing Patterns & Dark Cloud Covers: Recognizes strong two-candle reversal signals.
Built-in Professional Risk Management 🎯
Automated Position Sizing: Every trade is automatically sized to risk exactly 2% of your current account equity.
Defined Exits: Once a trade is open, it is held until either the pre-calculated Stop Loss or Take Profit is hit. The strategy will not exit early or be influenced by new signals while in a trade.
Asymmetrical Risk/Reward: The strategy targets a 1:6 R:R for long trades and a 1:4 R:R for short trades.
How To Use
Apply the strategy to your chart.
Set your chart's timeframe. This version produced very strong results on the 3-Minute chart.
Review the detailed performance report in the 'Strategy Tester' tab.
Disclaimer: This strategy is provided for informational and educational purposes. All trading involves substantial risk, and past performance is not a guarantee of future results. Please use and adapt this tool responsibly.

BTC/USD Confluence Breakout Pro – IST EditionBTC/USD Confluence Breakout Pro – IST Edition is a multi-factor breakout trading system designed for intraday and swing traders.
It combines trend, momentum, price action, volume, and candlestick analysis with time-based volatility windows to deliver high-probability Buy/Sell signals.
Key Features:
Trend Filters: EMA 9/21 crossover + optional EMA 200 bias filter.
Price Action Breakouts: Detects closes above/below the last N bars’ range.
Candlestick Patterns: Bullish/Bearish engulfing, hammer, and shooting star.
Momentum Indicators: RSI (14) with configurable thresholds, MACD (12/26/9).
Volume Confirmation: Volume spike vs 20-period SMA.
IST Breakout Windows: Highlights Early London, London–US Overlap, and US Open momentum periods (Hyderabad/IST time). Optionally restricts signals to these windows.
Risk Management: ATR-based stop-loss + auto-plotted 1R, 2R, and 3R take-profit levels.
Visual Aids: EMA plots, bar coloring, shaded volatility windows, and clear entry/exit labels.
Alerts: Configurable alerts for both Buy and Sell signals.
Best Use:
Apply on 1m–15m charts for intraday trading or 1H–4H for swings.
Works best during high-volatility IST windows (London–US overlap & US open).
Ideal for BTC/USD but adaptable to other crypto or forex pairs.

Intraday Bullish Scanner - Profit Ping📊 Intraday Bullish Scanner – Profit Ping Only
This custom-built TradingView script identifies high-probability intraday BUY signals on the 15-minute chart, confirmed by volume, momentum, and price action. It uses:
✅ EMA 7/14 crossovers
✅ Bullish candlestick patterns (Engulfing, Piercing, etc.)
✅ Volume spikes above 20-MA
✅ RSI between 55–65
✅ MACD histogram flip from red to green
✅ Cross-confirmation with the 30-minute trend
Once in a trade, it activates a dynamic trailing stop (starting at 2%, tightening to 1% as profit and volume increase). SELL signals are confirmed only with:
❌ MACD turning red
❌ Bearish RSI movement or drop below 50
❌ EMA 7 crossing below EMA 14
❌ A bearish candlestick (Engulfing or Piercing)
❌ Volume spike on a red candle
💰 When all SELL conditions align, a yellow triangle appears. BUYs are marked with a white triangle. Alerts can be connected directly to Python/webhook systems for full automation with IBKR.
Volume 200% Spike w/ MultiTF Color LogicStrategy Description: Volume-Confirmed Spike with Multi-Timeframe Heiken Ashi Agreement
This indicator highlights “SPIKE” events on the candlestick chart whenever a surge in trading volume coincides with momentum agreement across multiple timeframes and Heiken Ashi candle structure. Specifically, a “SPIKE” label is drawn below the candlestick when:
Volume Surge:
The current bar’s volume is at least 200% of the 20-bar simple moving average volume (on the chart’s timeframe).
Candle Nature Agreement:
The price bar and the double-smoothed Heiken Ashi candle (10,10 smoothing) are both bullish (close > open and HA close > HA open), or
Both are bearish (close < open and HA close < HA open).
Multi-Timeframe Volume Confirmation (Color Logic):
If the current, 1-hour, and 4-hour volumes are all above their respective 20-bar volume moving averages, the label is dark green (for bullish) or dark red (for bearish).
If only the current timeframe is spiking, the label is light green (bullish) or red (bearish).
Label Placement:
The “SPIKE” label is plotted well below the candle’s low, using a multiple of ATR for visual clarity.
Purpose:
This strategy is designed to highlight high-impact, high-conviction volume spikes only when both short-term price action and Heiken Ashi momentum are aligned—and to further emphasize signals that are confirmed by volume surges on higher timeframes.
It filters out low-quality or ambiguous spikes and helps traders spot strong, likely-continuation or reversal events driven by real market participation.

BanShen MACD Ultimate Multi Signal System[SpeculationLab]🧠 How This Script Works (Detailed Logic Breakdown)
This script is a closed-source, fully self-developed modular trading system centered around MACD divergence detection. It also includes auxiliary modules such as:
Vegas Tunnel trend filtering
Dynamic ATR-based stop placement
Engulfing candlestick pattern detection
RSI/OBV divergence modules
Fair Value Gap (FVG) recognition
A smart signal panel that consolidates all signals in real time
These components work together through a signal resonance framework, helping traders identify high-confluence, high-probability entry opportunities.
🔍 Why MACD Divergence Is the Core (Real-World Strategy Basis)
This system is based on a real-world trading strategy I’ve personally used and refined over time.
Through discretionary trading and backtesting, I discovered that divergence between price action and the MACD histogram — especially when certain structural conditions are met — produces a very high win rate.
Key observations include:
MACD peaks/troughs that are clean and well-shaped (defined pivot structure)
Large vertical differences between two MACD histogram extremes
Price making a higher high or lower low, while MACD does the opposite
Two or more divergences appearing consecutively, which creates a powerful reversal signal
These setups have proven extremely reliable in my experience. This script automates the detection of these conditions using strict logic filters.
🔷 1. MACD Divergence Engine (Core Module)
At its core, this script implements a multi-layered MACD divergence detection system, capable of identifying both **regular** and **consecutive** bullish/bearish divergences.
Key components of the logic:
- **Pivot-Based Peak Detection:**
Peaks and troughs in the MACD histogram are located using left/right lookback lengths.
These define valid turning points by requiring the center bar to be the highest (or lowest) compared to its neighbors.
- **Peak Size Thresholding:**
The height of the histogram peaks is compared to the standard deviation of MACD values.
Only peaks above a configurable multiplier (e.g., 0.1× stdev) are considered significant, filtering out noise.
- **Peak Ratio Filtering:**
For divergence to be valid, the size ratio between two histogram peaks must exceed a minimum threshold.
This prevents "flat" divergences with no meaningful MACD movement from triggering false signals.
- **Noise Suppression:**
A customizable threshold filters out weak histogram fluctuations between divergence points.
- **Price Action Confirmation:**
The divergence is only confirmed when the price forms a new high or low (depending on the type), and the MACD forms an opposing structure.
- **Consecutive Divergence Detection:**
For high-conviction setups, the script detects sequences of two or more divergences in the same direction.
These use stricter filters and flag rare but powerful market turning points.
Signals are plotted using plotshape() with visual differentiation between regular and consecutive setups. You can enable/disable each type individually.
⏰ Note: Histogram colors are styled similarly to TradingView’s built-in MACD for visual familiarity. However, this script is built entirely from scratch and does not reuse any internal TV code.
---
🔷 2. Trend Filtering via Vegas Tunnel
The **Vegas Tunnel** module plots 5 configurable EMAs (default: 12, 144, 169, 576, 676) to evaluate trend direction.
The trend is considered **bullish** when short EMAs (144/169) are positioned above long EMAs (576/676), and the price is interacting with the short EMA tunnel.
Conversely, a bearish condition is detected when the opposite is true.
A visual triangle marker highlights trend zones, and users can hide/show individual EMAs.
---
🔷 3. ATR-Based Dynamic Stop Loss
This module plots dynamic stop levels above and below the current price based on ATR.
Default setting uses 13-period ATR, and users can customize the multiplier or disable the plot.
It serves as a visual guide for risk management in live trades.
---
🔷 4. Engulfing Pattern Recognition
Candlestick-based signal detection:
- **Bullish Engulfing** occurs when a candle closes above the prior high, and the prior bar is bearish.
- **Bearish Engulfing** when a candle closes below the prior low, and the prior bar is bullish.
Users can modify the logic to use open/close levels for looser or stricter detection.
These patterns are highlighted using plotshape markers and optionally included in the signal table.
---
🔷 5. RSI and OBV Divergence Modules
These modules follow similar logic to the MACD engine:
- Use pivotlow() / pivothigh() to detect swing points.
- Confirm divergence only when price moves in one direction while RSI or OBV moves in the opposite direction.
- Require a minimum distance (in bars) between the two pivots.
- Require a certain ratio between two indicator values and their corresponding prices.
You can only enable **one of MACD/RSI/OBV divergences at a time** to avoid visual overlap, as they share the same subplot.
---
🔷 6. FVG (Fair Value Gap) Auto Detection
This module detects large single-direction price moves where price leaves a visible gap between candle 3 bars ago and 1 bar ago.
- **Bullish FVG**: high < low
- **Bearish FVG**: low > high
ATR-based filters are applied to eliminate minor gaps.
Each gap is drawn as a box and optionally extended, with a central line marking the midpoint (CE - Consequent Encroachment) level.
Traders often look for price to return to this level as an entry signal.
---
🔷 7. Smart Signal Table
All active signals (MACD, Vegas, RSI, OBV, Engulfing) are collected into a **real-time table** that displays current market bias.
- Each module reports whether it is currently giving a bullish (🟢) or bearish (🔴) condition.
- Helps users assess signal alignment (confluence).
- The table is updated every bar and appears in the bottom-right corner.
---
🔷 8. Watermark & Branding
The watermark displays the script name and author at the top-right, and can be toggled via settings.
📌 Not a Mashup — Structured System, Not a Stack of Indicators
⚠️ This is not a random mashup of unrelated indicators.
Every module in this system was intentionally designed to support the core MACD divergence logic by filtering, validating, or amplifying its signals.
Here's how the system achieves signal confluence and structure:
Vegas Tunnel acts as a macro trend filter, helping users determine whether to favor long or short trades.
For example, bullish MACD divergence is more reliable when confirmed by an uptrend in the Vegas EMAs. This prevents users from trading against momentum.
Engulfing Patterns serve as entry-level price action confirmation.
When a bullish engulfing candle appears near a MACD bullish divergence — and trend conditions from Vegas are aligned — the confluence increases dramatically.
This is especially powerful when multiple modules confirm in the same direction on the right side of the chart.
RSI and OBV Divergence modules offer redundant but independent momentum views.
Users may enable them selectively to validate MACD signals, or to use them as standalone alternatives when MACD is flat or noisy.
FVG Zones provide context for entries or targets.
For instance, a MACD bullish divergence forming near a bullish FVG gap increases the odds of reversal.
Price often "fills" these imbalances, which aligns well with reversal setups.
The Smart Signal Table aggregates signals from all modules and provides a visual, real-time overview of the current market bias.
This allows traders to act only when multiple signals are aligned — for example, when MACD is bullish, trend is up, and a bullish engulfing just printed.
Together, this framework creates a coherent decision-making system, where each tool has a defined role: trend filtering, signal confirmation, risk management, or entry detection.
🧩 It is modular in architecture, but not modular in purpose.
This system was not built by stacking indicators, but by integrating logic across modules to support a high-conviction MACD-based strategy.
🧬 Originality Statement
This script is entirely original, developed from scratch without using external libraries or public script code. The logic is fully custom, especially the consecutive divergence detection system and signal integration.
⚠️ Disclaimer
This script is for educational and informational purposes only and does not constitute financial advice. Trade at your own risk.
---
📘 中文简要说明:
这是一个完全原创、闭源的交易系统,核心逻辑为 MACD 柱状图背离信号的识别,配合多模块共振判断,构建出一个高胜率的多信号共振策略。
本指标模块化结构清晰,主要包括:
- MACD 背离识别(支持连续背离)
- Vegas EMA 隧道趋势过滤
- RSI / OBV 背离模块
- 吞没形态识别
- FVG 平衡区间自动标注
- ATR 动态止损提示
- 智能信号面板(整合所有信号并可视化)
所有模块均可单独开启/关闭,适配顺势、逆势或多周期的交易风格。
本脚本为个人实战策略的程序化实现,逻辑完全由零开发,未使用任何公用代码。适合希望提高交易胜率和信号精准度的用户使用。
免责声明:本指标仅用于技术分析学习与参考,不构成任何投资建议。请您独立判断,自行承担交易风险。

MTF MinichartsHello friends,
I'm excited to share another unique tool with you — the MTF Minicharts indicator. This script lets you display multiple mini candlestick charts directly on your main chart, using data from different tickers and timeframes at the same time. It's designed to give you a clear multi-timeframe, multi-asset perspective — all in one place.
There are no complicated setups: just select your tickers, pick your timeframes, and the minicharts are ready to go. You can even apply one timeframe to all tickers with a single switch — making your workflow simple and efficient.
🛠️ How It Works
The script pulls price data for up to six different tickers and timeframes and displays them as compact candle charts inside your main chart window. You can choose to set each minichart's timeframe individually, or apply one timeframe to all tickers instantly. Fully customizable layout options let you arrange your minicharts in flexible grids — from 1×1 up to 3×2 and beyond. A total of 13 grid layouts are available, so you can adapt the view exactly to your screen and style. Each minichart can display 2 to 21 candles , giving you just the right balance between detail and space. Candlestick styling, spacing, last price lines, and ticker labels are all adjustable, so you can fine-tune your view to your exact needs.
🔥 Key Features
Pine Script v6 — Uses the latest version for maximum performance
Multi-Timeframe, Multi-Ticker — Combine up to six charts, mixing tickers and timeframes as you wish
Single-Timeframe Mode — Apply one timeframe to all tickers with a single click
13 Grid Layouts — Choose from multiple layout options for clean positioning on your main chart
Custom Candles per Chart — Display anywhere from 2 to 21 candles in each minichart
Overlay or Subpanel Mode — Choose whether your minicharts overlay the price or sit in a subpanel
Custom Candles Styling — Adjust body width, wick width, and colors to match your style
Last Price Lines — Optional last price marker for each minichart, with style and width controls
Clear Ticker Labels — Show performance metrics in various formats
Optimized Performance — Efficient rendering for smooth operation, even with multiple charts
Universal Compatibility — Works flawlessly across all assets, timeframes, and market conditions
📸 Visual Examples
Subpanel mode with 1x6 layout
Combination of two instances gives you a mini screener
If you'd like access or have any questions, feel free to reach out to me directly via DM.
👋 Good luck and happy trading!
Script a pagamento

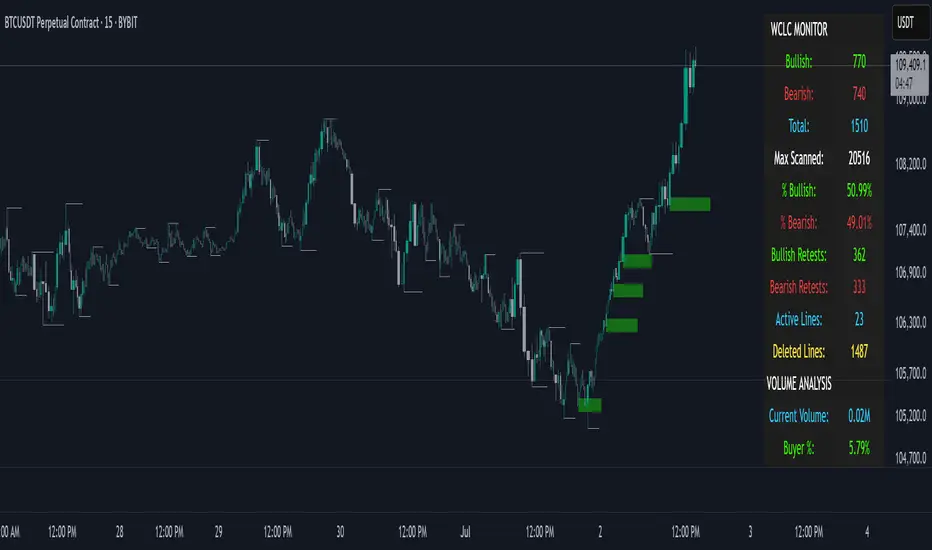
THE WICKLESS CANDLE By [VXN]The Wickless Candles Strategy - Comprehensive Analysis
Core Concept
The "Wickless Candles" strategy is a technical analysis approach that identifies specific candlestick formations where one side of the candle has no wick, indicating strong directional momentum and potential support/resistance levels.
What Are Wickless Candles?
Bullish Wickless Candles
Meaning: A green candle where the opening price equals the lowest price
Significance: Shows that buyers immediately took control and never let price fall below the opening level
Implication: The opening price becomes a strong support level
Bearish Wickless Candles
Meaning: A red candle where the opening price equals the highest price
Significance: Shows that sellers immediately dominated and never let price rise above the opening level
Implication: The opening price becomes a strong resistance level
Visual Strategy Elements
Support/Resistance Lines
Bullish Lines: Green horizontal lines drawn at the low (open) price of wickless bullish candles
Bearish Lines: Red horizontal lines drawn at the high (open) price of wickless bearish candles
Extension: Lines project forward for 5 bars (configurable) to highlight key levels
Purpose: These levels often act as future support/resistance zones
Advanced Volume Analysis (4:00 AM - 9:29 AM Session)
Volume Calculations
Market Dominance Indicators
🟢🟢🟢🔴: Buyer dominance (more buying pressure)
🔴🔴🔴🟢: Seller dominance (more selling pressure)
🟢🟢🔴🔴: Balanced market (equal pressure)
Comprehensive Statistics Monitor
Wickless Candle Metrics
Bullish Count: Total number of bullish wickless candles detected
Bearish Count: Total number of bearish wickless candles detected
Total Wickless: Combined count of all wickless formations
Max Scanned: Total number of candles analyzed
Percentages: Bullish vs bearish distribution ratios
Volume Intelligence
Current Volume: Real-time session volume in millions
Buyer/Seller Percentages: Relative strength of each side
Market Dominance: Visual representation of controlling force
Strategic Applications
Entry Signals
Long Entries: Near bullish wickless candle support lines
Short Entries: Near bearish wickless candle resistance lines
Confirmation: Use volume dominance to confirm directional bias
Market Context
Institutional Interest: Wickless candles often indicate large player activity
Price Rejection: Shows where market participants strongly defended levels
Momentum Confirmation: Volume analysis validates the strength behind moves
Key Advantages
Objective Identification: Clear mathematical criteria for wickless formations
Real-Time Monitoring: Live statistics and volume analysis
Multi-Timeframe Application: Works across different chart intervals
Alert System: Automatic notifications when new levels are established
Visual Clarity: Easy-to-spot support/resistance lines on chart
This strategy combines traditional candlestick analysis with modern volume profiling to identify high-probability trading zones where institutional and retail sentiment align at specific price levels.
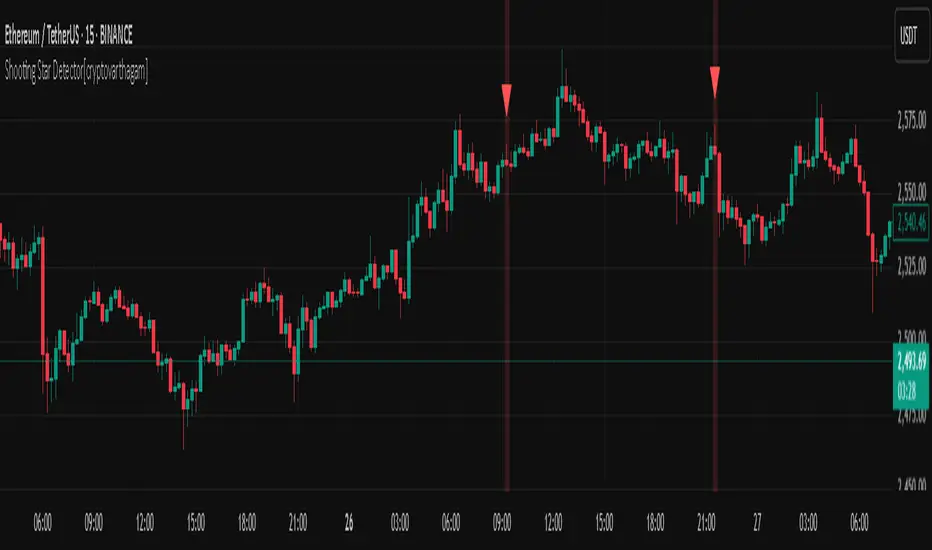
Shooting Star Detector[cryptovarthagam]🌠 Shooting Star Detector
The Shooting Star Detector is a powerful price action tool that automatically identifies potential bearish reversal signals using the well-known Shooting Star candlestick pattern.
Ideal for traders who rely on candlestick psychology to spot high-probability short setups, this script works across all markets and timeframes.
🔍 What is a Shooting Star?
A Shooting Star is a single-candle pattern that typically forms at the top of an uptrend or resistance zone. It’s characterized by:
A small body near the candle's low,
A long upper wick, and
Little or no lower wick.
This pattern suggests that buyers pushed price higher but lost control by the close, hinting at potential bearish momentum ahead.
✅ Indicator Features:
🔴 Accurately detects Shooting Star candles in real-time
🔺 Plots a red triangle above every valid signal candle
🖼️ Optional background highlight for visual clarity
🕵️♂️ Strict ratio-based detection using:
Wick-to-body comparisons
Upper wick dominance
Optional bearish candle confirmation
⚙️ Detection Logic (Rules Used):
Upper wick > 60% of total candle range
Body < 20% of total candle
Lower wick < 15% of candle range
Bearish candle (optional but included for accuracy)
These rules ensure high-quality signals that filter out false positives.
📌 Best Use Cases:
Spotting trend reversals at swing highs
Confirming entries near resistance zones
Enhancing price action or supply/demand strategies
Works on: Crypto, Forex, Stocks, Commodities
🧠 Trading Tip:
Pair this detector with volume confirmation, resistance zones, or bearish divergence for higher-probability entries.
📉 Clean, minimal, and non-repainting — designed for traders who value accuracy over noise.
Created with ❤️ by Cryptovarthagam
Follow for more real-time price action tools!
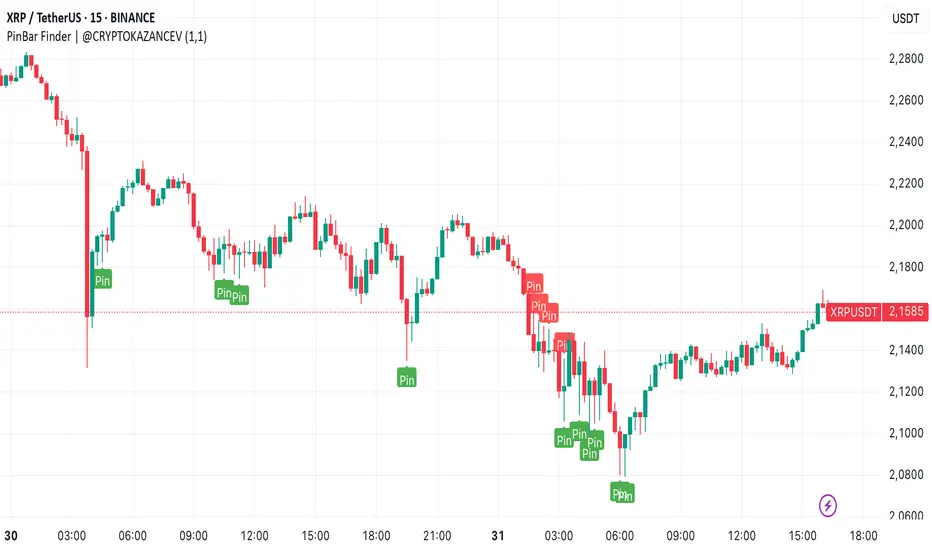
PinBar Finder | @CRYPTOKAZANCEVPinBar Finder | @CRYPTOKAZANCEV
This script helps traders identify high-probability reversal points based on price action, specifically Pin Bars — a well-known candlestick pattern used in technical analysis.
What does the indicator do?
It detects bullish and bearish Pin Bars using a custom method for wick-to-body ratio and filters based on historical volatility (pseudo-ATR). A label appears on the chart with detailed info on wick and body size when a valid signal is found.
How does it work?
- The indicator calculates a pseudo-ATR based on the percentage range of the last 1000 candles.
- It then multiplies this value by a user-defined factor (default: 1.1) to set a dynamic threshold for wick size.
- Bullish Pin Bars are detected when the lower wick is at least 1.1 times the body and greater than the dynamic ATR.
- Bearish Pin Bars are detected when the upper wick meets similar conditions.
- Signals are shown using chart labels with exact wick/body percentages.
- Alerts are included for automation or integration with trading bots.
How to use it?
- Add the indicator to any timeframe and asset.
- Use the alerts to notify you when a Pin Bar appears.
- Ideal for traders who use candlestick reversal strategies or combine price action with other confluence tools.
- You can adjust the wick length multiplier to fit the volatility of the instrument.
What makes it original?
Unlike many public scripts that use fixed ratios, this script adapts wick length detection based on recent volatility (pseudo-ATR logic). This makes it more dynamic and suitable for different markets and timeframes.
Developed by: @ZeeZeeMon
Original author name on chart: @CRYPTOKAZANCEV
This script is open-source and educational. Use at your own discretion.
PinBar Finder | @CRYPTOKAZANCEV
Этот скрипт помогает трейдерам находить точки потенциального разворота на основе прайс-экшена, а именно — свечного паттерна «Пин-бар». Индикатор автоматически определяет бычьи и медвежьи пин-бары с учетом адаптивных параметров волатильности.
Что делает индикатор?
Скрипт ищет свечи, у которых тень в несколько раз превышает тело (пин-бары), и отображает на графике точную информацию о длине тела и тени. Это полезно для трейдеров, использующих свечные сигналы на разворот.
Как работает?
- Рассчитывается псевдо-ATR по 1000 последним свечам на основе процентного диапазона high-low.
- Этот ATR умножается на заданный множитель (по умолчанию: 1.1), чтобы динамически задать минимальную длину тени.
- Бычий пин-бар определяется, когда нижняя тень больше тела в 1.1 раза и превышает ATR.
- Медвежий пин-бар — аналогично, но для верхней тени.
- Индикатор отображает лейблы с точными значениями тела и тени.
- Реализованы условия для оповещений (alerts).
Как использовать?
- Добавьте индикатор на нужный график и таймфрейм.
- Настройте alerts, чтобы не пропустить сигналы.
- Особенно полезен для трейдеров, работающих со свечным анализом, стратегиями разворота, а также в сочетании с другими индикаторами.
В чем оригинальность?
В отличие от многих скриптов, использующих фиксированные параметры, здесь используется динамический расчет длины тени на основе волатильности. Это делает скрипт адаптивным к рынку и таймфрейму.
Разработчик: @ZeeZeeMon
Оригинальное имя автора на графике: @CRYPTOKAZANCEV
Скрипт является открытым и предназначен для образовательных целей. Используйте на своё усмотрение.
Strategy Builder With IndicatorsThis strategy script is designed for traders who enjoy building systems using multiple indicators.
Please note: This script does not include any built-in indicators. Instead, it works by referencing the plot outputs of the indicators you’ve already added to your chart.
For example, if you add a MACD and an ATR indicator to your chart, you can assign their plot values as inputs in the settings panel of this strategy.
• MACD as a trigger
• ATR as a filter
How Filters Work
Filters check whether certain conditions are met before a trade can be opened. For instance, if you set a filter like ATR > 30, then no trade will be executed unless that condition is true — even if the trigger fires.
All filters are linked, meaning every active filter must be satisfied for a trade to occur.
How Triggers Work
Triggers are what actually fire a trade signal — such as a moving average crossover or RSI breaking above a specific level. Unlike filters, triggers are independent. Only one active trigger needs to be true for the trade to execute.
Thanks to its modular structure, this strategy can be used with any indicator of your choice.
⸻
Risk Management Features
In the settings, you’ll find flexible options for:
• Stop Loss (SL)
• Trailing Stop Loss (TSL)
• Multi Take-Profit (TP)
These features enhance trade safety and let you tailor your risk management.
SL types available:
• Tick-based SL
• Percent-based SL
• ATR-based SL
Once you select your preferred SL type, you can fine-tune its distance using the offset field.
Trailing SL allows your stop to follow price as it moves in your favor — helping to lock in profits.
Multi-TP lets you take profits at two different levels, helping you secure gains while leaving room for extended moves.
Breakeven option is also available to automatically move your SL to entry after reaching a profit threshold.
⸻
How to Build a Solid Strategy
Let’s break down a good setup into three key components:
1. Trend Filter
Avoid trading against the trend — that’s like swimming against the current.
Use a filter like:
• Supertrend
• Momentum indicators
• Candlestick bias, etc.
Example: In this case, I used Supertrend and filtered for trades only if the price is above the uptrend line.
2. Trigger Condition
Once we confirm the trend is on our side, we need a trigger to execute at the right moment. This can be:
• RSI cross
• Candlestick patterns
• Trendline breaks
• Moving average crossovers, etc.
Example: I used RSI crossing above 50 as the entry trigger.
3. Risk Management
Even in the right trend at the right time — anything can happen. That’s why you should always define Stop Loss and Take Profit levels.
⸻
And there you have it! Your strategy is ready to backtest, refine, and deploy with alerts for live trading.
Questions or suggestions? Feel free to reach out

Abusuhil Bullish Candles (Label + Table)Abusuhil Bullish Candles is a pattern recognition indicator designed to identify key bullish reversal candlestick formations including Hammer, Bullish Engulfing, Morning Star, Piercing Line, Three White Soldiers, and Three Inside Up.
The script includes optional filters such as Stochastic and Volume Confirmation, providing more precise signal detection.
Each pattern and filter is fully customizable via settings. Alerts are also included to support active trading workflows.
This script was written originally and does not copy open-source indicators. It's ideal for traders seeking visual clarity on bullish opportunities with professional-grade logic.
مؤشر الشموع الصعودية هو مؤشر احترافي يكتشف أبرز نماذج الانعكاس الصعودي في الشموع اليابانية مثل: Hammer، Bullish Engulfing، Morning Star، Piercing Line، Three White Soldiers، و Three Inside Up.
يوفر المؤشر فلاتر إضافية مثل فلتر Stochastic وفلتر الفوليوم لتعزيز دقة الإشارات. جميع الإعدادات قابلة للتعديل بما يتناسب مع احتياج كل متداول.
يحتوي المؤشر أيضًا على تنبيهات تلقائية لدعم استراتيجيات التداول اللحظي. تمت برمجة المؤشر من الصفر ويعتمد على منطق خاص غير منسوخ من سكربتات مفتوحة المصدر.
--------------------------------------------------------------------------------------------------------------------
🇸🇦 التحديثات – النسخة الجديدة (Abusuhil Bullish Candles)
✅ تم تغيير الملصقات بشكل أوضح: باستخدام دوائر ملونة أسفل الشموع بدلًا من المربعات لتفادي التراكب.
🟦 إضافة جدول تفاعلي على الشارت يعرض أسماء النماذج وألوانها المخصصة.
🎨 إمكانية تغيير ألوان كل نموذج من الإعدادات حسب رغبة المستخدم.
🧩 تفعيل/تعطيل كل نموذج على حدة من خلال إعدادات منفصلة.
🔔 إضافة تنبيه احترافي واحد يتم تفعيله عند تحقق أي نموذج نشط من النماذج المحددة.
📋 توافق كامل مع سياسة TradingView:
لا يحتوي على أكواد منسوخة أو مبنية على مؤشرات داخلية.
لا تكرار للوظائف أو العناوين.
وصف واضح مع تحكم كامل للمستخدم.
🇬🇧 Updates – Latest Version (Abusuhil Bullish Candles)
✅ Clearer Signal Labels: Now uses colored circles under candles instead of labels to avoid overlapping.
🟦 Interactive Table showing pattern names and user-defined colors.
🎨 Customizable colors for each candlestick pattern from the settings menu.
🧩 Toggle each pattern independently using dedicated checkboxes.
🔔 Single professional alert condition that triggers only when any enabled pattern is detected.
📋 Fully compliant with TradingView's publishing policy:
No reused or built-in indicator code.
No duplicated logic or misleading titles.
Clean and modular design with full user customization.

RSI Divergence Indicator - Trading VidhyalayaThis indicator automatically identifies RSI-based bullish and bearish divergences and visually marks them directly on the candlestick chart, making it easier for traders to spot potential reversals.
✅ Key Features:
Bullish Divergence
When the price makes a lower low, but the RSI makes a higher low, the indicator highlights the candle with a green arrow or label to signal potential upward reversal.
Bearish Divergence
When the price makes a higher high, but the RSI forms a lower high, the indicator marks the candle with a red arrow or label to indicate a possible downside move.
Real-time Detection
Divergences are plotted in real-time, helping traders react quickly to changing market conditions.
Candlestick Overlay
Signals are shown directly on the chart, rather than below in a separate panel, allowing for faster and clearer decision-making.
📊 Benefits:
Helps in identifying early trend reversals
Works well with other indicators like MACD, Moving Averages, or Volume
Great for both beginners and advanced traders
Saves time by automating divergence spotting, reducing manual errors

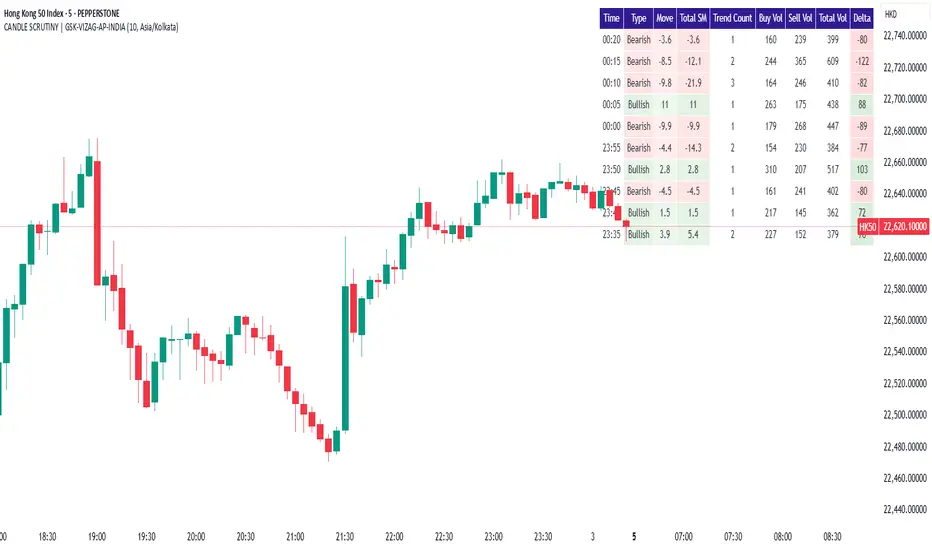
CANDLE SCRUTINY | GSK-VIZAG-AP-INDIAIndicator: CANDLE SCRUTINY | GSK-VIZAG-AP-INDIA
1. Overview
The CANDLE SCRUTINY indicator is a candle-by-candle analytical tool designed to dissect and visually represent the behavior of recent candles on a chart. It presents a concise table overlay that summarizes critical candlestick data including price movement, directional trend, volume dynamics, and strength of price sequences — all updated in real time.
2. Purpose / Trading Use Case
This tool is ideal for:
Scalpers and intraday traders needing quick real-time candle insights.
Trend analyzers who want to observe evolving price momentum.
Volume-based decision makers monitoring buyer-seller imbalance.
Traders who scrutinize candles for confirmations before entries or exits.
3. Key Features & Logic Breakdown
Candle Classification: Each candle is categorized as Bullish, Bearish, or Doji based on open-close comparison.
Move Calculation: Calculates and displays net candle move (Close - Open) for each bar.
Trend Count: Tracks the number of consecutive candles of the same type (bullish or bearish).
Sequential Move (Total SM): Aggregates move values when candles of the same type form a sequence.
Volume Breakdown: Approximates buy/sell volume ratio using candle type logic.
Delta Volume: Measures buy-sell imbalance to gauge intrabar strength.
Time Localization: Candle timestamps are shown in the user-selected timezone.
4. User Inputs / Settings
Number of Candles (numCandles): Choose how many recent candles to analyze (1–10).
Table Position (tablePos): Set to top_right by default.
Timezone Selector (tzOption): Choose from multiple global timezones (e.g., IST, UTC, NY, London) to view local candle times.
These settings let traders customize the scope and perspective of candle analysis to fit their trading region and strategy focus.
5. Visual & Plotting Elements
A floating data table appears on the chart (top-right by default), showing:
Time of candle (localized)
Type (Bullish/Bearish/Doji)
Move value with green/red background
Total SM (sequential movement) with trend-based color shading
Trend Count
Buy Volume, Sell Volume, Total Volume
Delta (volume imbalance) with color-coded strength indicator
Color coding makes it visually intuitive to quickly assess strength, direction, and sequence.
6. Effective Usage Tips
Use in 1-minute to 15-minute timeframes for scalping or momentum breakout confirmation.
Monitor Delta and Sequential Move (SM) to confirm strength behind price action.
Trend Count helps gauge sustained direction—useful for short-term trend continuation strategies.
Combine with support/resistance zones or volume profile for stronger confluence.
Great for detecting early signs of exhaustion or continuation.
7. What Makes It Unique
Combines price action + volume behavior + trend memory into one compact visual table.
Allows user-defined timezone adjustment, a rare feature in similar indicators.
Designed to give a story of the last N candles from a momentum and participation viewpoint.
Fully non-intrusive overlay—doesn't clutter chart space.
8. Alerts / Additional Features
Currently no alerts, but future versions may include:
Alert when trend count exceeds a threshold
Alert on strong delta volume shifts
Alert on back-to-back Dojis (sign of indecision)
9. Technical Concepts Used
Candlestick Logic: Bullish, Bearish, Doji classification
Volume Analysis: Approximate buy/sell split based on candle type
Color Coding: For intuitive interpretation of move, trend, and delta
Arrays & Looping Logic: Efficient tracking of trends and sequences
Timezone Handling: Uses hour(time, timezone) and minute(time, timezone) for local display
10. Disclaimer
This script is provided for educational and informational purposes only. It does not constitute financial advice. Always backtest thoroughly and use appropriate risk management when applying this or any indicator in live markets. The author is not responsible for any financial losses incurred.
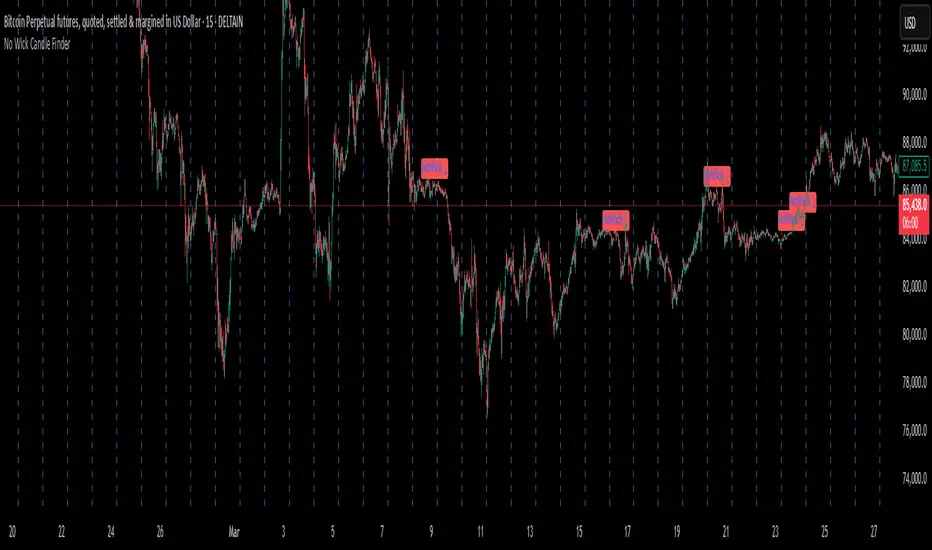
No Wick Candle Finder"No Wick Candle Finder", is a visual that identifies and confirms candlestick patterns with no wicks—a rare but significant type of price action. Here's a breakdown of what it does, how it works, and why traders might find it useful:
This script highlights candles with no wicks and adds an extra layer of confirmation before plotting a signal.
📌 What is a No-Wick Candle?
A "no-wick" candle means:
Bullish (green) no-wick candle:
Open = Low
Close = High
Strong buying pressure from start to end of the candle.
Bearish (red) no-wick candle:
Open = High
Close = Low
Strong selling pressure throughout the candle.
These candles indicate a clear directional move with no retracement during the timeframe.
🧠 Trading Use Cases
Trend Continuation Entry: These candles can signal strong momentum continuation.
Breakout Confirmation: Often appear on breakouts—confirming strength.
Scalping or Intraday: Great for short timeframes where clean moves matter most.
Reversal Strength Meter – Adib NooraniThe Reversal Strength Meter is an oscillator designed to identify potential reversal zones based on supply and demand dynamics. It uses smoothed stochastic logic to reduce noise and highlight areas where momentum may be weakening, signaling possible market turning points.
🔹 Smooth, noise-reduced stochastic oscillator
🔹 Custom zones to highlight potential supply and demand imbalances
🔹 Non-repainting, compatible across all timeframes and assets
🔹 Visual-only tool — intended to support discretionary trading decisions
This oscillator assists scalpers and intraday traders in tracking subtle shifts in momentum, helping them identify when a market may be preparing to reverse — always keeping in mind that trading is based on probabilities, not certainties.
📘 How to Use the Indicator Efficiently
For Reversal Trading:
Buy Setup
– When the blue line dips below the 20 level, wait for it to re-enter above 20.
– Look for reversal candlestick patterns (e.g., bullish engulfing, hammer, or morning star).
– Enter above the pattern’s high, with a stop loss below its low.
Sell Setup
– When the blue line rises above the 80 level, wait for it to re-enter below 80.
– Look for bearish candlestick patterns (e.g., bearish engulfing, inverted hammer, or evening star).
– Enter below the pattern’s low, with a stop loss above its high.
🛡 Risk Management Guidelines
Risk only 0.5% of your capital per trade
Book 50% profits at a 1:1 risk-reward ratio
Trail the remaining 50% using price action or other supporting indicators

Advanced OHLC ExporterThis Pine Script indicator provides one-click export of candlestick data (OHLC + Volume) from any TradingView chart. It displays the current candle's values in a clean table while ensuring all visible historical data is available for export in CSV format.
Key Features
📊 Visual Data Display
Real-time OHLC table in the top-right corner.
Color-coded values for quick analysis (green=high, red=low).
Volume shown in standardized formatting.
Data Export Ready
All plotted values appear in TradingView's Data Window.
Right-click → "Export Data" to save:
Open, High, Low, Close (OHLC) prices
Trading volume
Timestamps for each candle
⚙️ Customizable Output
Works on any timeframe (1m to 1M)
Compatible with: Forex, Stocks, Crypto, Futures
How Traders Use This
Technical Analysts - Export clean datasets for external analysis.
Backtesters - Quickly gather historical price data for strategy development.
Researchers - Study candlestick patterns with precise numerical data.

Renko Flip MarkerThis script shows on chart where Renko bricks flip for candlestick chart. I intended it for candlestick chart, but it seems to work Renko chart too from my testing so far. You may change the Renko size for your own scenario you're trading. Hopefully helps, Thank you.

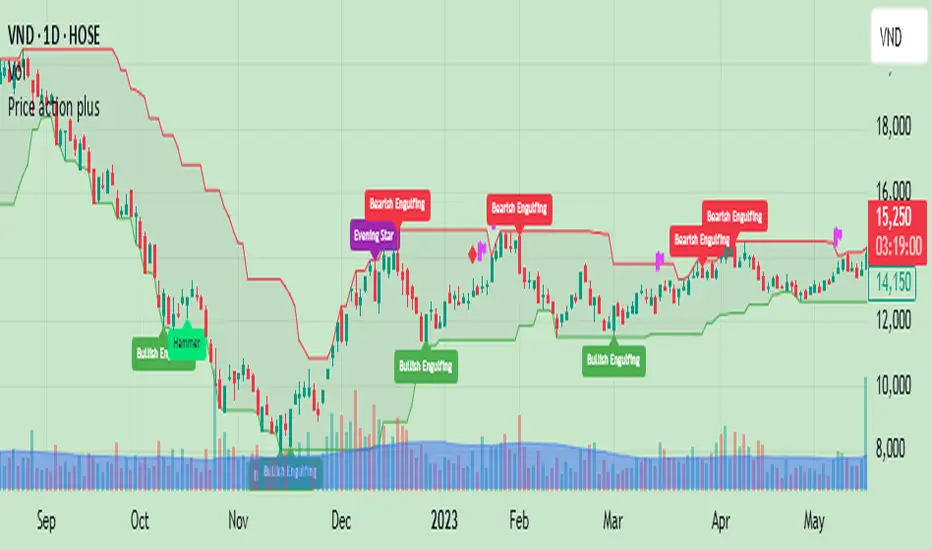
Price action plus//The system combines the divergence of A/D and OBV with identifying reversal points using Japanese candlestick patterns, creating an enhanced version of price action. This helps investors more easily and accurately recognize reversal patterns in technical analysis.
Divergence of A/D vs. OBV includes:
Positive divergence: Identifies smart money leaving the market.
Negative divergence: Identifies smart money entering the market.
Reversal candlestick patterns include:
Buy signals: Morning Star, Bullish Engulfing, Hammer.
Strong Buy signals: Buy signals + Negative divergence
Sell signals: Evening Star, Bearish Engulfing, Shooting Star.
Strong Sell signals : Sell signals + Positive divergence
//Hope this system will be helpful for you!
UntouchedIBOB [DTMM]UntouchedIBOB - Indicator for TradingView
What does this indicator do?
The UntouchedIBOB indicator helps you identify special candlestick patterns on your chart: Inside Bars (IB) and Outside Bars (OB). These patterns can provide important signals for your trading decisions.
The two most important patterns:
Outside Bar (OB) - A candle whose high is higher and low is lower than the previous candle. It completely "engulfs" the previous candle.
Inside Bar (IB) - A candle whose high is lower and low is higher than the previous candle. It moves completely "inside" the previous candle.
Tested and recommended by professionals:
We are the main provider of trading indicators for Oliver Klemm , one of the most renowned traders in Germany and the entire DACH region. Our indicators are used daily in real-money trading by successful professional traders and are continuously improved. You benefit from the same professional technology that is used and recommended by leading market experts.
Main features:
Colored candles: Inside and Outside Bars are displayed in different colors
Lines: Shows horizontal lines at the midpoints of IB/OB that remain active until the price breaks through them
Arrows: Optional arrows above/below the IB/OB for better visibility
Alerts: Can notify you when new Inside or Outside Bars form
Special feature:
The indicator not only shows where IB/OBs are located but also tracks which ones are still "untouched" - meaning the price has not broken through that level again. This can be particularly valuable as untouched IB/OB levels often represent important support and resistance areas.
Customization options:
Enable/disable lines, arrows, and areas
Adjust colors for all elements
Arrow size (tiny, small, normal, large)
Choose between solid or dashed lines
Alert functions for new Inside and Outs
ide Bars
Use this indicator to more easily identify important candlestick patterns and identify potential trend reversals or continuations early.
-----------------------------------------------------------------
UntouchedIBOB - Indikator für TradingView
Was macht dieser Indikator?
Der UntouchedIBOB-Indikator hilft Ihnen, spezielle Kerzenmuster im Chart zu erkennen: Inside Bars (IB) und Outside Bars (OB). Diese Muster können wichtige Signale für Ihre Trading-Entscheidungen sein.
Die zwei wichtigsten Muster:
Outside Bar (OB) - Eine Kerze, deren Hoch höher und deren Tief tiefer ist als die vorherige Kerze. Sie "umschließt" also die vorherige Kerze vollständig.
Inside Bar (IB) - Eine Kerze, deren Hoch niedriger und deren Tief höher ist als die vorherige Kerze. Sie bewegt sich also komplett "innerhalb" der vorherigen Kerze.
Von Profis getestet und empfohlen:
Wir sind der Hauptlieferant von Trading-Indikatoren für Oliver Klemm , einen der bekanntesten Trader Deutschlands und der gesamten DACH-Region. Unsere Indikatoren werden von erfolgreichen Profi-Tradern täglich im Echtgeld-Handel eingesetzt und kontinuierlich verbessert. Sie profitieren von der gleichen professionellen Technologie, die von führenden Marktexperten genutzt und empfohlen wird.
Hauptfunktionen:
Farbige Kerzen: Inside und Outside Bars werden in verschiedenen Farben dargestellt
Linien: Zeigt horizontale Linien an den Mittelpunkten der IB/OB, die aktiv bleiben bis der Preis sie durchbricht
Pfeile: Optionale Pfeile über/unter den IB/OB für bessere Sichtbarkeit
Alarme: Kann Sie benachrichtigen, wenn neue Inside oder Outside Bars entstehen
Besonderheit:
Der Indikator zeigt nicht nur an, wo sich IB/OBs befinden, sondern verfolgt auch, welche noch "unberührt" sind - das heißt, der Preis hat das Level noch nicht wieder durchbrochen. Dies kann besonders wertvoll sein, da unberührte IB/OB-Levels oft wichtige Unterstützungs- und Widerstandsbereiche darstellen.
Einstellungsmöglichkeiten:
Ein-/Ausschalten von Linien, Pfeilen und Bereichen
Anpassung der Farben für alle Elemente
Wahl zwischen durchgezogenen oder gestrichelten Linien
Alarmfunktionen für neue Inside und Outside Bars
Nutzen Sie diesen Indikator, um wichtige Kerzenmuster leichter zu erkennen und potenzielle Trendwechsel oder Fortsetzungen frühzeitig zu identifizieren.

Sniper Trade Pro (ES 15-Min) - Topstep Optimized🔹 Overview
Sniper Trade Pro is an advanced algorithmic trading strategy designed specifically for E-mini S&P 500 (ES) Futures on the 15-minute timeframe. This strategy is optimized for Topstep 50K evaluations, incorporating strict risk management to comply with their max $1,000 daily loss limit while maintaining a high probability of success.
It uses a multi-confirmation approach, integrating:
✅ Money Flow Divergence (MFD) → To track liquidity imbalances and institutional accumulation/distribution.
✅ Trend Confirmation (EMA + VWAP) → To identify strong trend direction and avoid choppy markets.
✅ ADX Strength Filter → To ensure entries only occur in trending conditions, avoiding weak setups.
✅ Break-Even & Dynamic Stop-Losses → To reduce drawdowns and protect profits dynamically.
This script automatically generates Buy and Sell signals and provides built-in risk management for automated trading execution through TradingView Webhooks.
🔹 How Does This Strategy Work?
📌 1. Trend Confirmation (EMA + VWAP)
The strategy uses:
✔ 9-EMA & 21-EMA: Fast-moving averages to detect short-term momentum.
✔ VWAP (Volume-Weighted Average Price): Ensures trades align with institutional volume flow.
How it works:
Bullish Condition: 9-EMA above 21-EMA AND price above VWAP → Confirms buy trend.
Bearish Condition: 9-EMA below 21-EMA AND price below VWAP → Confirms sell trend.
📌 2. Liquidity & Money Flow Divergence (MFD)
This indicator measures liquidity shifts by tracking momentum changes in price and volume.
✔ MFD Calculation:
Uses Exponential Moving Average (EMA) of Momentum (MOM) to detect changes in buying/selling pressure.
If MFD is above its moving average, it signals liquidity inflows → bullish strength.
If MFD is below its moving average, it signals liquidity outflows → bearish weakness.
Why is this important?
Detects when Smart Money is accumulating or distributing before major moves.
Filters out false breakouts by confirming momentum strength before entry.
📌 3. Trade Entry Triggers (Candlestick Patterns & ADX Filter)
To avoid random entries, the strategy waits for specific candlestick confirmations with ADX trend strength:
✔ Bullish Entry (Buy Signal) → Requires:
Bullish Engulfing Candle (Reversal confirmation)
ADX > 20 (Ensures strong trending conditions)
MFD above its moving average (Liquidity inflows)
9-EMA > 21-EMA & price above VWAP (Trend confirmation)
✔ Bearish Entry (Sell Signal) → Requires:
Bearish Engulfing Candle (Reversal confirmation)
ADX > 20 (Ensures strong trending conditions)
MFD below its moving average (Liquidity outflows)
9-EMA < 21-EMA & price below VWAP (Trend confirmation)
📌 4. Risk Management & Profit Protection
This strategy is built with strict risk management to maintain low drawdowns and maximize profits:
✔ Dynamic Position Sizing → Automatically adjusts trade size to risk a fixed $400 per trade.
✔ Adaptive Stop-Losses → Uses ATR-based stop-loss (0.8x ATR) to adapt to market volatility.
✔ Take-Profit Targets → Fixed at 2x ATR for a Risk:Reward ratio of 2:1.
✔ Break-Even Protection → Moves stop-loss to entry once price moves 1x ATR in profit, locking in gains.
✔ Max Daily Loss Limit (-$1,000) → Stops trading if total losses exceed $1,000, complying with Topstep rules.
