Fair Value Gap Oscillator | Flux Charts💎 GENERAL OVERVIEW
Introducing the new Fair Value Gap Oscillator (FVG Oscillator) indicator! This unique indicator identifies and tracks Fair Value Gaps (FVGs) in price action, presenting them in an oscillator format to reveal market momentum based on FVG strength. It highlights bullish and bearish FVGs while enabling traders to adjust detection sensitivity and apply volume and ATR-based filters for more precise setups. For more information about the process, check the "📌 HOW DOES IT WORK" section.
Features of the new FVG Oscillator:
Fully Customizable FVG Detection
An Oscillator Approach To FVGs
Divergence Markers For Potential Reversals
Alerts For Divergence Labels
Customizable Styling
📌 HOW DOES IT WORK?
Fair Value Gaps are price gaps within bars that indicate inefficiencies, often filled as the market retraces. The FVG Oscillator scans historical bars to identify these gaps, then filters them based on ATR or volume. Each FVG is marked as bullish or bearish according to the trend direction that preceded its formation.
An oscillator is calculated using recent FVGs with this formula :
1. The Oscillator starts as 0.
2. When a new FVG Appears, it contributes (FVG Width / ATR) to the oscillator of the corresponding type.
3. Each confirmed bar, the oscillator is recalculated as OSC = OSC * (1 - Decay Coefficient)
The oscillator aggregates and decays past FVGs, allowing recent FVG activity to dominate the signal. This approach emphasizes current market momentum, with oscillations moving bullish or bearish based on FVG intensity. Divergences are marked where FVG oscillations suggest potential reversals. Bullish Divergence conditions are as follows :
1. The current candlestick low must be the lowest of last 25 bars.
2. Net Oscillator (Shown in gray line by default) must be > 0.
3. The current Bullish FVG Oscillator value should be no more than 0.1 below the highest value from the last 25 bars.
Traders can use divergence signals to get an idea of potential reversals, and use the Net FVG Oscillator as a trend following marker.
🚩 UNIQUENESS
The Fair Value Gap Oscillator stands out by converting FVG activity into an oscillator format, providing a momentum-based visualization of FVGs that reveals market sentiment dynamically. Unlike traditional indicators that statically mark FVG zones, the oscillator decays older FVGs over time, showing only the most recent, relevant activity. This approach allows for real-time insight into market conditions and potential reversals based on oscillating FVG strength, making it both intuitive and powerful for momentum trading.
Another unique feature is the combination of customizable ATR and volume filters, letting traders adapt the indicator to match their strategy and market type. You can also set-up alerts for bullish & bearish divergences.
⚙️ SETTINGS
1. General Configuration
Decay Coefficient -> The decay coefficient for oscillators. Increasing this setting will result in oscillators giving the weight to recent FVGs, while decreasing it will distribute the weight equally to the past and recent FVGs.
2. Fair Value Gaps
Zone Invalidation -> Select between Wick & Close price for FVG Zone Invalidation.
Zone Filtering -> With "Average Range" selected, algorithm will find FVG zones in comparison with average range of last bars in the chart. With the "Volume Threshold" option, you may select a Volume Threshold % to spot FVGs with a larger total volume than average.
FVG Detection -> With the "Same Type" option, all 3 bars that formed the FVG should be the same type. (Bullish / Bearish). If the "All" option is selected, bar types may vary between Bullish / Bearish.
Detection Sensitivity -> You may select between Low, Normal or High FVG detection sensitivity. This will essentially determine the size of the spotted FVGs, with lower sensitivies resulting in spotting bigger FVGs, and higher sensitivies resulting in spotting all sizes of FVGs.
3. Style
Divergence Labels On -> You can switch divergence labels to show up on the chart or the oscillator plot.
Cerca negli script per "Candlestick"

Mini ChartDescription:
The indicator displays a mini candlestick chart as a table. You can add up to 3 such charts and use different assets / timeframes in any of them. Each chart can have a max of 15-20 candles (depending on the settings). You can customise the colors and styles, including price scale, grid and a volume chart. If you hover on any displayed candle, you will see price and volume info for that candle. The candles can also be highlighted based on price or volume. The indicator can display data from both higher and lower timeframes, but is not updating very quickly if you display too many candles.
Inputs:
Each mini chart has inputs for:
- Number of candles
- Timeframe
- Asset
- Table position
- Table height
- Grid resolution
- Left and Right price scales
- Candle highlighting (which can be based on Min/Max price, Min/Max Volume, Rising/Falling Volume)
- And a checkbox for displaying volume chart below the candles
Below those inputs you have inputs for customising all the mini charts with the following:
- Header and Footer info
- Colors and styles of the charts, candles and price scales
- Sizing and spacing of the candles
- Height of the volume chart and padding of the price chart
Note:
The indicator utilises "table" objects. The limit of table cells for a chart is 10,000. Thus, the more candles you display in the mini charts, the more laggy the indicator will feel, and at some point you may surpass the 10,000 cells limit, at which point you're going to get an error.
The indicator might not update very quickly, especially if you're using data from lower timeframes.

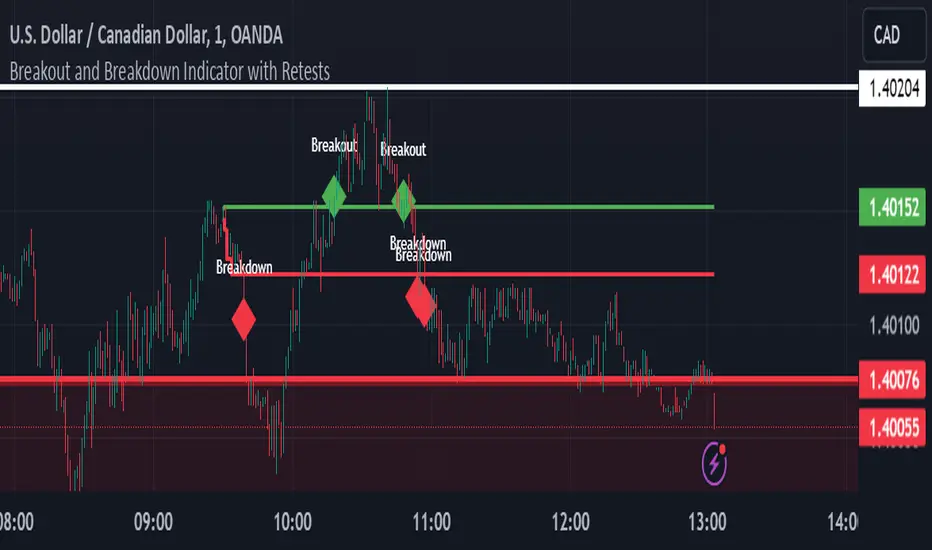
Breakout and Breakdown Indicator with RetestsThis indicator is designed to help traders identify high-probability breakout and breakdown points based on the first 5 minutes of market activity (9:30 am to 9:35 am). It works effectively on both the 1-minute and 5-minute timeframes, making it ideal for day traders and scalpers.
This indicator is a better indicator of my previous 5-Minute Opening Range Breakout indicator.
Key Features:
Dynamic Support and Resistance Lines: Automatically plots the highest and lowest price levels from 9:30 am to 9:35 am, providing essential support and resistance zones.
Breakout/Breakdown Detection: Identifies and marks successful breakout and breakdown points only after a confirmed retest, ensuring more accurate signals.
Visual Markers: Uses customizable green diamonds for successful breakouts and red diamonds for successful breakdowns, allowing easy identification on the chart.
Customization Options:
Change Colors: You can personalize the color of the breakout and breakdown markers, the label text, and the lines drawn from the 9:30 am to 9:35 am window.
Adapt to Your Chart: Adjust the indicator to match your preferred charting theme, ensuring it blends seamlessly with your trading setup.
How It Works:
Plots Key Levels: Identifies the highest and lowest prices during the first 5 minutes of trading (9:30 am to 9:35 am) and plots them on the chart.
Monitors Retests: Waits for a retest of these levels before confirming a breakout or breakdown.
Labels Breakouts/Breakdowns: After a retest, successful breakouts are marked with green diamonds and "Breakout" text, while breakdowns are marked with red diamonds and "Breakdown" text.
Why Use This Indicator?
Avoid False Signals: The retest requirement helps filter out false breakouts and breakdowns, offering more reliable trading signals.
Works Across Timeframes: Suitable for both 1-minute and 5-minute charts, allowing flexibility for different trading styles.
Some what Customizable: Adjust colors to fit your charting preferences and enhance visual clarity.
Recommended Use: Combine this indicator with other technical analysis tools, such as volume, candlestick patterns, or moving averages, for more informed trading decisions.
Bullish On Neck Candlestick patternExplanation:
1. Bullish Large Candle: The first candle is defined as bullish, where the closing price is much higher than the opening price. It also needs to have a large body (at least 60% of the total candle height).
2. Small Bearish Candle: The second candle is bearish and closes near the high of the previous bullish candle, with a relatively small body.
3. Bullish On Neck Detection: The script looks for this pattern where the bullish large candle is followed by a smaller bearish candle that closes near the first candle's high, indicating potential for a bullish breakout.
4. Plot: When the pattern is detected, the script places a green triangle above the bar to signal the bullish on neck pattern.

TechniTrend: Strong Candles DetectorTechniTrend: Strong Candles Detector
Description:
The TechniTrend: Strong Candles Detector indicator is designed to identify strong candlestick patterns based on customizable thresholds of candle strength, volume, and price volatility. By detecting significant candles that have a high proportion of body relative to total range, the indicator helps traders identify potential shifts in market direction, making it a useful tool for trend analysis and reversal spotting.
Key Features:
Candle Strength Detection: The indicator calculates the strength of a candle based on the ratio of its body (difference between open and close) to its total range (high minus low). If the body size exceeds a user-defined threshold, the candle is flagged as strong. This helps traders quickly identify key candles that may signal market movements.
Volume Confirmation (Optional): An optional volume confirmation allows the indicator to only flag candles as "strong" if the trading volume during the candle exceeds the average volume over a customizable period. This can help validate that a candle’s movement is backed by significant market participation.
Volatility Body Confirmation (Optional): Users can further refine the detection by requiring that the body of a strong candle exceed the average body size (volatility) of previous candles. This ensures that candles with greater price movement are prioritized.
Customizable Inputs:
Strength Threshold: Defines the minimum ratio of body to total range for a candle to be considered strong.
Moving Average Type: Choose from SMA, EMA, or WMA for calculating the moving average of volume or body volatility.
Volume and Body Confirmation: Adjust the percentage thresholds for the difference between the current volume/body size and their average values.
Visual Alerts: The indicator marks strong bullish candles with green upward labels below the candle, and strong bearish candles with red downward labels above the candle. Additionally, strong candles can be highlighted with a customizable background color for easier visualization.
How It Works:
Strength Ratio:
The core of this indicator is the calculation of the strength ratio, which is defined as the body size (open-close) divided by the total range (high-low). If the body size is larger relative to the total range and exceeds the user-defined threshold, the candle is flagged as strong.
Volume and Volatility Confirmation:
For traders seeking additional confirmation, the indicator can be configured to only mark candles if the current volume or body volatility exceeds the average by a user-defined percentage. These confirmations can be toggled on or off to suit different trading strategies.
Customization Options:
Strength Threshold (0-1):
Sets the minimum strength required for a candle to be flagged. A higher value will result in fewer but more significant candles being marked.
Volume Confirmation:
Toggle on to require a higher volume compared to the average volume for a candle to be confirmed as strong.
Volatility Body Confirmation:
Toggle on to require a larger candle body compared to the average body size for further confirmation.
Candle Color:
Choose the background color used to highlight strong candles.
Recommended Settings:
Strength Threshold: 0.7 (for a good balance between body and range)
Volume Difference: 0.05 (5% above the average volume)
Body Volatility Difference: 0.05 (5% above the average body size)
Length: 14 (for volume and volatility moving averages)
Conclusion: The TechniTrend: Strong Candles Detector is an easy-to-use yet powerful tool for traders who want to identify key candles that signal potential market trends. Its customizable settings allow for fine-tuning to fit different trading styles, whether looking for high-volume breakouts or significant price movements. The indicator offers both a visual and configurable alert system to help traders make more informed decisions.

CRT IndicatorCandle Range Trading (CRT) Indicator
The CRT Indicator identifies potential trading opportunities by analyzing specific candlestick patterns. This script is designed to detect both bullish and bearish CRT patterns and provides visual cues directly on your chart.
Features:
Pattern Detection:
Analyzes two consecutive candles to identify the CRT pattern.
Detects both bullish and bearish setups based on the relative positions of the candles.
How It Works:
Bearish CRT Pattern:
The script identifies a bearish CRT when:
The first candle is bullish (closing price is higher than the opening price).
The second candle is bearish (closing price is lower than the opening price).
The second candle’s high exceeds the high of the first candle.
The closing price of the second candle falls within the range of the first candle.
Bullish CRT Pattern:
The script identifies a bullish CRT when:
The first candle is bearish (closing price is lower than the opening price).
The second candle is bullish (closing price is higher than the opening price).
The second candle’s low is below the low of the first candle.
The closing price of the second candle falls within the range of the first candle.
Visual Signals:
A red triangle is plotted above the candles for a bearish CRT pattern.
A green triangle is plotted below the candles for a bullish CRT pattern.
How to Use:
Monitor the chart for the appearance of red and green triangles.
Green triangles suggest potential bullish movements.
Red triangles suggest potential bearish movements.
Use these signals as part of a comprehensive trading strategy and combine with other technical indicators for best results.
Settings:
This indicator operates with default settings for detecting CRT patterns and does not include customizable parameters.
Limitations:
The CRT Indicator is based on two consecutive candles and does not account for broader market trends or other indicators.
Be aware that false signals may occur in volatile or choppy market conditions.
The indicator does not provide entry points, profit targets, or stop loss levels, which should be managed based on individual risk tolerance and strategy.
Note: The CRT Indicator is for informational purposes only and should be used in conjunction with other forms of analysis and proper risk management. Always test any strategy thoroughly before applying it to live trading.

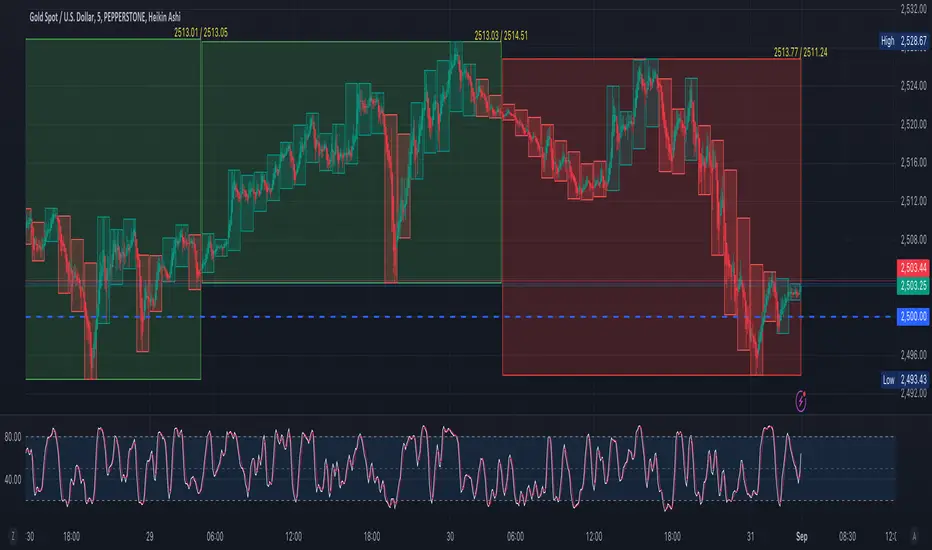
Duo Multi-Time Period Charts# Duo Multi-Time Period Charts
## Description
The Duo Multi-Time Period Charts indicator is a versatile tool designed to visualize price action across two different timeframes simultaneously. It overlays color-coded boxes on your chart, representing the price range for each period in both timeframes. This allows traders to easily identify trends, support, and resistance levels across multiple time horizons.
## Key Features
- Displays two user-defined timeframes (default: Daily and Weekly)
- Customizable calculation methods: High/Low Range, True Range, or Heikin Ashi Range
- Color-coded boxes for easy trend identification (bullish/bearish)
- Optional labels showing open and/or close prices
- Fully customizable colors for boxes and labels
## How It Works
1. The indicator creates boxes for each period in both selected timeframes.
2. Box colors change based on whether the close is higher (bullish) or lower (bearish) than the open.
3. Box heights are determined by the selected calculation method:
- High/Low Range: Uses the period's high and low
- True Range: Incorporates the previous close for more volatility representation
- Heikin Ashi Range: Uses a modified candlestick calculation for smoother trends
4. Optional labels display open and/or close prices for each period.
## Use Cases
- Multi-timeframe analysis: Compare short-term and long-term trends at a glance
- Support and resistance identification: Easily spot key levels across different timeframes
- Trend confirmation: Use the color-coding to confirm trend direction and strength
- Volatility assessment: Compare box sizes to gauge relative volatility between timeframes
## Customization
Users can customize various aspects of the indicator, including:
- Timeframes for analysis
- Calculation method for price ranges
- Color schemes for bullish and bearish periods in both timeframes
- Label content and colors
- Visibility options for boxes and labels
## Recommendation
For optimal clarity, it is recommended to enable price labels for only one timeframe. Displaying labels for both timeframes simultaneously may lead to cluttered and difficult-to-read charts, especially on shorter timeframes or when the two selected periods are close in duration.
This indicator is perfect for traders who want to incorporate multi-timeframe analysis into their trading strategy without cluttering their charts with multiple indicators. By following the label recommendation, users can maintain a clean chart while still benefiting from the multi-timeframe insights provided by the indicator.
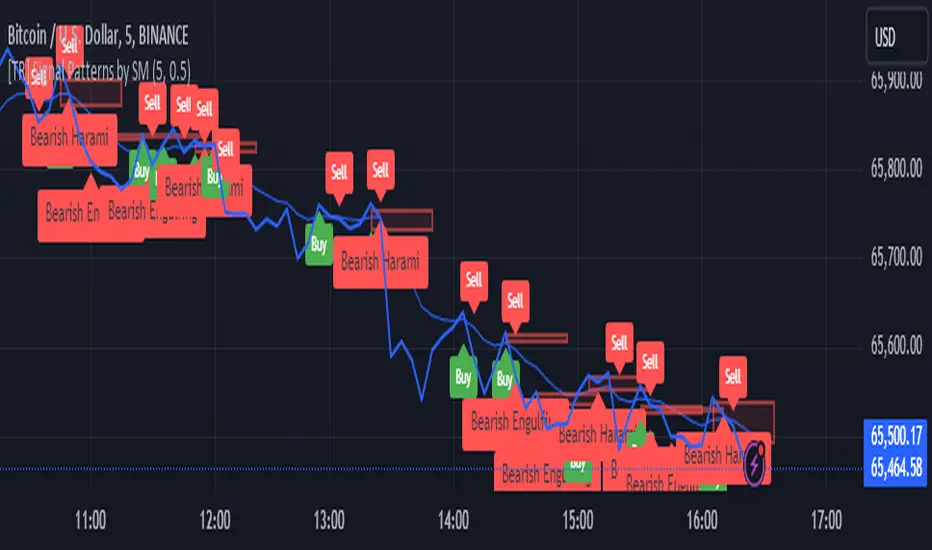
[TR] Engulf Patterns by SM
Engulf Pattern by SM
Overview:
The " Engulf Pattern by SM" script is designed to identify bullish and bearish engulfing candlestick patterns on TradingView charts. Engulfing patterns are significant in technical analysis as they often indicate potential reversals in market trends.
Features:
- Bullish Engulfing Pattern Detection: The script identifies bullish engulfing patterns, which occur when a larger bullish candle completely engulfs the body of the previous smaller bearish candle.
- Bearish Engulfing Pattern Detection: Similarly, it detects bearish engulfing patterns, where a larger bearish candle engulfs the body of the preceding smaller bullish candle.
- Body Size Filtering: The script includes a feature to filter patterns based on the size of the candle bodies, allowing for more precise marking of significant patterns.
- Visual Markers: The script plots visual markers on the chart to highlight the detected engulfing patterns, making it easy for traders to spot them.
How It Works:
1. Bullish Engulfing Pattern:
- The script checks for a smaller bearish candle followed by a larger bullish candle.
- The body of the bullish candle must completely cover the body of the bearish candle.
- The size of the bullish candle's body must meet a specified threshold to be considered significant.
2. Bearish Engulfing Pattern:
- The script looks for a smaller bullish candle followed by a larger bearish candle.
- The body of the bearish candle must completely engulf the body of the bullish candle.
- The size of the bearish candle's body must meet a specified threshold to be considered significant.
Usage:
- Add the Script: Apply the " Engulf Pattern by SM" script to your TradingView chart.
- Configure Settings: Customize the script settings to suit your trading strategy, including visual marker styles and body size thresholds.
- Monitor Visual Markers: Keep an eye on the visual markers to identify potential trading opportunities based on engulfing patterns.
Disclaimer:
This script is not intended to be used as a direct entry signal. It should be used as a confluence in your overall trading plan. Always conduct your own analysis and consider multiple factors before making any trading decisions.
Feel free to customize this writeup further to match your specific needs! If you have any other requests or need additional details, just let me know.
Supertrend (Buy/Sell) With TP & SLSupertrend (Buy/Sell) with TP & SL: An Enhanced Trading Tool
This Pine Script indicator combines the popular Supertrend indicator with multiple take-profit (TP) and stop-loss (SL) levels, providing traders with a comprehensive visual aid for potential entries, exits, and risk management.
Originality
Buffer Zones for Precision: Instead of relying solely on the Supertrend line, this script incorporates buffer zones around it. This helps filter out false signals, especially in volatile markets, leading to more accurate buy/sell signals.
Flexible Stop-Loss: Offers the choice between a fixed or trailing stop-loss, allowing traders to tailor their risk management approach based on their preferences and market conditions.
Multiple Take-Profit Levels: Provides three potential take-profit levels, giving traders the flexibility to secure profits at different stages of a trend.
Heikin Ashi Candles & VWAP: Incorporates Heikin Ashi candles for smoother trend visualization and adds a VWAP line for potential support/resistance levels.
Clear Table Display: Presents key information like Stop Loss and Take Profit levels in a user-friendly table, making it easier to track trade targets.
How It Works
Supertrend Calculation: The Supertrend is calculated using ATR (Average True Range) to gauge market volatility. The script then creates buffer zones around the Supertrend line for refined signal generation.
Buy/Sell Signals:
Buy: When the close price crosses above the upper buffer zone, indicating a potential uptrend.
Sell: When the close price crosses below the lower buffer zone, suggesting a potential downtrend.
Take Profit & Stop Loss:
Take Profits: Three TP levels are calculated based on ATR and a customizable profit factor.
Stop Loss: The stop-loss can be set as either a fixed value based on ATR or as a trailing stop-loss that dynamically adjusts to lock in profits.
How To Use
Add the Indicator: Search for "Supertrend (Buy/Sell) With TP & SL" in the TradingView indicators list and add it to your chart.
Customize Inputs: Adjust parameters like ATR Period, Factor, Take Profit Factor, Stop Loss Factor, Stop Loss Type, etc., based on your trading style and preferences.
Interpret Signals: Look for buy signals when the price crosses above the upper buffer and sell signals when it crosses below the lower buffer.
Manage Risk: Use the plotted Take Profit and Stop Loss levels to manage your risk and potential rewards.
Concepts
Supertrend: A trend-following indicator that helps identify the direction of the prevailing trend.
ATR (Average True Range): A measure of market volatility.
Buffer Zones: Used to filter out false signals by creating a zone around the Supertrend line.
Trailing Stop Loss: A dynamic stop-loss that moves with the price to protect profits.
Heikin Ashi: A type of candlestick chart designed to filter out market noise and make trends easier to identify.
VWAP (Volume Weighted Average Price): An indicator that shows the average price at which a security has traded throughout the day, based on both volume and price.
Important Note: This script is for educational and informational purposes only. Backtest thoroughly and use with caution in live trading. Always manage your risk appropriately.

Engulfing Candle Indicator with SweepTHIS IS ENGULFED SWEEP CANDLE
This TradingView indicator identifies and highlights bullish and bearish engulfing candlestick patterns with an additional condition: the recent candle must "sweep" the high or low of the previous candle. This refined approach helps to confirm the strength of the engulfing pattern by ensuring that the current candle extends beyond the previous candle's range.
Features:
- **Bullish Engulfing Detection**: Identifies a bullish engulfing pattern where the current candle fully engulfs the previous candle's body, and the low of the current candle is below the low of the previous candle.
- **Bearish Engulfing Detection**: Identifies a bearish engulfing pattern where the current candle fully engulfs the previous candle's body, and the high of the current candle is above the high of the previous candle.
- **Visual Indicators**: Marks bullish engulfing patterns with a green label below the bar and bearish engulfing patterns with a red label above the bar.
- **Alert Conditions**: Provides customizable alerts for detected patterns, enabling you to be notified when a bullish or bearish engulfing pattern with a sweep is detected.
#### Usage:
1. **Apply to Chart**: Add the indicator to your chart to start detecting engulfing patterns with sweep conditions.
2. **Set Alerts**: Configure alerts to receive notifications when the indicator identifies a bullish or bearish engulfing pattern with a sweep.
#### Ideal For:
- Traders looking for additional confirmation in engulfing patterns.
- Users who want to incorporate price action signals into their trading strategy.
By incorporating the sweep condition, this indicator aims to enhance the reliability of the engulfing patterns and provide more actionable signals.
---
Feel free to adjust the description based on any specific details or features you want to highlight. If there are any additional features or details about the indicator that should be included, let me know!

BooBee Digital - Enhanced Buy & Sell Alerts Suite
BooBee Digital - Enhanced Buy & Sell Alerts Suite
Introduction:
The “BooBee Digital - Enhanced Buy & Sell Alerts Suite” is a comprehensive trading tool designed to provide traders with precise buy and sell signals by integrating the Average True Range (ATR) trailing stop technique and the Volume Weighted Average Price (VWAP) indicator. This script is tailored to help traders make informed decisions by considering both market volatility and trading volume.
How It Works:
1. ATR Calculation:
• Purpose: Measures market volatility to set dynamic stop levels.
• Details: The Average True Range (ATR) is calculated over a user-defined period. The ATR value reflects the average range of price movements over the specified period, which is crucial for assessing market volatility.
2. ATR Trailing Stop:
• Purpose: Identifies potential trend reversals by setting trailing stops based on market volatility.
• Details: The ATR trailing stop is dynamically adjusted using the ATR value and a user-defined sensitivity factor. This trailing stop level helps identify trend reversals by moving in accordance with price fluctuations.
3. VWAP Calculation:
• Purpose: Provides a volume-weighted average price to benchmark fair value.
• Details: The VWAP is calculated by taking the sum of the product of price and volume, divided by the total volume. This indicator gives traders a reference point for the average price at which the asset has traded throughout the day, considering trading volume.
4. EMA Crossover:
• Purpose: Adds a confirmation layer for buy and sell signals.
• Details: A 1-period Exponential Moving Average (EMA) is used to identify short-term price movements. Buy and sell signals are generated based on the crossover of the EMA and the ATR trailing stop, adding an extra layer of confirmation for trade entries and exits.
Signal Generation:
Buy Signal:
• Generated when the price is above the ATR trailing stop and there is a bullish crossover of the EMA and ATR trailing stop.
• Indicator: Green label below the bar with “Buy” text.
Sell Signal:
• Generated when the price is below the ATR trailing stop and there is a bearish crossover of the EMA and ATR trailing stop.
• Indicator: Red label above the bar with “Sell” text.
VWAP Line:
• The VWAP line is plotted on the chart to help traders identify significant price levels based on trading volume.
• Indicator: Blue line representing the VWAP.
How to Use:
• Chart Type: The script is designed for use on standard chart types such as Candlestick and OHLC. It does not support non-standard chart types like Heikin Ashi, Renko, Kagi, Point & Figure, and Range, as they may produce unrealistic results.
• Clean Chart: Ensure your chart is clean and free of other indicators to avoid confusion. The signals and colors plotted by the script should be easily identifiable.
• Trade Confirmation: Use the buy and sell signals generated by the script in conjunction with other analysis methods to confirm trades.
Key Concepts:
• ATR Trailing Stop: This technique sets dynamic stop levels based on market volatility, helping to identify trend reversals.
• VWAP: This indicator provides a benchmark for the average price considering trading volume, helping traders identify fair value.
• EMA Crossover: This adds a layer of confirmation for buy and sell signals, improving the accuracy of trade entries and exits.

Liquidity Grab Zones | Flux Charts💎 GENERAL OVERVIEW
Introducing our new Liquidity Grab Zones Indicator! This indicator finds liquidity grabs in the current ticker and renders buyside & sellside liquidity grab zones. The retests and breakout of the zones are labeled, and you can set up alerts to get notified. For more information, please check the "HOW DOES IT WORK" section.
Features of the new Liquidity Grab Zones Indicator :
Renders Buyside & Sellside Liquidity Grab Zones
Retests & Breaks
Inverse Zones After Broken Feature
Alerts For All Features
Customizable Algorithm
Customizable Styles
🚩UNIQUENESS
Liquidity grabs can be useful when determining candles that have executed a lot of market orders, so you can plann your trades accordingly. This indicator lets you customize the pivot length and the wick-body ratio for liquidity grabs, provide retest & breakout labels, with customized styling and alerts.
📌 HOW DOES IT WORK ?
Liquidity grabs occur when one of the latest pivots has a false breakout. Then, if the wick to body ratio of the bar is higher than 0.5 (can be changed from the settings) a zone is plotted.
These zones usually indicate areas of high market interest where price action may reverse or accelerate. Identifying these zones can provide traders with critical levels for entering or exiting trades. A breakout of these zones generally mean strong movements are inbound, while failing breakouts make these zones act like support / resistance zones.
The indicator also reverses the type of the zone after an invalidation (can be turned off from the settings). This feature helps traders identify potential reversals more accurately.
The zone width is set to the area from the wick to the body of the candlestick, which can be seen here :
⚙️SETTINGS
1. General Configuration
Pivot Length -> This setting determines the range of the pivots. This means a candle has to have the highest / lowest wick of the previous X bars and the next X bars to become a high / low pivot.
Wick-Body Ratio -> After a pivot has a false breakout, the wick-body ratio of the latest candle is tested. The resulting ratio must be higher than this setting for it to be considered as a liquidity grab.
Zone Invalidation -> Select between Wick & Close price for Liquidity Grab Zone Invalidation.
Use these customizable settings to fine-tune the indicator according to your trading strategy and preferences.

Svopex Pin Bar DetectorThe Pin Bar Detector is a technical analysis tool designed to identify pin bar candlestick patterns on trading charts. A pin bar is characterized by a small candle body and a long shadow, indicating a significant rejection of prices that can signal potential reversals in the market.

DCA StrategyIntroducing the DCA Strategy, a powerful tool for identifying long entry and exit opportunities in uptrending assets like cryptocurrencies, stocks, and gold. This strategy leverages the Heikin Ashi candlestick pattern and the RSI indicator to navigate potential price swings.
Core Functionality:
Buy Signal : A buy signal is generated when a bullish (green) Heikin Ashi candle appears after a bearish (red) one, indicating a potential reversal in a downtrend. Additionally, the RSI must be below a user-defined threshold (default: 85) to prevent buying overbought assets.
Sell Signal : The strategy exits the trade when the RSI surpasses the user-defined exit level (default: 85), suggesting the asset might be overbought.
Backtesting Flexibility : Users can customize the backtesting period by specifying the start and end years.
Key Advantages:
Trend-Following: Designed specifically for uptrending assets, aiming to capture profitable price movements.
Dynamic RSI Integration: The RSI indicator helps refine entry signals by avoiding overbought situations.
User-Defined Parameters: Allows customization of exit thresholds and backtesting periods to suit individual trading preferences.
Commission and Slippage: The script factors in realistic commission fees (0.1%) and slippage (2%) for a more accurate backtesting experience.
Beats Buy-and-Hold: Backtesting suggests this strategy outperforms a simple buy-and-hold approach in uptrending markets.
Overall, the DCA Strategy offers a valuable approach for traders seeking to capitalize on long opportunities in trending markets with the help of Heikin Ashi candles and RSI confirmation.
Magic VIBs V1Introducing the "Magic Vib Indicator" V1 Adeed more extention so it works better on higher time frames, Plus a colour changer so now you can pick a colour for bullish and bearish
a powerful tool designed to identify and highlight unique market scenarios known as "magic volume imbalances." This indicator is specifically crafted to recognize specific candlestick patterns that have demonstrated a significant impact on price movements.
The Magic Vib Indicator is meticulously engineered to detect a particular pattern, which occurs when the high of the first candle aligns perfectly with the open of the subsequent candle, while simultaneously witnessing the close of the first candle matching the low of the second candle. These precise conditions generate what is commonly referred to as a "magic vib."
This indicator has been developed with the sole purpose of capturing these magical moments in the market. By systematically scanning and analyzing price data, it spots instances where these extraordinary price imbalances occur. Once identified, the indicator promptly marks these candles on your trading platform, providing clear visual cues for enhanced decision-making.
The Magic Vib Indicator acts as a catalyst for traders and investors, as it has proven to be a reliable precursor to significant price reactions. These marked candles act as potent signals, suggesting an impending shift in market sentiment and a high probability of substantial price movement. The resulting price action often sees significant volatility, making it an enticing opportunity for those seeking substantial gains.
However, it's important to note that while the Magic Vib Indicator offers valuable guidance, it should not be the sole basis for trading decisions. It is crucial to incorporate other technical and fundamental analysis tools, risk management strategies, and market awareness to achieve consistent success.
In summary, the Magic Vib Indicator represents a breakthrough in technical analysis, specifically tailored to identify and mark candles exhibiting the remarkable characteristics of a "magic volume imbalance." By harnessing the power of this indicator, traders can anticipate substantial price reactions, allowing them to seize opportunities and maximize their trading outcomes.
HTF CandlesHTF Candles Indicator (High Time Frame Candles for Low Time Frame Charts)
Overview:
This indicator plots High Time Frame (HTF) candle boxes on Lower Time Frame (LTF) charts. The purpose is to provide traders with a visual representation of (HTF) candlestick movements on a lower timeframe (LTF) within a specified interval.
Usage:
Traders can utilize this indicator to gain insights into HTF candle movements on LTF charts. It helps in identifying the range, direction, and bodies of candles from a higher timeframe perspective.
HTF Candle Box Formation:
The script identifies the start of a new interval on the HTF by monitoring changes in the specified timeframe (Interval).
For each new interval, it records key data points, including the open, high, low, and bar index.
The indicator then uses this information to draw a box on the LTF chart, encapsulating the HTF candle's high and low.
Candle Body Representation:
Users can choose to include the candle body in the box (BodyCandleBox).
If selected, the script draws an additional box representing the HTF candle body, from the open to the previous bar's close.
Color Customization:
Traders can customize box colors for long and short candles on the HTF.
Boxes can be transparent or filled with a specified color.
Multiple Timeframes:
The script supports multiple timeframes simultaneously, allowing traders to overlay HTF candle boxes from different intervals on the same chart.
Configurable options (Interval, Interval1, Interval2) provide flexibility in selecting additional timeframes.
Note:
Understanding the visual representation of HTF candles on LTF charts can aid traders in making more informed decisions, especially when considering the interplay between different timeframes.

Moving Average [chkd]日本語の説明は英語の説明の後にあります。
========= English =========
Various analyses of moving averages have been introduced, but the key points to observe are often quite similar. To efficiently observe the following points, I have created this indicator:
The positional relationship between each moving average and candlestick
The slope (directionality) of the moving averages
Moving averages from different time frames
The positional relationship of moving averages is classified into stages:
Stage 1: Short-term MA > Medium-term MA > Long-term MA (Perfect Order)
Stage 2: Medium-term MA > Short-term MA > Long-term MA
Stage 3: Medium-term MA > Long-term MA > Short-term MA
Stage 4: Long-term MA > Medium-term MA > Short-term MA (Reverse Perfect Order)
Stage 5: Long-term MA > Short-term MA > Medium-term MA
Stage 6: Short-term MA > Long-term MA > Medium-term MA
The features of this indicator include:
Displaying multi-timeframe stages in a table
Showing the transition history of stages with dashed lines at the bottom
Selectable table size (compatible with PC and smartphones)
========= Japanese =========
移動平均線の分析は色々紹介されていますが、見るポイントはどれもよく似ています。
以下のポイントを効率よく見れるように、このインジを作成しました。
各移動平均線とローソク足の位置関係
移動平均線の傾き(方向性)
異なるタイムフレームの移動平均線
移動平均線の位置関係は、ステージとして分類しています。
stage1 : 短期MA > 中期MA > 長期MA (パーフェクトオーダー)
stage2 : 中期MA > 短期MA > 長期MA
stage3 : 中期MA > 長期MA > 短期MA
stage4 : 長期MA > 中期MA > 短期MA (逆パーフェクトオーダー)
stage5 : 長期MA > 短期MA > 中期MA
stage6 : 短期MA > 長期MA > 中期MA
移動平均線の分析で、非常にわかりやすいものに小次郎講師の大循環分析があります。
書籍や無料のyoutubeもあるので、併せてみてもらえるとこのインジの使い方のイメージが湧きやすくなると思います。
このインジでは以下の特徴があります。
マルチタイムのステージをテーブルで表示
ステージの変換履歴を下部の点線で表示
テーブルサイズは選択可(pc,スマホ対応)

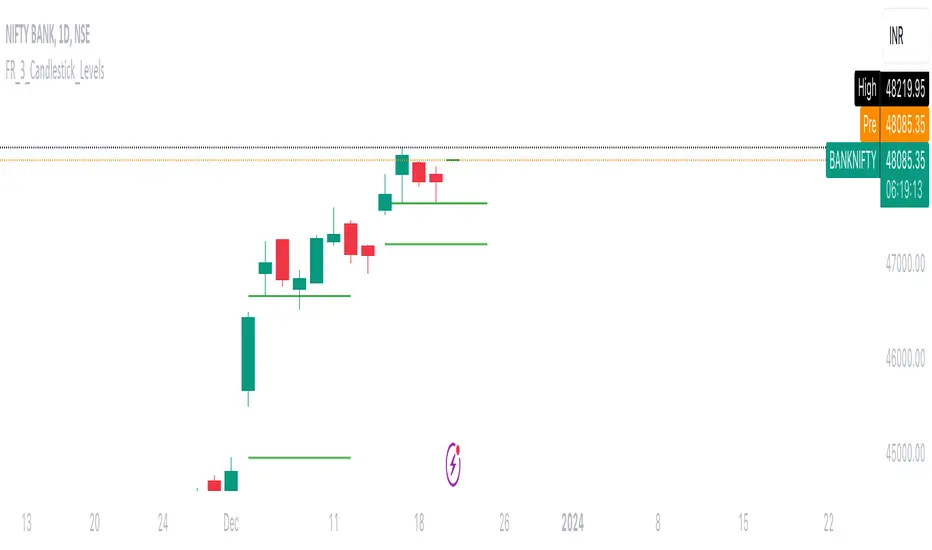
FalconRed 3 Candlestick LevelsThis Pine Script indicator is designed to enhance price action analysis by identifying specific candle patterns that signal potential buying and selling levels. The analysis is based on the characteristics of the current candle and its two immediate predecessors.
For identifying buying levels, the script examines the wicks of the candles, highlighting areas where buying and selling struggle is evident. The indicator recognizes significant breaks above wick levels, especially when followed by a subsequent candle with a lower wick. This combination suggests that previous selling pressure has been challenged and overcome.
Buy breakout and retest levels are highlighted with green color, providing a clear visual indication of potential buying opportunities. The indicator draws horizontal lines that extend to the right, offering insights into the frequency of retests and the recurrence of similar patterns in specific price zones, thereby confirming and reinforcing the observed price action.
Similarly, the indicator scrutinizes the selling side, pinpointing breakdown and retest levels. These areas are highlighted with red color, aiding in the identification of potential selling opportunities.
This indicator serves as a valuable tool for analyzing price action levels and visualizing buying and selling areas. It can be effectively combined with other technical indicators to enhance confidence in trading decisions. Gain deeper insights into market dynamics and improve decision-making by integrating this candle pattern analysis indicator into your trading strategy.
Hammer and inverted Hammer
The "Hammer and Inverted Hammer" indicator is straightforward and effective. It automatically spots key candlestick patterns for you, making it easier to see potential market turns. You can also adjust a few settings to fit your trading style. Simple, yet quite handy for traders!
Alerts for Hammer Pattern: When the script identifies a Hammer pattern, it can trigger an alert. This is particularly useful if you're looking for potential bullish reversal signals and don't want to miss them.
Alerts for Inverted Hammer Pattern: Similarly, when an Inverted Hammer pattern is detected, the script can also trigger an alert. This is helpful for spotting potential bearish reversal signals.
SETTINGS EXPLAINED
Minimum Lower Tail Length (%): This setting allows you to define what percentage of the total candle size should be considered a significant lower tail. This is important for identifying the Hammer pattern.
Number of Consecutive Candles (for Lower Tails): This input lets you choose how many consecutive candles with significant lower tails must be present to identify a pattern.
Percentage of Candle Below Previous Low: This setting determines what percentage of the candle's range must extend below the lowest low of a specified number of previous candles. It's used to assess the significance of a Hammer pattern.
Number of Previous Candles for Lowest Low: This decides how many previous candles the script should look at to calculate the lowest low, which is then used in the Hammer pattern analysis.
Minimum Upper Tail Length (%): Similar to the lower tail setting, this defines the significant length of an upper tail, used for identifying the Inverted Hammer pattern.
Number of Consecutive Candles (for Upper Tails): This input is for setting how many consecutive candles with significant upper tails are required to confirm an Inverted Hammer pattern.
Percentage of Candle Above Previous High: This setting is used to determine how much of the candle's range must be above the highest high of a set number of previous candles, aiding in the identification of the Inverted Hammer pattern.
Number of Previous Candles for Highest High: It specifies the number of past candles to consider for calculating the highest high, which is important for the analysis of Inverted Hammer patterns.
These settings allow you to customize how the script identifies Hammer and Inverted Hammer patterns, making it adaptable to different trading strategies and market conditions.

itradesize /\ Previous HTF x OHLC Box
FYI: It is an invite-only script, if you are interested in, please scroll down to see the Author's instructions.
Introducing an indicator which inspired by ICT concepts that use a model, based on what TTrades teaches in some of his DOL videos about how to get a proper bias.
Having a daily bias can be frustrating and this script could make it easy for you besides creating a ton of opportunities for scalpers as well as not only helpful for a daily bias, it can also help you to determine the actual H4 or H1 bias or even lower.
Always keep in mind: the higher the timeframe you use, the more accurate it can be.
You can use OHLC to determine the current or higher time frame bias as it can be used on any of them and properly gain a sentiment of a drawn of liquidity.
This model integrates the previous candle's open, high, low, and close values (or open, low, high close) in addition to their equilibrium to make it easier to identify where the price should go moreover they can be used as reference points for potential trading opportunities.
The 50% also known as equilibrium creates premium and discount zones within the previous candles. Using the former higher timeframe candle’s OHLC you can simply have an external range of liquidity and where the current price should it drawn to.
With this tool, you can achieve a proper trading framework as you can easily recognize the external & internal range of liquidity, so whether you are a scalper or a day trader you are able to rely on the indicator.
A bit of a candlestick analysis:
When the price wicks below means a potential bullish reversal is incoming.
When the price wicks above, then it means a potential bearish reversal is happening.
Closing below means lower prices. (Bearish trend)
Closing above means higher prices. (Bullish trend)
This indicator is an absolute monster for the OHLC guys.
How to use it?
- Analyse the trend on the higher timeframe, bullish trend is when the price continuously takes the previous candle’s high over and over again. Bearish trend is the total opposite.
- Wait for external liquidity to be taken.
- When it's happening there should be a displacement back to the range with an actual structure shift.
- Looking for an imbalance in the displacement.
- Aiming for an imbalance that is above 50% of the former move.
- Aggressive stop: below or above the candle which has an imbalance
- Conservative stop: below or above the former swing
Classic sell setup:
Classic buy setup:
The indicator has a ton of customizable features, the power of the tool is really in there, as you can find or refine your own model with it. Once you're familiar with your setup you will be really feeling the power of the tool, I promise.
Indicator Features:
• M5/M15/H1/H4/D Time frames
• OHLC bar with an offset (you can have a look at the current HTF bar developing or you can use it as a locked previous bar)
• Current time frame OHLC / OLHC box with extended lines to the current time
• Showing the previous time frame OHLC / OLHC box with extended lines and the ability to add labels. The color of the OHLC or OLHC box is based on the candle closing. If it's a bear candle, if it's a bull candle.
• Previous high time frame open / close lines with labels, customisable colours, label sizes
• It has a lot of customisable features, the power of the tool is really in there as you can find or refine your own model with it.
• Every box and bar automatically switches its colors based on the close of the candle whether it's a bear or a bull candle.
• The color of the labels is switching automatically based on the coloring of your chart.
• You can customize each and every box color - OHLC/OLHC based on your taste, and the open and closing lines of the previous HTF.
Additional Information:
You can combine it with my own model. If you are not familiar with it, you can find here .
Or you can combine it with other frameworks for extra confluences like combining it with Daye’s QT in some simple equation:
Open → Q1 , High → Q2, Low → Q3, Close → Q4
Open → Q1, Low → Q2, High → Q3, Close → Q4

SpiceIn the chart photo is a description for each shape and letter, saying what each one is.
BB, Reversals are off by default.
BB + Reversals + Next bar confirmation - The way this should be used is by waiting for a 1 or 2 bar confirmation closed above/below the high/low of the Reversal candle. So if its a Top R, a yellow box will print as a confirmed 1 bar if it closed below the top R's low, then you can wait for the second bar to close also below the Top R's low. Vice versa with the Bot R.
RSI arrows - Essentially showing you when the multi time frame RSIs are coming back up above 30, or below 70. Respective to what time frames you have selected.
Three Line Strike - A trend continuation candlestick pattern consisting of four candles
Leledc Exhaustion suggest the trend may be reversing. Combined with the moving average as a trend filter, the indicator can signal the end of a pull back and the continuation of the trend.
EMAs - Help measuring the trend direction over a period of time.
Credit to all these amazing creators -
Multi Timeframe RSI (LTF) by @millerrh
3 Line Strike by @Lij_MC 'MarketVision A'
Leledc Exhaustion by @glaz, used updated version by @Joy_Bangla
If anyone uses the BB reversals source code to put into their own indicator/strategy, you are free to do so. Just send me a message I'd love to see your work with it! :)
Thanks to Lij_MC's MarketVision A indicator for inspiring me to add more features. At first it was just the RSI Arrows and the BB reversals candles + Condition but then I found MarketVision A and loved the extra Leledc and 3 Line Strike features.
Hope you enjoy this Spice!
No Signal is 100% correct at what it's trying to do. Use caution when trading!
Practice Risk Management.

S/R and Reversal BarsToday I'm proposing an idea to form S/R with a slightly different basic idea. This is a combination of CCI and candlestick study, and we will use this to mark possible reversal candles and possible S/R lines.
This is nothing complicated, I've used a basic CCI indicator with certain rules/system to mark S/R levels on the chart. (Have loaded traditional CCI indicator on bottom for comparison)
S/R levels are market as followed
Cross -
Lime = Support
Red = Resistance
Zero/Balance line - Yellow circles
The idea is to use this indicator to trade sideways market more successfully, in trending market this can be futile if you are not waiting for the break-out or breakdowns with confirmation.
Since this is based on CCI, it will give static result only when bar is closed, till then it will be susceptible for repaint. This is inherited nature from CCI readings on current bar. I could change this to only making reading on closed bar (historical bar), but that takes away from the uniqueness of this indicator in giving early indications.
This is a great tool for intraday scalping, but it does work on all timeframes, it's not bound by granularity.
This is for education purpose only.
Past success or seemingly positive results on published posts are not indication of future success.

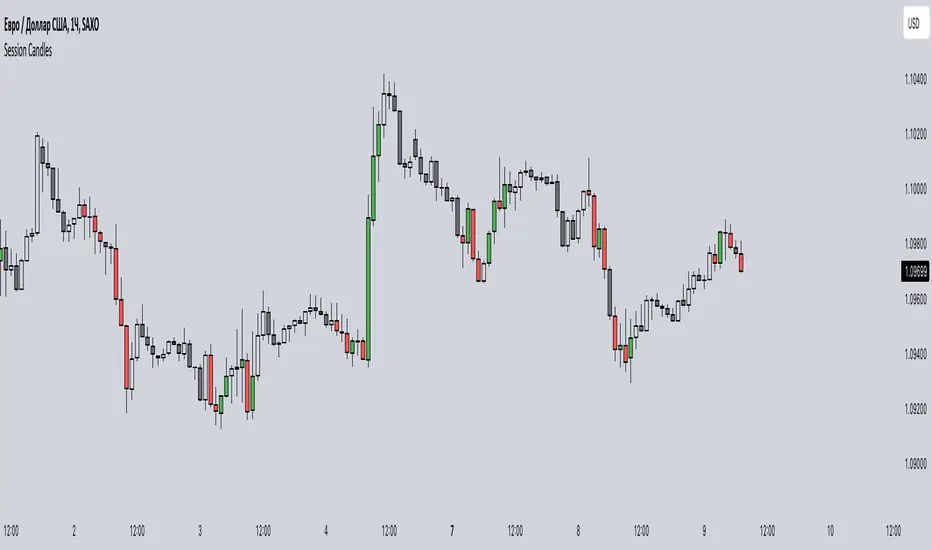
Session CandlesThis indicator is designed to visually represent different trading sessions on a price chart, highlighting candlestick colors to distinguish between bullish (upward movement) and bearish (downward movement) trends during various market sessions. Here's an overview of how the indicator works:
1. Session Definition: The indicator defines four distinct trading sessions:
- London Session: Typically covering the European trading hours.
- New York AM Session: Representing the morning hours of the New York trading session.
- New York PM Session: Representing the afternoon hours of the New York trading session.
- Asia Session: Encompassing the trading hours of the Asian markets.
2. Configuration Options: Users can customize the behavior of the indicator through input options. For each session, users can enable or disable the display of session-specific candles.
3. Candle Coloring: The indicator determines the color of candles based on the following criteria:
- For each session, it checks whether the current candle's closing price is higher than its opening price.
- If the closing price is higher, the candle is considered bullish, and a user-defined green color is used for the candle.
- If the closing price is lower, the candle is considered bearish, and a user-defined red color is applied.
4. Display: The indicator then applies the calculated candle colors to the respective candles of each trading session on the price chart. This visual distinction helps traders quickly identify the prevailing trend during different market sessions.
To use the indicator, traders can overlay it on their price charts in TradingView. By enabling or disabling specific trading sessions, they can focus on the trends and price movements during those specific time periods.
Please note that the actual appearance of the indicator on the chart depends on the user's chosen settings for session enablement and color preferences.