Cerca negli script per "Candlestick"
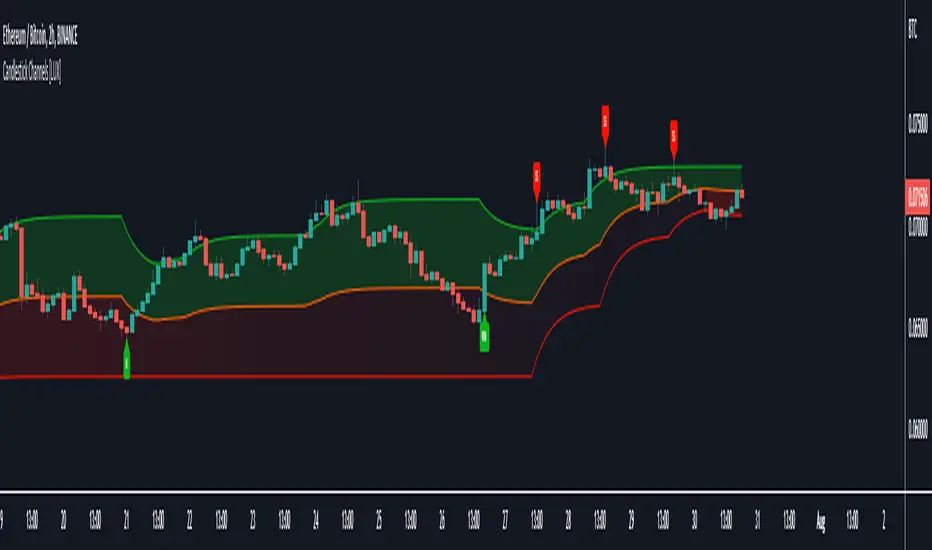
Candlestick Channels [LuxAlgo]Candlestick Channels return channels whose extremities converge towards the price when a corresponding candlestick pattern is detected. This allows for us to obtain more reactive extremities in the presence of a cluster of candlestick patterns.
The detected candlestick patterns are also highlighted with labels on your chart automatically.
Settings
Trend Length: Period of the stochastic oscillator used to determine trend sentiment; this sentiment is used to detect certain candlestick patterns.
Convergence: Convergence percentage of the channel extremities used during the occurrence of a candlestick pattern. A lower value will return extremities converging more slowly toward the price.
Smooth: Determines the degree of smoothness of the channel extremities.
Patterns
This category determines which patterns are detected by the indicator. Patterns toggled off will not be detected and won't affect the channels.
Usage
Candlesticks patterns are commonly used by traders to detect potential reversals or continuation periods in the price. It can be of interest to use them as core elements in the calculation of more classical indicators, this can allow us to filter out potential false signals returned by candlestick patterns by shifting the source of interpretation towards the channel extremities instead.
In this indicator extremities converge towards the price when a corresponding pattern is detected. As such bullish patterns will make the upper extremity converge towards the price, facilitating a cross with price. Using a lower convergence percentage will require a greater number of patterns to make the extremity converge closer towards the price.
Users can use the channel like most indicators returning extremities, with an uptrend being detected when price cross over the upper extremity and a downtrend being detected when price cross under the lower extremity.
An approach solely making use of crosses between the price and the average line can be used but the user should expect further whipsaws signals.
Users can eventually use the candlestick patterns as entries and use the extremities for confirmation. For example, users can follow a candlestick pattern return an indication in accordance with the detected trend by the channels.
This approach would lead to the following of bullish patterns when they occur in an uptrend, that is when the price is above the average line (in orange). The same logic applies to bearish patterns.
The chart above highlights the candlesticks patterns in accordance with a detected trend.
Notes
- Bullish/Bearish engulfing patterns are turned off by default due their more frequent appearance.
- Candlestick patterns relying on gaps were not included, since they would be more uncommon in cryptocurrencies, thus leading to a disparity between the indicator performance on the cryptocurrency and stock market.
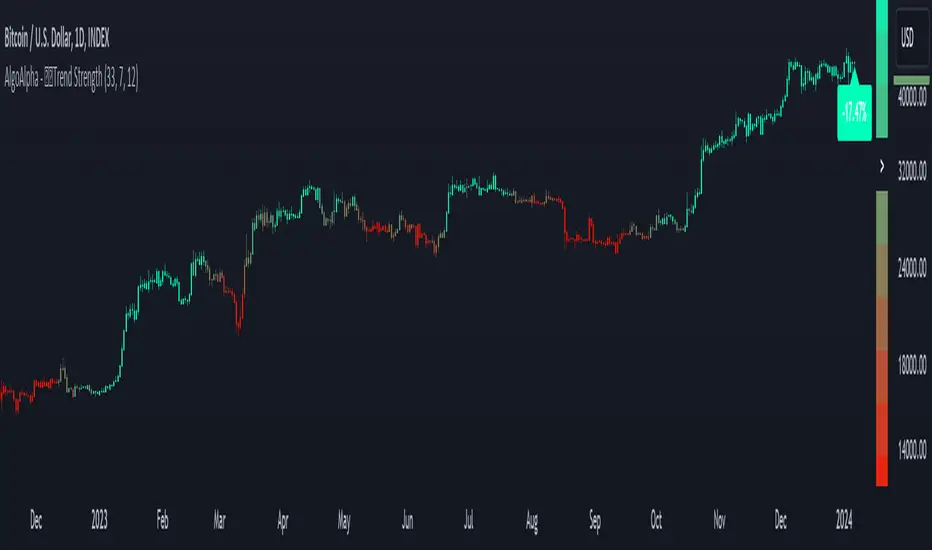
Candlestick Trend Strength [AlgoAlpha]🚀🎉 Introducing the Candlestick Trend Strength by AlgoAlpha, a dynamic TradingView indicator designed to visually communicate the strength and direction of market trends right on your charts! 🕯️💪
Key Features:
🌈 Visual gauge for trend strength, color-coded for intuitive insights.
⏳ Customizable trend detection and normalization periods to match your trading strategy.
🎨 Flexible color settings for both uptrend (green) and downtrend (red).
🔔 Real-time alerts for trend reversals, helping you stay ahead of market moves.
How to Use:
🛠 Add the Indicator: Add the indicator to favorites and customize it to suit your needs.
🔍 Analyze the Trends: Monitor the color changes in the gauge and bar color to identify strengthening or weakening trends.
🔔 Set Alerts: Configure alerts to notify you of trend changes, allowing you to react swiftly to trading opportunities without constant monitoring.
Basic Logic Explained:
The "Candlestick Trend Strength" indicator calculates the trend strength score by analyzing the ratio of the candle's wick to its body, alongside the direction of the candle (up or down). It uses a normalization period to adjust the sum of the trend score into a scale from -1 to 1, which is then plotted as a color gradient gauge from red (downtrend) to green (uptrend) on the chart. This representation helps traders quickly assess whether a trend is gaining or losing strength, and it updates in real-time with each new bar, providing a highly responsive tool for technical analysis.
Embrace the power of visual trend analysis with the "Candlestick Trend Strength" by AlgoAlpha and transform your trading experience today! 🌟📈
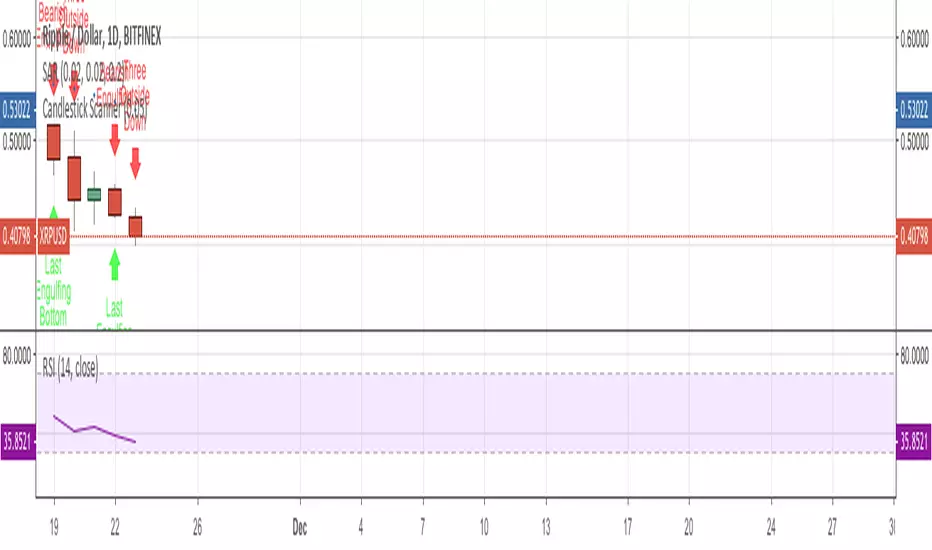
Candlestick ScannerThis is a large compilation of candlestick patterns that allows the user to detect up to 42 different bullish and bearish patterns.
This script is intended to be a Pine Editor version of the one I normally used on a different platform, so your feedback is more than welcome to help me improve it, as fine tuning is ongoing.
New patterns will be added in the next couple of days.
Happy trading!
Candlestick Bias OscillatorCandlestick Bias Oscillator (CBO)
The Candlestick Bias Oscillator (CBO) with Signal Line is a pioneering indicator developed for the TradingView platform, designed to offer traders a nuanced analysis of market sentiment through the unique lens of candlestick patterns. This indicator stands out by merging traditional concepts of price action analysis with innovative mathematical computations, providing a fresh perspective on trend detection and potential market reversals.
Originality and Utility
At the core of the CBO's originality is its method of calculating the bias of candlesticks. Unlike conventional oscillators that may rely solely on closing prices or high-low ranges, the CBO incorporates both the body and wick of candlesticks into its analysis. This dual consideration allows for a more rounded understanding of market sentiment, capturing both the directional momentum and the strength of price rejections within a single oscillator.
Mathematical Foundations
1. Body Bias: The CBO calculates the body bias by assessing the relative position of the close to the open within the day's range, scaled to a -100 to 100 range. This calculation reflects the bullish or bearish sentiment of the market, based on the day's closing momentum.
Body Bias = (Close−Open)/(High−Low) x 100
Wick Bias: Similarly, the wick bias calculation takes into account the lengths of the upper and lower wicks, indicating rejection levels beyond the body's close. The balance between these wicks is scaled similarly to the body bias, offering insight into the market's indecision or rejection of certain price levels.
Wick Bias=(Lower Wick−Upper Wick)/(Total Wick Length) × 100
3. Overall Bias and Oscillator: By averaging the body and wick biases, the CBO yields an overall bias score, which is then smoothed over a user-defined period to create the oscillator. This oscillator provides a clear visual representation of the market's underlying sentiment, smoothed to filter out the noise.
4. Signal Line: A secondary smoothing of the oscillator creates the signal line, offering a trigger for potential trading signals when the oscillator crosses this line, indicative of a change in market momentum.
How to Use the CBO:
The CBO is versatile, suitable for various trading strategies, including scalping, swing trading, and long-term trend following. Traders can use the oscillator and signal line crossovers as indications for entry or exit points. The relative position of the oscillator to the zero line further provides insight into the prevailing market bias, enabling traders to align their strategies with the broader market sentiment.
Why It Adds Value:
The CBO's innovative approach to analyzing candlestick patterns fills a gap in the existing array of TradingView indicators. By providing a detailed analysis of both candle bodies and wicks, the CBO offers a more comprehensive view of market sentiment than traditional oscillators. This can be particularly useful for traders looking to gauge the strength of price movements and potential reversal points with greater precision.
Conclusion:
The Candle Bias Oscillator with Signal Line is not just another addition to the plethora of indicators on TradingView. It represents a significant advancement in the analysis of market sentiment, combining traditional concepts with a novel mathematical approach. By offering a deeper insight into the dynamics of candlestick patterns, the CBO equips traders with a powerful tool to navigate the complexities of the market with increased confidence.
Explore the unique insights provided by the CBO and integrate it into your trading strategy for a more informed and nuanced market analysis.

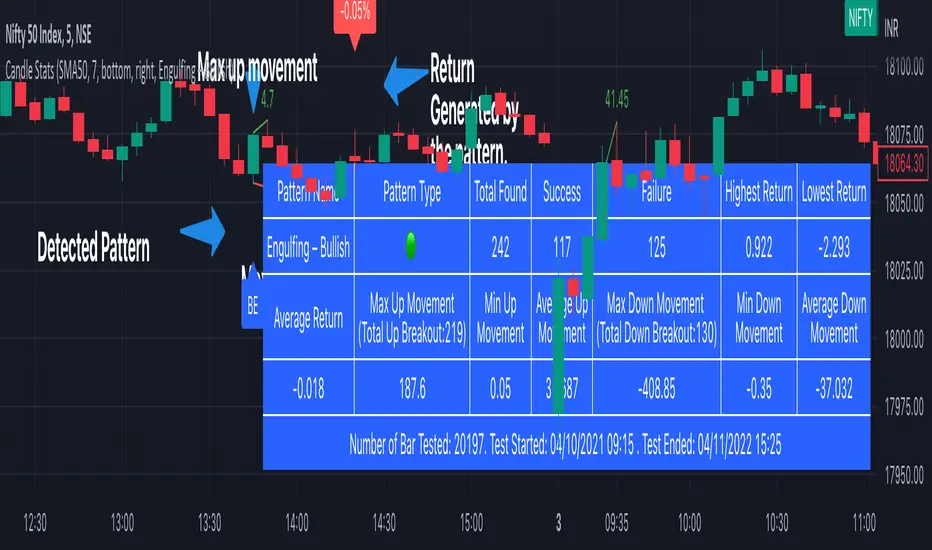
Candlestick Stats [tanayroy]The script detects candlestick patterns and stats related to the pattern. We have included 44 candle patterns to select. You can get stats for any timeframe and holding period. If a particular pattern is not available, the script will give an error.
What is available.
You can view the composite stat in the table panel.
Pattern Name: The pattern name
Pattern Type: Bullish(🟢)/ Bearish(🔴)/ Neutral(⚫)
Total Found: Number of time pattern appeared in the chart
Success: Number of time the pattern generated a positive return
Failure: Number of time the pattern generated a negative return
Highest Return: Highest return generated by the pattern (assuming trade taken at the open of the next candle and closed at the close price of the last candle of the holding period).
Lowest Return: Lowest return generated by the pattern
Average return: Average return generated by the pattern
Total Up Breakout: Number of time patterns take an up breakout(break above high).
Max Up Movement: Maximum up movement recorded by the pattern(distance between pattern high and highest high candle in given holding period).
Min up movement: Minimum up movement recorded by the pattern.
Average Up Movement: Average up movement recorded
Total Down Breakout: Number of time patterns take a down breakout(break below low).
Max Down Movement: Maximum down movement recorded by the pattern.
Min Down Movement: Minimum down movement recorded by the pattern.
Average Down Movement: Average down movement recorded
You can find the number of bars tested, start date and end date in the panel.
You can visually inspect the candle pattern performance in the chart.
Available options:
Detect Trend: You can detect trends based on SMA 50, SMA 50/200 or No detection.
Stat bars: Holding period after detecting the pattern.
Panel position: Position the stat table as per your choice.
Select pattern: Select available predefined pattern.
Label color: choose color according to your choice.
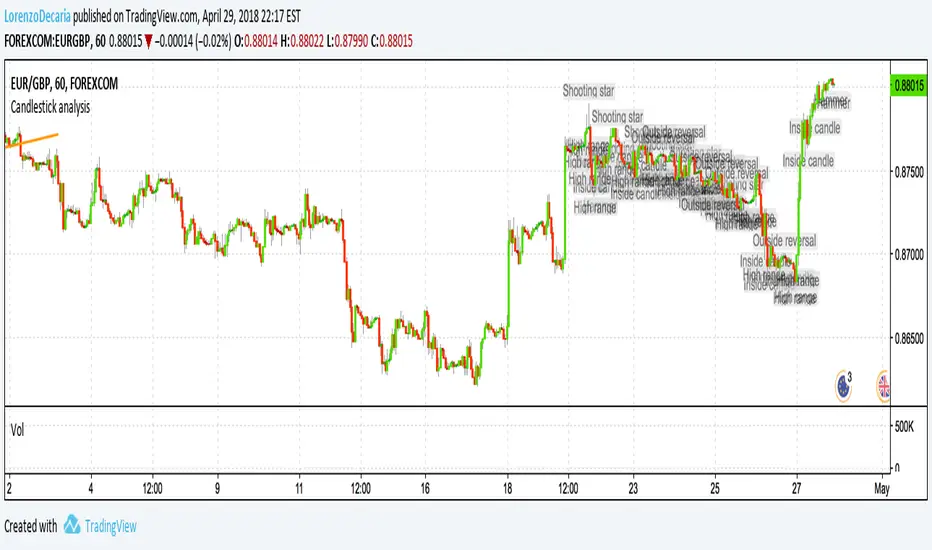
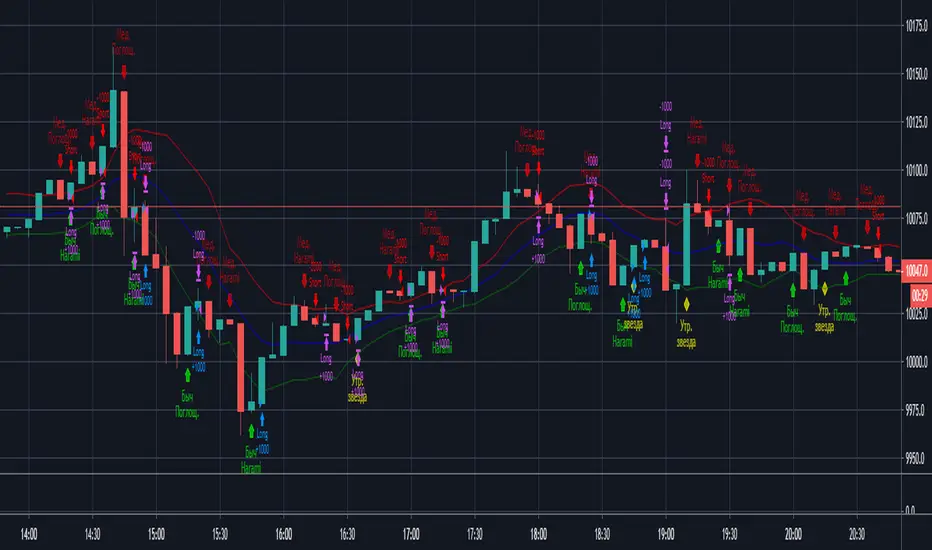
Candlesticks Patterns [TradingFinder] Pin Bar Hammer Shooting🔵 Introduction
Truly, the title "TradingView" doesn't do justice to this excellent website, and that's why I've written about its crucial aspect. In this indicator, the identification of all candlesticks known as "Pin bars" is explored.
These candlesticks include the following:
- Hammer : A Pin bar formed at the end of a bearish trend, with its body being either bearish or bullish.
- Shooting Star : Formed at the end of a bullish trend, with its body being either bearish or bullish.
- Hanging Man : Formed during an upward trend, characterized by a candle with a lower shadow.
- Inverted Hammer : Formed during a downward trend, characterized by a candle with an upper shadow.
🟣 Important : For ease of use, we refer to these four candlestick patterns as Pin Bars and categorize them into the main friends "Bullish" and "Bearish."
🟣 Important : In all sources, Hanging Man and Inverted Hammer are referred to as "Reversal candles." However, in reality, whenever they appear after breaking a significant area (Break Out), we expect these candles to signal a continuation of the trend and confirmation in the direction of the trend.
🟣 Important : One of the best signs of market manipulation and entry by market giants is the "Ice Berg." So, it provides one of the best trading opportunities.
🔵 Reason for Creation
Many traders, especially volume traders, use Pin bars as confirmation and enter the market after their occurrence. In this indicator, all four patterns are identified and displayed in a colored candle format, using "triangle" and "circle."
When they are evident on the chart, directly or by drawing a horizontal line, they give us good alerts for reversal or continuation areas.
🔵 Information Table
1. Red circle: Pin bars formed in a downtrend.
2. Blue circle: Bullish Pin bars formed in an uptrend.
3. Black triangle: Bearish Pin bar candle in an uptrend.
4. Blue triangle: Bullish Pin bar candle in a downtrend.
🔵 Settings
Trend Detection Period: A special feature that considers smaller or larger fluctuations. If individual price waves need to be considered, use lower numbers; if the overall trend direction is desired, use larger numbers (e.g., 5-7 or higher). This precisely sets the Zigzag or Pivot format, not displayed but considered in the indicator calculation.
Trend Effect : By changing the Trend Effect status to "Off," all Pin bars, whether bullish or bearish, are displayed regardless of the current market trend. If the status remains "On," only Pin bars in the direction of the main market trend are shown.
🟣 Important : Black triangles "Number 3" and blue triangles "Number 4" displayed in the information table section, as explained in the "Information Table" section.
Show Bullish Pin Bar : When set to "Yes," displays bullish Pin bars; when set to "No," does not display them.
Show Bearish Pin Bar : When set to "Yes," allows the display of bearish Pin bars; when set to "No," does not display them.
Bullish Pin Bar Setting : Using the "Ratio Lower Shadow to Body" and "Ratio Lower Shadow to Higher Shadow" settings, you can customize your bullish Pin bar candles. Larger numbers impose stricter conditions for identifying bullish Pin bars.
Bearish Pin Bar Setting : Using the "Ratio Higher Shadow to Body" and "Ratio Higher Shadow to Lower Shadow" settings, you can customize your bearish Pin bar candles. Larger numbers impose stricter conditions for identifying bearish Pin bars.
Show Info Table : Allows the display or non-display of the information table (located at the bottom of the page and on the right side).
🔵 How to Use
At the end of a downtrend, look for "Hammer" candles, easily identified one by one.
To identify the "Shooting Star" candle pattern at the end of an uptrend; expect a price reversal in the downtrend.
For trades in the downward direction, wait for the formation of an "Inverted Hammer" Pin bar.
And finally, in an uptrend, where a "Hanging Man" candle can form.
🔵 Features
For better visualization, triangles and circles are used above the candles, but they can be easily removed. All Pin bars are displayed in color with the following meanings:
- Black-bodied candle: Inverted Hammer
- Turquoise blue candle: Hammer
- Pink candle: Hanging Man
- Red candle: Shooting Star
🟣 Important : The capability to detect the powerful two-candle pattern "Tweezer Top" at the end of an uptrend emerges by forming two "Shooting Star" candles side by side.
Similarly, the two-candle pattern "Tweezer Bottom" is created at the end of a downtrend with the formation of two "Hammer" candles side by side. To identify the "Tweezer" pattern, make sure the settings in the "Trend Effect" section are set to "Off."
🟣 Auxiliary Indicators
During the start of trading sessions such as Asia, London, and New York, where the highest liquidity exists, alongside this indicator, you can use the Trading Sessions indicator.
Sessions
The combination of Order Blocks "-OB" and "+OB" with candles is one of the best trading methods. The indicator that identifies order blocks, along with this indicator, can yield remarkable results in the success of Pin bar candles.
Order Blocks Finder
The trading toolset "TFlab" presents this indicator. To benefit from all indicators, we invite you to visit our page " TFlab Scripts ".

Candlestick Pattern Criteria and Analysis Indicator█ OVERVIEW
Define, then locate the presence of a candle that fits a specific criteria. Run a basic calculation on what happens after such a candle occurs.
Here, I’m not giving you an edge, but I’m giving you a clear way to find one.
IMPORTANT NOTE: PLEASE READ:
THE INDICATOR WILL ALWAYS INITIALLY LOAD WITH A RUNTIME ERROR. WHEN INITIALLY LOADED THERE NO CRITERIA SELECTED.
If you do not select a criteria or run a search for a criteria that doesn’t exist, you will get a runtime error. If you want to force the chart to load anyway, enable the debug panel at the bottom of the settings menu.
Who this is for:
- People who want to engage in TradingView for tedious and challenging data analysis related to candlestick measurement and occurrence rate and signal bar relationships with subsequent bars. People who don’t know but want to figure out what a strong bullish bar or a strong bearish bar is.
Who this is not for:
- People who want to be told by an indicator what is good or bad or buy or sell. Also, not for people that don’t have any clear idea on what they think is a strong bullish bar or a strong bearish bar and aren’t willing to put in the work.
Recommendation: Use on the candle resolution that accurately reflects your typical holding period. If you typically hold a trade for 3 weeks, use 3W candles. If you hold a trade for 3 minutes, use 3m candles.
Tldr; Read the tool tips and everything above this line. Let me know any issues that arise or questions you have.
█ CONCEPTS
Many trading styles indicate that a certain candle construct implies a bearish or bullish future for price. That said, it is also common to add to that idea that the context matters. Of course, this is how you end up with all manner of candlestick patterns accounting for thousands of pages of literature. No matter the context though, we can distill a discretionary trader's decision to take a trade based on one very basic premise: “A trader decides to take a trade on the basis of the rightmost candle's construction and what he/she believes that candle construct implies about the future price.” This indicator vets that trader’s theory in the most basic way possible. It finds the instances of any candle construction and takes a look at what happens on the next bar. This current bar is our “Signal Bar.”
█ GUIDE
I said that we vet the theory in the most basic way possible. But, in truth, this indicator is very complex as a result of there being thousands of ways to define a ‘strong’ candle. And you get to define things on a very granular level with this indicator.
Features:
1. Candle Highlighting
When the user’s criteria is met, the candle is highlighted on the chart.
The following candle is highlighted based on whether it breaks out, breaks down, or is an inside bar.
2. User-Defined Criteria
Criteria that you define include:
Candle Type: Bull bars, Bear bars, or both
Candle Attributes
Average Size based on Standard Deviation or Average of all potential bars in price history
Search within a specific price range
Search within a specific time range
Clarify time range using defined sessions and with or without weekends
3. Strike Lines on Candle
Often you want to know how price reacts when it gets back to a certain candle. Also it might be true that candle types cluster in a price region. This can be identified visually by adding lines that extend right on candles that fit the criteria.
4. User-Defined Context
Labeled “Alternative Criteria,” this facet of the script allows the user to take the context provided from another indicator and import it into the indicator to use as a overriding criteria. To account for the fact that the external indicator must be imported as a float value, true (criteria of external indicator is met) must be imported as 1 and false (criteria of external indicator is not met) as 0. Basically a binary Boolean. This can be used to create context, such as in the case of a traditional fractal, or can be used to pair with other signals.
If you know how to code in Pinescript, you can save a copy and simply add your own code to the section indicated in the code and set your bull and bear variables accordingly and the code should compile just fine with no further editing needed.
Included with the script to maximize out-of-the-box functionality, there is preloaded as alternative criteria a code snippet. The criteria is met on the bull side when the current candle close breaks out above the prior candle high. The bear criteria is met when the close breaks below the prior candle. When Alternate Criteria is run by itself, this is the only criteria set and bars are highlighted when it is true. You can qualify these candles by adding additional attributes that you think would fit well.
Using Alternative Criteria, you are essentially setting a filter for the rest of the criteria.
5. Extensive Read Out in the Data Window (right side bar pop out window).
As you can see in the thumbnail, there is pasted a copy of the Data Window Dialogue. I am doubtful I can get the thumbnail to load up perfectly aligned. Its hard to get all these data points in here. It may be better suited for a table at this point. Let me know what you think.
The primary, but not exclusive, purpose of what is in the Data Window is to talk about how often your criteria happens and what happens on the next bar. There are a lot of pieces to this.
Red = Values pertaining to the size of the current bar only
Blue = Values pertaining or related to the total number of signals
Green = Values pertaining to the signal bars themselves, including their measurements
Purple = Values pertaining to bullish bars that happen after the signal bar
Fuchsia = Values pertaining to bearish bars that happen after the signal bar
Lime = Last four rows which are your percentage occurrence vs total signals percentages
The best way I can explain how to understand parts you don’t understand otherwise in the data window is search the title of the row in the code using ‘ctrl+f’ and look at it and see if it makes more sense.
█ [b}Available Candle Attributes
Candle attributes can be used in any combination. They include:
[*}Bodies
[*}High/Low Range
[*}Upper Wick
[*}Lower Wick
[*}Average Size
[*}Alternative Criteria
Criteria will evaluate each attribute independently. If none is set for a particular attribute it is bypassed.
Criteria Quantity can be in Ticks, Points, or Percentage. For percentage keep in mind if using anything involving the candle range will not work well with percentage.
Criteria Operators are “Greater Than,” “Less Than,” and “Threshold.” Threshold means within a range of two numbers.
█ Problems with this methodology and opportunities for future development:
#1 This kind of work is hard.
If you know what you’re doing you might be able to find success changing out the inputs for loops and logging results in arrays or matrices, but to manually go through and test various criteria is a lot of work. However, it is rewarding. At the time of publication in early Oct 2022, you will quickly find that you get MUCH more follow through on bear bars than bull bars. That should be obvious because we’re in the middle of a bear market, but you can still work with the parameters and contextual inputs to determine what maximizes your probability. I’ve found configurations that yield 70% probability across the full series of bars. That’s an edge. That means that 70% of the time, when this criteria is met, the next bar puts you in profit.
#2 The script is VERY heavy.
Takes an eternity to load. But, give it a break, it’s doing a heck of a lot! There is 10 unique arrays in here and a loop that is a bit heavy but gives us the debug window.
#3 If you don’t have a clear idea its hard to know where to start.
There are a lot of levers to pull on in this script. Knowing which ones are useful and meaningful is very challenging. Combine that with long load times… its not great.
#4 Your brain is the only thing that can optimize your results because the criteria come from your mind.
Machine learning would be much more useful here, but for now, you are the machine. Learn.
#5 You can’t save your settings.
So, when you find a good combo, you’ll have to write it down elsewhere for future reference. It would be nice if we could save templates on custom indicators like we can on some of the built in drawing tools, but I’ve had no success in that. So, I recommend screenshotting your settings and saving them in Notion.so or some other solid record keeping database. Then you can go back and retrieve those settings.
#6 no way to export these results into conditions that can be copy/pasted into another script.
Copy/Paste of labels or tables would be the best feature ever at this point. Because you could take the criteria and put it in a label, copy it and drop it into another strategy script or something. But… men can dream.
█ Opportunities to PineCoders Learn:
1. In this script I’m importing libraries, showing some of my libraries functionality. Hopefully that gives you some ideas on how to use them too.
The price displacement library (which I love!)
Creative and conventional ways of using debug()
how to display arrays and matrices on charts
I didn’t call in the library that holds the backtesting function. But, also demonstrating, you can always pull the library up and just copy/paste the function out of there and into your script. That’s fine to do a lot of the time.
2. I am using REALLY complicated logic in this script (at least for me). I included extensive descriptions of this ? : logic in the text of the script. I also did my best to bracket () my logic groups to demonstrate how they fit together, both for you and my future self.
3. The breakout, built-in, “alternative criteria” is actually a small bit of genius built in there if you want to take the time to understand that block of code and think about some of the larger implications of the method deployed.
As always, a big thank you to TradingView and the Pinescript community, the Pinescript pros who have mentored me, and all of you who I am privileged to help in their Pinescripting journey.
"Those who stay will become champions" - Bo Schembechler

Candlestick Pattern Strategy with Smart Stop-Loss Management🔹 Strategy Overview
This strategy combines candlestick patterns with trend filtering and EMA channel confirmation to identify high-probability trading opportunities. It features a smart stop-loss management system that moves to breakeven once the trade reaches a predefined profit threshold.
📊 Key Features
✅ Multiple Candlestick Patterns – Detects classic reversal patterns like:
Hammer & Hanging Man
Bullish & Bearish Engulfing
Piercing Line & Dark Cloud Cover
Morning & Evening Star
Doji Star (Neutral Signal)
✅ Trend & EMA Channel Filters
Trend EMA (100-period) – Ensures trades align with the broader trend.
EMA Channel (50-period ± % range) – Filters trades within a defined volatility range.
✅ Flexible Trade Management
Fixed Target Points – Take profit at a predefined distance.
Trailing Stop to Cost – Moves stop-loss to breakeven after reaching a specified profit threshold.
✅ Customizable Trade Direction
Long Only / Short Only / Both – Adapt to bullish, bearish, or neutral markets.
✅ Time-Based Execution
Intraday Mode – Trades only within specified session hours.
Positional Mode – Holds trades beyond the session.
⚙️ Input Parameters
Trend Filter – Enable/disable trend alignment with EMA.
EMA Channel Filter – Adjust channel width for volatility control.
Candlestick Patterns – Toggle individual patterns on/off.
Target Points & Trail Trigger – Customize profit-taking and SL management.
Trade Type – Switch between intraday and positional trading.
📈 Entry Conditions
Long Entry:
Bullish candlestick pattern (Hammer, Bullish Engulfing, Piercing Line, Morning Star).
Price above Trend EMA (if enabled).
RSI < 30 (oversold confirmation).
Within EMA Channel (if enabled).
Short Entry:
Bearish candlestick pattern (Hanging Man, Bearish Engulfing, Dark Cloud Cover, Evening Star).
Price below Trend EMA (if enabled).
RSI > 70 (overbought confirmation).
Within EMA Channel (if enabled).
📉 Exit Conditions
Take Profit (TP): Fixed target based on points.
Stop-Loss (SL): Moves to breakeven after hitting the trail trigger.
📊 Visual Indicators
Trend EMA (Orange Line) – Main trend direction.
EMA Channel (Blue Lines) – Volatility range.
Buy/Sell Labels – Entry signals below/above bars.
Doji Star (Gray Cross) – Neutral signal.
🎯 Best Suited For
Swing Traders (Positional Mode)
Intraday Traders (Scalping with tight stops)
Price Action Enthusiasts (Candlestick-based entries)
🔗 Try it out and customize it to fit your trading style! 🚀

Candlestick Pattern Indicator – Doji, Harami, More [algo_aakash]This Candlestick Pattern Indicator is designed to help traders identify key price action patterns like Bullish Engulfing, Bearish Engulfing, Doji, Hammer, Morning Star, Evening Star, and many more directly on your TradingView chart. With customizable options to display both bullish and bearish patterns , this indicator provides real-time visual markers and labels, helping you make informed trading decisions.
Key features of the indicator include:
Detects popular candlestick patterns such as Bullish Engulfing, Bearish Engulfing, Hammer, Morning Star, Tweezer Tops, and more.
Customizable settings for displaying pattern shapes, labels, and opacity, tailored to your trading preferences.
Option to plot signals only after a candle closes, ensuring accuracy.
Alerts for immediate notification of detected patterns.
Visual markers on the chart, including arrows and labels, for quick recognition of potential trade setups.
This indicator is ideal for traders who rely on candlestick patterns for technical analysis and want an automated tool to highlight these setups for easier decision-making.
Whether you're a beginner or an experienced trader, this tool will help you spot important patterns in real-time without cluttering your chart.

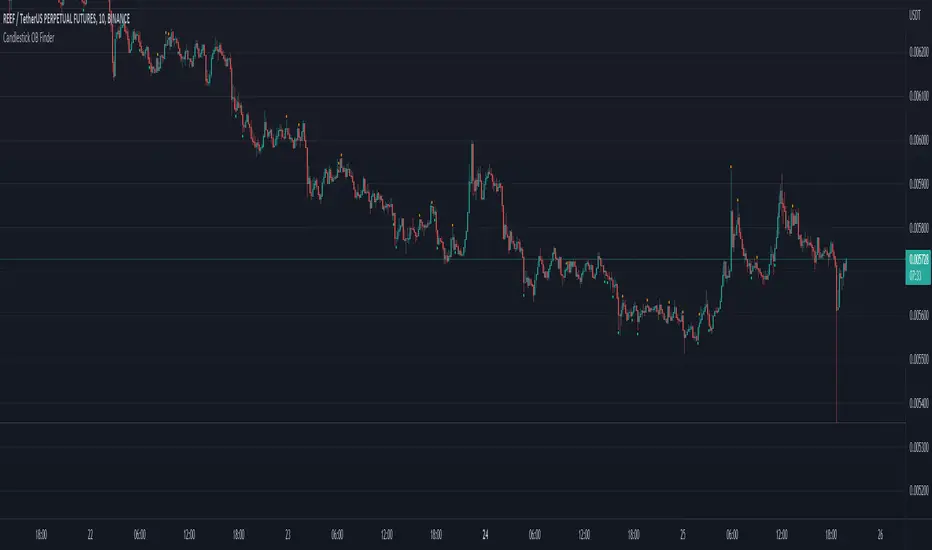
Candlestick OB FinderIntroduction
Hello, this here is a non-repainting candlestick indicator which is able to detect OB looking candlestick formations.
Usage
It can be used to confirm entries, but be aware that it produces a lot of false signals.
Somehow the swings tend to reverse at these points.
I recommend the 10–15 minutes timeframe.
I hope you enjoy this small indicator. :)
Candlestick PatternsThis versatile candlestick patterns indicator combines traditional pattern recognition with trend detection and advanced alerting capabilities. It identifies key candlestick formations while validating them against market context through trend analysis.
### Features
🎯 Pattern Detection:
• Morning Star & Evening Star
• Hammer & Inverted Hammer
• Hanging Man
• Shooting Star
• Inside Bar
📈 Smart Trend Detection:
• Multiple methods available:
- EMA (14, 28)
- SMA (50, 200)
- ZigZag
- Combined methods
- No trend detection option
🎨 Visual Signals:
• Clear up/down arrows
• Pattern labels with tooltips
• Optional ZigZag visualization
• Color-coded inside bars
⚡ Advanced Alerts:
• JSON-formatted alerts with complete market data:
- OHLCV data
- Pattern information
- Market context
- Time and symbol details
• Standard TradingView alerts
• Custom alert messages
• Token-based authentication
### Settings
▶️ ZigZag Parameters:
• Depth: Controls sensitivity
• Deviation: Fine-tunes pattern detection
• Backstep: Adjusts repainting behavior
• Visual customization options
▶️ Pattern Detection:
• Morning/Evening Star thresholds
• Hammer pattern sensitivity
• Inside bar visualization
▶️ Trend Detection:
• Multiple methods to choose from
• Combinable indicators for better accuracy
▶️ Alert Configuration:
• Customizable JSON template
• Token authentication
• Complete market data output
### How to Use
1. Add indicator to your chart
2. Choose preferred trend detection method
3. Adjust pattern parameters if needed
4. Set up alerts with your JSON template
5. Monitor for validated patterns
### Trading Tips
• Wait for pattern confirmation with trend alignment
• Use support/resistance validation
• Combine with other technical indicators
• Consider volume analysis
• Use alerts for automated trading systems
### Disclaimer
This indicator is for educational and informational purposes only. Always perform your own analysis and validation before trading.
Good luck trading! 📈
#patterns #candlesticks #technical #alerts #trading #strategy

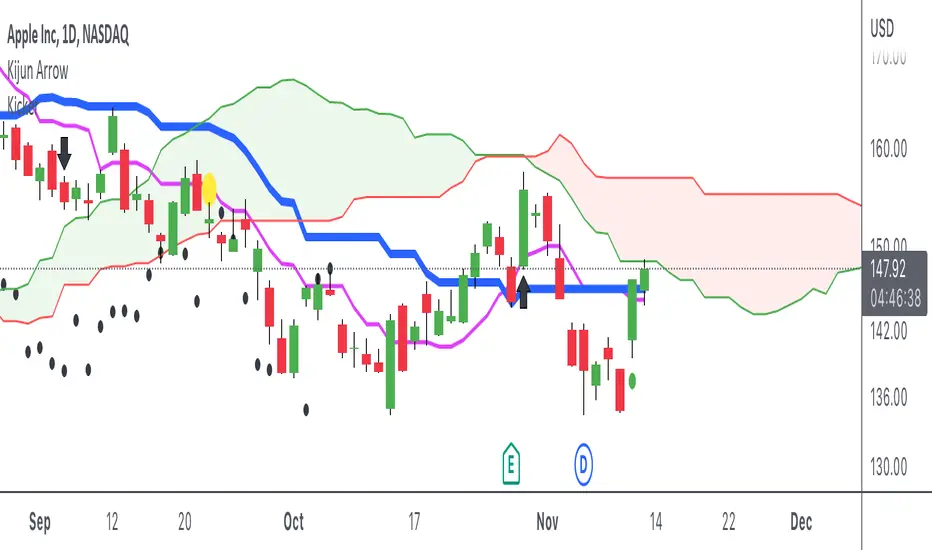
Candlestick - Kicker PatternNot many candlestick patterns hurt traders on the other side of the trade more than this signal, when it happens, think of it as kicking in the teeth, the pain is real.
An upwards signal is painted when you have a two-bar formation, the one on the left is a bearish one whereas the successive one is bullish, when you have fat bodies in both candles, meaning the open is close to the high and the close is close to the low for the first candle, while the open is close to the low and the close is close to the high for the adjacent candle, the pain is ever more excruciating, the other important condition is the open of the first candle must be lower than the open of the latter one.
The downwards signal is vice versa of the upwards signal.
Candlesticks ANN for Stock Markets TF : 1WHello, this script consists of training candlesticks with Artificial Neural Networks (ANN).
In addition to the first series, candlesticks' bodies and wicks were also introduced as training inputs.
The inputs are individually trained to find the relationship between the subsequent historical value of all candlestick values 1.(High,Low,Close,Open)
The outputs are adapted to the current values with a simple forecast code.
Once the OHLC value is found, the exponential moving averages of 5 and 20 periods are used.
Reminder : OHLC = (Open + High + Close + Low ) / 4
First version :
Script is designed for S&P 500 Indices,Funds,ETFs, especially S&P 500 Stocks,and for all liquid Stocks all around the World.
NOTE: This script is only suitable for 1W time-frame for Stocks.
The average training error rates are less than 5 per thousand for each candlestick variable. (Average Error < 0.005 )
I've just finished it and haven't tested it in detail.
So let's use it carefully as a supporter.
Best regards !

Candlestick Patterns v1.0🔍 Overview
Candlestick Patterns v1.0 automatically identifies popular bullish and bearish candlestick formations directly on your chart.
It highlights potential reversal and continuation signals using color-coded visual markers — so traders can quickly spot opportunities without manually scanning candles.
This tool is designed for traders who rely on price action, pattern confirmation, or trend reversal analysis.
⚙️ Features
Detects major patterns:
Doji, Dragonfly Doji, Gravestone Doji
Morning Star and Evening Star
Hammer and Inverted Hammer
Bullish & Bearish Engulfing
Shooting Star and Hanging Man
Customizable bullish/bearish colors
Toggle each pattern on or off
Lightweight and compatible with all timeframes and instruments
🧠 How to Use
1. Add to chart — open the indicator and click Add to chart.
2. Choose patterns — open Settings → Inputs and select which patterns to display.
3. Interpret signals:
🟢 Bullish patterns appear below candles (possible buy/reversal areas).
🔴 Bearish patterns appear above candles (possible sell/reversal areas).
4.Use alongside other tools like RSI, Moving Averages, or Volume for confirmation.
💡 Tips
Look for Hammers or Bullish Engulfing at support in a downtrend → strong buy signals.
Look for Shooting Stars or Bearish Engulfing at resistance in an uptrend → potential short setups.
Avoid using on extremely low timeframes unless combined with filters (trend/RSI/volume).
👨💻 Author
Created by @hjvasoya
© 2025 — Published under the Mozilla Public License 2.0

Candlestick Suite–(Phoenix) it colors the major Reversal candlesticks
BullEngulf or BearEngulf or Engulfing() -> DARK_ORANGE
PiercingLine or DarkCloudCover -> CYAN
BullishHarami or BearishHarami -> YELLOW
BullishInsideBar or BearishInsideBar -> WHITE

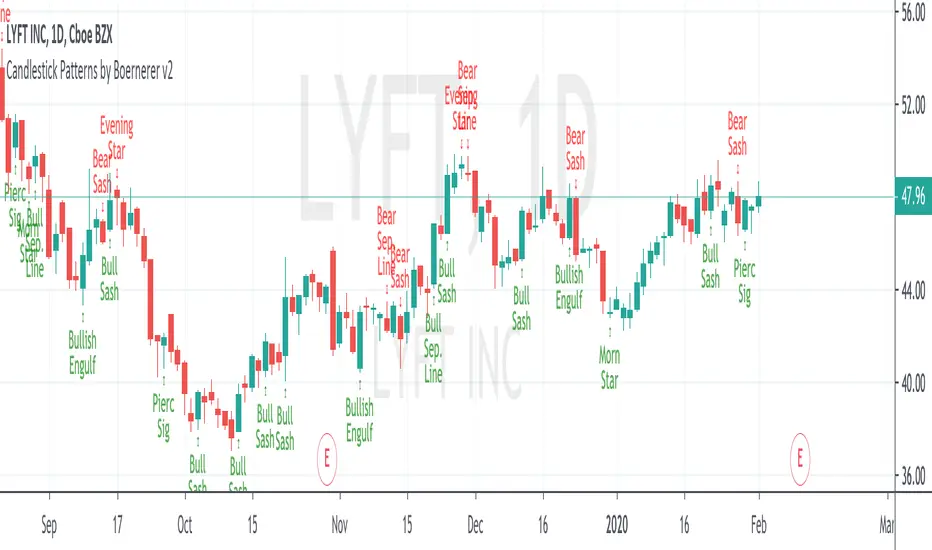
Candlestick Patterns by Boernerer v2New version 2 of my modifications of the original candlestick pattern script by Robert Waddell.
- Added window (= gaps) detection
- Added Bear/Bull Sash
- Added Bear/Bull Counter Attack
- Added Bear/Bull Seperating Line
- Modified candlestick ID code
- Added Lookback period instead of SMA (TLine) for trend detection
Candlestick Pattern Detector - Vijay PrasadOverview:
This Pine Script v6 indicator is designed to detect and label key candlestick patterns on TradingView charts. It provides real-time visual markers for major bullish and bearish reversal signals, aiding traders in decision-making.
Usefulness:
✅ Saves time by automating candlestick pattern detection.
✅ Reduces manual chart analysis errors.
✅ Works across all markets & timeframes.
✅ Enhances trading strategies with accurate signals.
Candlestick Patterns Recognises:
Bullish Engulfing – A strong bullish reversal pattern.
Bearish Engulfing – Indicates a potential downtrend.
Hammer – Suggests a market bottom or reversal.
Shooting Star – A bearish reversal signal at the top of an uptrend.
Doji – Signals market indecision and possible trend change.
Key Functions:
Automated Pattern Visible
Identifies candlestick patterns dynamically and plots them on the chart.
Visual Labels for Patterns
Labels to indicate specific candlestick formations.
Labels appear only when a valid pattern is detected, avoiding unnecessary clutter.
Buy/Sell Signal
Plots buy signals at bullish patterns and sell signals at bearish patterns.
Helps traders recognize trend reversals and entry/exit points.
Bullish Engulfing Pattern (Green Label)
What it means: A bullish engulfing pattern typically signals a potential reversal from a downtrend to an uptrend. The current candle fully engulfs the previous candle, signaling strong buying interest.
Identifying Candlestick Patterns on the Chart
How to use it:
Entry: Look for a green label (bullish engulfing) at the bottom of the chart. When it appears, consider entering a long position (buy).
Confirmation: To increase reliability, wait for confirmation by observing if price moves above the high of the bullish engulfing candle.
Exit: Exit when the trend shows signs of reversing or take profit at predefined levels (e.g., resistance or a risk-to-reward ratio).
Bearish Engulfing Pattern (Red Label)
What it means: A bearish engulfing pattern is a signal of a potential reversal from an uptrend to a downtrend. The current candle fully engulfs the previous candle, signaling strong selling pressure.
How to use it:
Entry: Look for a red label (bearish engulfing) at the top of the chart. When it appears, consider entering a short position (sell).
Confirmation: Wait for the price to move below the low of the bearish engulfing candle to confirm the bearish trend.
Exit: Close the trade when the price reaches support levels or the trend shows signs of reversing.
Doji Pattern (Blue Circle)
What it means: A Doji candle signals market indecision. It represents a balance between buyers and sellers, often marking a potential reversal or consolidation point.
How to use it:
Entry: If the Doji appears after a strong trend (bullish or bearish), wait for the next candle to break above or below the Doji's high or low. This can signal a continuation or reversal.
Confirmation: You can look for additional indicators like moving averages, RSI, or MACD for confirmation before taking any action.
Exit: Exit when the price shows clear momentum in your entry direction.
Hammer Pattern (Orange Triangle)
What it means: The hammer pattern is a bullish reversal pattern that appears after a downtrend. It suggests that sellers pushed the price down during the session, but buyers managed to push the price back up.
How to use it:
Entry: When a hammer appears, consider entering a long position (buy). The price should move above the hammer's high for confirmation.
Confirmation: Look for strong volume and a follow-up bullish candle to confirm the reversal.
Exit: Set a target based on the next resistance level, or use a trailing stop to lock in profits.
Using Candlestick Patterns with Other Indicators
To increase your chances of success, combine candlestick patterns with other technical indicators.
Here are some ideas:
RSI (Relative Strength Index): Use RSI to check whether the market is overbought or oversold. A bullish engulfing in an oversold market could indicate a stronger buy signal, and a bearish engulfing in an overbought market could indicate a stronger sell signal.
Moving Averages (e.g., 50 EMA, 200 EMA): Confirm trend direction. If the candlestick pattern aligns with the direction of the moving averages, it can give a stronger signal.
MACD (Moving Average Convergence Divergence): Use MACD to confirm momentum and potential trend changes. If a candlestick pattern aligns with a MACD crossover, it strengthens the signal.
Volume: Look for higher-than-average volume when a pattern appears. This can give you additional confirmation that the market is reacting strongly.
Practice and Refine
It's important to practice using the candlestick patterns in a demo account or backtest them to see how they perform under different market conditions. Over time, you can adjust the settings and patterns to fit your trading style and preferences.

Candlestick Patterns detection and backtester [TrendX_]INTRODUCTION:
The Candlestick Patterns detection and backtester is designed to empower traders by identifying and analyzing candlestick patterns. Leveraging the robust Pine Script's add-in “All Candlestick Patterns”, this indicator meticulously scans the market for candlestick formations, offering insights into potential market movements. With its backtesting capabilities, we evaluate historical data to present traders with performance metrics such as win rates, net profit, and profit factors for each pattern. This allows traders to make informed decisions based on empirical evidence. The customizable settings, including trend filters and exit conditions, provide a tailored experience, adapting to various trading styles and strategies.
CREDIT:
This indicator is powered by the Pinescript add-in, *All Candlestick Patterns*, which provides a comprehensive library of candlestick formations.
TABLE USAGE:
The indicator features a detailed usage table that presents backtested results of all candlestick patterns. This includes:
Win Rates: The percentage of trades that resulted in a profit.
Net Profit: The total profit after subtracting losses from gains.
Profit Factor: A measure of the indicator’s profitability (gross profit / gross loss).
Total Trades: The total number of trades taken for every candlestick pattern's appearance.
CHART CANDLESTICK USAGE:
The indicator integrates candlestick pattern detections directly into the chart, displaying:
Pattern Detections: Each detected pattern is marked on the chart.
Win Rates: The win rate of each pattern is shown in brackets next to the detection.
CHART SETTINGS:
Users can customize the indicator with a variety of trend filters and settings:
Trend Filters: Apply filters based on SMA50, SMA200, Supertrend, and RSI threshold to refine pattern detections.
Exit Condition: Set an exit condition based on the crossing of a simple moving average of customizable length.
Visibility: Choose to show or hide the candlestick patterns’ detections on the chart.

Candlestick Patterns + windows Mod by BoernererMy modifications for the candlestick pattern script by Robert Waddell.
Changelog
- Added window (= gaps) detection
- Added Bear/Bull Sash
- Modified candlestick ID code
- Candlesticks will only be displayed if above or below TLine
Originally created by Robert Waddell with special thanks to repo32 for his candlestick ID code, DavidR for EMA code and Chris Moody for barcolor code.
Enjoy and would love if you improve it further!

Candlestick Patterns DemoMy first Pine Script attempt to identify and display candlestick patterns on the chart. In this demo version the script identifies Doji, Bullish Engulfing and Bearish Engulfing patterns.

Candlestick Patterns [DW]This is a simple study designed to track multiple candlestick patterns. Custom alerts included.
