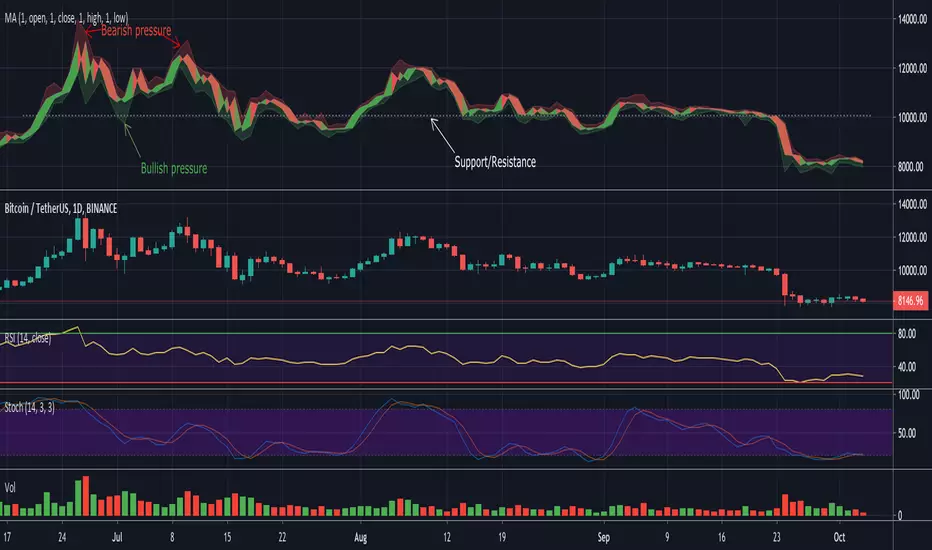
Modiied Elder Ray Index(Bull or Bear)Here's a modified version of the Elder Ray Index created by the famed Dr.Alexander Elder. This indicator has proven to be especially helpful lately given the crazy state of crypto.
Slow Moving Average :
The top chart shows the moving average used to filter trends. I recommend using a higher window length(can be adjusted with the 'lenSlowMA' input option). I wanted this to be a very smooth moving average, so I used the following formula:
slow MA = ema(vwma(close, 64), 64)
This resulted in a pretty smooth line that still detects major price movements very well.
-The background and bar colors both change in response to the Slow MA's value. The background and bars change to green when a bullish trend is detected and red when bearish.
Bear and Bull Power :
To balance things out a little, I included two histogram's based on Elder's Ray. Here, a more responsive EMA with a shorter window length is used to calculate the bull and bear power values and track short-term price fluctuations.
NOTE: The length of the EMA used here can be adjusted in the input menu.
Bull Power = current high - EMA(close, 13)
Bear Power = current low - EMA(close, 13)
Cerca negli script per "bear"
#115 OBZ Bull/Bear PowerOBZ represents an attempt to measure the power coming from bulls and bears. When the signal breaks the set threshold, the dominance is likely to be reversed and a corresponding long/short signal is fired.
With up to three layers of analysis, OBZ is one of the most complete indicators in the market. Not only it's great to establish the current dominance, it is also a valuable tool to spot divergences and anticipate the end of the trend.
Access is granted to CryptoSociety Team and members of their community.
Stoch-RSI Divergence PointerThis script points regular and optionally hidden types of bullish and bearish Stoch-RSI divergences on the chart by drawing the divergence lines and optionally labels.
Hidden divergence is disabled by default, it can be enabled over settings window.
Regular divergence is enabled by default, it can be disabled over settings window.
There is an option to display the price channel additionally.
Bull/Bear CandleThis script will display a small triangle under the latest two candles to indicate whether that candle is bullish or bearish based on the following definition.
A bullish candle closes in the top portion of the trading range of the candle while a bearish candle closes in the bottom portion of the trading range of the candle.
The cutoff is currently set at 65% (you can adjust it) so the close must be outside or equal to 65% of the trading range to be considered bullish or bearish. If less than 65% the triangle will indicate a neutral candle.
Colours are;
green triangle = bullish candle
red triangle = bearish candle
yellow triangle = neutral candle
I hope this helps those using TraderCobb's cradle strategy.
CryptoJoncis Bear/Bull levelsSimple as this, while price is in the yellow field, it is in indecision, if it's in the red fields, the trend is bearish. If the price reaches bear level 4, there is a high possibility that it will jump to the Bull level 4.
If the price is in the green field, it gives you an indication that it's bull trend. If price reaches bull level 4, there is high possibility that it will retrace.
If this is helpful for you, consider a tip
BTC: 3FiBnveHo3YW6DSiPEmoCFCyCnsrWS3JBR
ETH: 0xac290B4A721f5ef75b0971F1102e01E1942A4578
Day Trade Pattern DetectorThis script will draw on your chart signs after detecting the following patterns:
1/2/3
Hammer
Shooting Star
Bullish Engulfing
Bearish Engulfing
And before that he will filter them by common technical rules
ROC-WMA bull bear indicatorROC-Weighted MA Oscillator
By Ludovic B
Modified source code of SeerQuant
The ROC-Weighted MA Oscillator (ROCWMA) is a momentum-driven oscillator designed to expose hidden acceleration and deceleration phases in price action by dynamically weighting a moving average with the normalized Rate of Change (ROC).
Instead of treating all price deviations equally, this indicator amplifies meaningful moves and suppresses low-energy noise, making it particularly effective in scalping, intraday trading, and momentum reversals.
🔧 Core Concept
A base moving average (SMA, EMA, TEMA, DEMA, HMA, ALMA, etc.)
Weighted by normalized ROC
Transformed into a Z-score oscillator for comparability across assets
Smoothed with a signal line for timing precision
Result: a context-aware oscillator that adapts to market intensity.
📊 What the Oscillator Shows
Bullish momentum when histogram is positive and expanding
Bearish momentum when histogram is negative and expanding
Neutral zone to filter chop and avoid over-trading
Automatic color logic to highlight regime changes
Optional candle coloring reflects the active momentum state.
🎯 Signal-Based Price Markers (Advanced Feature)
This script includes price-chart markers when:
The signal line retraces to X% of the maximum oscillator bar of the current momentum phase
AND the signal slope confirms exhaustion (rising or falling)
Key characteristics:
Adaptive thresholds (relative, not fixed)
Separate logic for bullish and bearish phases
Reset on each neutral-zone transition
Configurable number of markers per momentum cycle
This makes the indicator particularly useful for:
Pullback entries
Momentum fading
Timing partial exits
⚙️ Customization
Fully adjustable ROC length, MA type, signal length
Neutral zone threshold control
Multiple color schemes
Optional candle coloring
Adaptive signal-to-oscillator percentage logic
🧠 Best Use Cases
Scalping (M1–M5)
Intraday momentum confirmation
Pullback and exhaustion detection
Cross-asset trading (FX, indices, crypto, metals)
ROCWMA is not a lagging oscillator.
It is a momentum intensity detector built to reveal when price moves matter.
ROC-WMA bull bear indicatorROC-Weighted MA Oscillator
based on Seequant indicator
The ROC-Weighted MA Oscillator (ROCWMA) is a momentum-driven oscillator designed to expose hidden acceleration and deceleration phases in price action by dynamically weighting a moving average with the normalized Rate of Change (ROC).
Instead of treating all price deviations equally, this indicator amplifies meaningful moves and suppresses low-energy noise, making it particularly effective in scalping, intraday trading, and momentum reversals.
🔧 Core Concept
A base moving average (SMA, EMA, TEMA, DEMA, HMA, ALMA, etc.)
Weighted by normalized ROC
Transformed into a Z-score oscillator for comparability across assets
Smoothed with a signal line for timing precision
Result: a context-aware oscillator that adapts to market intensity.
📊 What the Oscillator Shows
Bullish momentum when histogram is positive and expanding
Bearish momentum when histogram is negative and expanding
Neutral zone to filter chop and avoid over-trading
Automatic color logic to highlight regime changes
Optional candle coloring reflects the active momentum state.
🎯 Signal-Based Price Markers (Advanced Feature)
This script includes price-chart markers when:
The signal line retraces to X% of the maximum oscillator bar of the current momentum phase
AND the signal slope confirms exhaustion (rising or falling)
Key characteristics:
Adaptive thresholds (relative, not fixed)
Separate logic for bullish and bearish phases
Reset on each neutral-zone transition
Configurable number of markers per momentum cycle
This makes the indicator particularly useful for:
Pullback entries
Momentum fading
Timing partial exits
⚙️ Customization
Fully adjustable ROC length, MA type, signal length
Neutral zone threshold control
Multiple color schemes
Optional candle coloring
Adaptive signal-to-oscillator percentage logic
🧠 Best Use Cases
Scalping (M1–M5)
Intraday momentum confirmation
Pullback and exhaustion detection
Cross-asset trading (FX, indices, crypto, metals)
ROCWMA is not a lagging oscillator.
It is a momentum intensity detector built to reveal when price moves matter.
Bullish/Bearish Trend OscillatorThis oscillator compresses multiple trend signals into a single 0–100 gauge (50 = neutral). It combines:
Fast trend alignment (SMA stack + MACD)
Distance from SMA20 and SMA200 (stronger bear weighting below)
SMMA channel position
Trend line channel position
Price momentum (bar‑to‑bar change)
Volume ratio (green vs red candle weight)
The result is a smoothed, step‑colored trend score that highlights bullish vs bearish pressure and helps identify trend strength changes over time.
Note:
This is an educational indicator and not financial advice.
LINHFX Bull Bear DivergenceBull Bear Divergence is a momentum-based indicator designed to analyze bullish and bearish strength and identify divergence between price action and market momentum.
It helps traders detect:
Bullish divergence (potential upside reversal)
Bearish divergence (potential downside reversal)
Shifts in buying and selling pressure
This indicator is ideal for Price Action, Smart Money Concept (SMC), intraday and swing trading, and works across multiple timeframes and markets such as Forex, Gold, Crypto, and Indices.
Best used in combination with market structure, key levels, and risk manageme
LinhFX Bull Bear Divergence 2.0 Bull Bear Divergence is a momentum-based indicator designed to analyze bullish and bearish strength and identify divergence between price action and market momentum.
It helps traders detect:
Bullish divergence (potential upside reversal)
Bearish divergence (potential downside reversal)
Shifts in buying and selling pressure
This indicator is ideal for Price Action, Smart Money Concept (SMC), intraday and swing trading, and works across multiple timeframes and markets such as Forex, Gold, Crypto, and Indices.
Best used in combination with market structure, key levels, and risk manageme
BBP Oscillator V1 + Multiple Time FrameBull Bear Power + HTF/LTF Filter (BBP+)
Overview:
BBP+ is a minimalist Bull Bear Power histogram designed to help traders identify potential bearish signals while filtering them with current and higher timeframe trends. An optional lower timeframe (LTF) filter can further reduce false signals, without displaying extra markers on the chart.
Inputs:
BBP Length: EMA length for BBP calculation (smaller → more sensitive, larger → smoother).
EMA Trend (Current TF): Current timeframe trend filter (signals only when bearish).
HTF Timeframe & EMA: Higher timeframe trend filter (optional).
Enable HTF Filter: Toggle HTF trend filter.
LTF Timeframe & Enable LTF Filter: Optional filter to reduce false signals; no visual output.
Show Signals: Toggle to show/hide main bearish signals.
Signal Logic:
Main bearish signals appear when:
Current trend is bearish
BBP momentum is decreasing
Optional HTF trend filter passes
Optional LTF momentum filter passes
Important Notes
Indicator is not a guaranteed profit tool; use for analysis only.
Past performance does not indicate future results.
LTF filter does not appear visually, only helps filter main signals.
Adjust BBP Length, EMA Trend, and HTF/LTF settings according to market volatility and timeframe.
Weekly EMA Squeeze (Bullish + Bearish)Purpose
The Weekly EMA Squeeze indicator identifies periods where price is compressing tightly around a cluster of weekly EMAs and then flags when that compression resolves with directional bias. It is designed to surface high-timeframe inflection points where trends are most likely to begin or meaningfully change.
This indicator operates entirely on weekly data, even when viewed on lower timeframes.
________________________________________
Core Components
1. Weekly EMA Cluster
• Uses three weekly EMAs (fast / mid / slow)
• Compression is defined by:
o Tight EMA spread
o Reduced weekly volatility (ATR contraction)
• Represents balance and indecision at a higher timeframe
2. Bullish Weekly EMA Squeeze
Triggered when:
• EMAs are tightly compressed
• Price is holding above or within the EMA cluster
• EMA slopes flatten or turn upward (optional filter)
• Optional requirement: weekly close above EMA cluster
Displayed as:
• Green upward triangles
• Green vertical shaded band marking the squeeze event window
3. Bearish Weekly EMA Squeeze
Triggered when:
• EMAs are tightly compressed
• Price is holding below or within the EMA cluster
• EMA slopes flatten or turn downward (optional filter)
• Optional requirement: weekly close below EMA cluster
Displayed as:
• Red downward triangles
• Red vertical shaded band marking the squeeze event window
4. Vertical Shaded Event Bands
• Each squeeze event (bull or bear) is visually marked with a vertical shaded region
• Shading appears on every qualifying event, including consecutive ones
• Purpose: clearly identify when the market entered a compressed, directional decision state
________________________________________
What the Indicator Is Signaling
• Compression + directional bias, not immediate breakouts
• Transition points between:
o Range → trend
o Trend → reversal
o Trend → re-acceleration after consolidation
This indicator does not attempt to predict magnitude — it identifies timing and regime change risk.
________________________________________
How to Use It
Best used for:
• High-timeframe bias setting
• Filtering lower-timeframe signals
• Identifying when to stop fading price
• Recognizing when volatility expansion is likely
Typical interpretations:
• Bullish squeeze → bias shifts upward; favor long exposure
• Bearish squeeze → bias shifts downward; favor defensive or short exposure
• Multiple squeezes in same direction → trend reinforcement
• Rapid bull ↔ bear flips → higher-timeframe indecision
________________________________________
What It Is Not
• Not an entry trigger by itself
• Not a momentum oscillator
• Not a replacement for breakout confirmation
This indicator answers:
“Is the weekly market coiling, and in which direction is pressure building?”
Bull-Bear with Gainer-Looser Dashboard Scanner [Chartology.AI] 🔍 Bull-Bear with Gainer-Looser Dashboard Scanner
This advanced multi-symbol scanning tool provides a professional-grade dashboard for analyzing trend reversals across 40 selected tickers simultaneously. It identifies high-probability entry points using a refined engine combined with real-time Gainer & Looser performance metrics.
🟢 Bullish & Bearish Signals
The scanner detects possible moment a trend shifts direction.
Input Settings
Signal Type: Safe
Appears after a proper trend confirmation.
Low frequency, fewer signals, but more reliable.
Best for swing traders who want strong confirmation before entering.
Signal Type: Scalping
Appears frequently during small downward moves.
High frequency, quick signals for short-term trades.
Best for intraday
Traders who want multiple opportunities in small movements.
📊 Real-Time Dashboard Metrics
The Dashboard is clean, auto-sorting table at the bottom of your chart. Each cell provides critical data points for immediate decision-making:
Symbol Name: Shows the ticker (e.g. XAUUSD, EURUSD).
Signal Age (⏱️): Displays exactly how many candles ago the signal appeared. The dashboard automatically sorts the newest signals to the top .
Intraday Strength (ROC%): Shows the percentage change from the current session's open.
▲ Green: Price is trading above the opening bell (Intraday Gainer).
▼ Red: Price is trading below the opening bell (Intraday Looser).
🚦 Key Functional Features
Multi-Symbol Processing: Scans any 40 symbols in a single view.
Recency Filter: The Max Bars Ago input allows you to hide "stale" signals, showing only entries that happened within your preferred window.
Adaptive Grid Layout: The table dynamically wraps based on the Max Columns setting, keeping your chart workspace visible.
🧭 How to Use for Maximum Accuracy
Check Signal Age: Prioritize signals that are 1–3 bars old . Signals older than 5 bars may have already reached their primary targets.
Validate with ROC: A Bullish signal is much stronger if the ROC is also positive (▲). This confirms that institutional buyers are active for the day.
Align Timeframes: Use the ROC Timeframe input to align the scanner with a higher timeframe (like 30m or 1H) to trade with the "Big Trend."
🕵🏻 Quick Setup Guide
Select Symbols: Use the input toggles to enable/disable specific stocks.
Choose Frequency: Switch to Scalping for volatile days and Safe for trending markets.
Set Lookback: Adjust Max Bars Ago to 5 if you only want to see the most immediate "Hot" signals.
📊 Healthy Trading Tips
Risk Small: Never risk more than 1–2% per trade.
Size Smart: Adjust position size to volatility and account size.
Diversify: Don’t put all money in one asset/sector.
Plan Ahead: Set entry, exit, and stop‑loss before trading.
Trade Less: Focus on quality setups, avoid overtrading.
Use Both Analyses: Combine technical charts with fundamental news/events.
Control Emotions: Stick to strategy, avoid fear/greed.
Journal Trades: Record reasons, outcomes, and lessons.
Stay Informed: Track economic calendars and global events.
Take Breaks: Step away after wins/losses to reset.
🎯 Advanced Discipline
Partial Exit: Book profits in stages (e.g., 50% at 1:1, 50% at Final Level).
Check News: Avoid trading during major announcements.
No Tweaks: Don’t change plan mid‑trade; wait for SL/TP.
Fixed Rules: Trade with fixed risk, fixed gains.
No Averaging Losses: Close bad trades, don’t add more.
Keep Learning: Evolve strategy with market changes.
Backtest: Practice setups until they’re second nature.
Daily Routine: Pre‑market Preparation, post‑market review.
Track Metrics: Win rate, average reward, expectancy, and setup performance.
Respect Trend: Trade with momentum, not against it.
Avoid Over‑Leverage: Keep leverage low, avoid margin unless planned.
🚫 Risk Disclaimer
This content, including any tools, software, datafeeds, indicators, or scanners, is provided strictly for charting, educational, informational, and paper‑trading purposes only. It does not constitute investment advice, buy/sell recommendations, or real‑money trading strategies.
Not Advisors: We are not registered as investment advisors or research analysts.
Charting Only: Use is limited to testing strategies; any application to real trading is at the user’s sole risk.
No Liability: No liability is accepted for financial loss or damages arising from use of these tools.
High Risk: Trading and investing involve substantial risk and can result in losses beyond initial capital.
⚠️ Final Note: Trading is speculative and may not be suitable for all investors. Use only risk capital and never invest money you cannot afford to lose.
✅ Always remember🧠 my 3R Rule💡:
If the money💰 is yours then, RISK⚖️, REWARD🏆 and REGRET😔 are solely yours. 🔥
Aggregate Bull & Bear IndexAggregate Bull and Bear Index
The Aggregate Bull and Bear Index represents a systematic approach to measuring market sentiment through the aggregation of multiple fundamental market factors. This indicator draws conceptual inspiration from the Bank of America Bull and Bear Indicator, a widely followed institutional sentiment gauge that has demonstrated significant predictive value for market turning points over multiple market cycles (Hartnett, 2019). While the original Bank of America indicator relies on proprietary institutional data flows and internal metrics that remain inaccessible to individual investors, the Aggregate Bull and Bear Index provides a methodologically similar framework using publicly available market data, thereby democratizing access to sentiment analysis previously reserved for institutional participants.
The theoretical foundation of sentiment based investing rests on decades of behavioral finance research demonstrating that market participants systematically exhibit predictable psychological biases during periods of extreme optimism and pessimism. Shiller (2000) documented how irrational exuberance manifests in asset prices through feedback loops of investor enthusiasm, while Kahneman and Tversky (1979) established that human decision making under uncertainty deviates substantially from rational expectations. These behavioral patterns create opportunities for contrarian strategies that exploit the tendency of crowds to overreact at market extremes. The Aggregate Bull and Bear Index quantifies these psychological states by synthesizing information from diverse market segments into a unified scale ranging from zero to ten, where readings below two indicate extreme fear and readings above eight signal extreme greed.
Methodology and Calculation Framework
The methodology underlying the Aggregate Bull and Bear Index incorporates statistical normalization techniques that transform raw market data into comparable standardized scores. Each component factor is processed through a calculation that measures how far current values deviate from historical norms, effectively capturing whether specific market metrics exhibit unusual readings relative to their own history. These normalized components are then aggregated using a weighting scheme designed to balance information from different market segments while minimizing noise and false signals. The final composite undergoes percentile ranking over a trailing lookback period to produce the familiar zero to ten scale that facilitates intuitive interpretation.
The indicator incorporates several important features designed to enhance signal quality and reduce the probability of acting on spurious readings. A consensus filter examines whether multiple underlying components align in the same direction, adding weight to signals when broad agreement exists across different market factors and discounting readings that rest on narrow evidence. Dynamic threshold adjustment allows the extreme zones to adapt to changing market volatility regimes, recognizing that the appropriate definition of extreme varies depending on ambient market conditions. These refinements reflect lessons learned from decades of quantitative finance research on signal processing and regime detection.
Professional Application and Portfolio Integration
Professional portfolio managers have long recognized the value of sentiment indicators as a complementary tool to fundamental and technical analysis. The fundamental insight underlying sentiment based strategies is elegantly simple yet empirically robust. When market participants become uniformly bullish, marginal buyers become exhausted and the probability of price declines increases substantially. Conversely, when pessimism reaches extreme levels, forced selling creates attractive entry points for patient capital. Bank of America research found that their Bull and Bear Indicator generated a remarkable track record when deployed as a contrarian signal, with extreme fear readings historically preceding positive forward returns in equity markets (Bank of America Global Research, 2020). The Aggregate Bull and Bear Index applies this same contrarian logic while adapting the methodology to accommodate the data constraints facing individual investors.
For institutional investors operating with fiduciary responsibilities and substantial capital, the Aggregate Bull and Bear Index serves as one input among many in comprehensive risk management frameworks. Large asset managers might use extreme readings to trigger portfolio review processes, stress testing exercises, or adjustments to tactical allocation overlays. The indicator proves particularly valuable when it diverges from consensus expectations, as such divergences often precede meaningful market inflections. Hedge fund managers implementing systematic strategies can incorporate the index as a conditioning variable that adjusts position sizing or strategy weights based on the prevailing sentiment environment.
The integration of sentiment analysis into investment practice finds support in the concept of informational efficiency and the limits thereof. While efficient market hypothesis suggests that prices reflect all available information, the behavioral finance literature demonstrates that information processing by market participants exhibits systematic biases that create temporary mispricings (Barberis and Thaler, 2003). Sentiment indicators capture the psychological dimension of this information processing, providing insight into how market participants collectively interpret and react to fundamental developments. Extreme sentiment readings often indicate that psychological factors have pushed prices away from levels justified by fundamentals alone, creating opportunities for those willing to act against prevailing market opinion.
Practical Implementation for Individual Investors
The practical implementation of the indicator follows straightforward principles that both sophisticated institutions and individual retail traders can apply within their existing investment frameworks. When the index falls into the extreme fear zone below a reading of two, this suggests that market participants have become excessively pessimistic and that risk assets may offer favorable risk reward characteristics. Traders might consider this an opportune moment to increase equity exposure or reduce hedging positions. When the index rises into the extreme greed zone above eight, the opposite dynamic applies and a defensive posture becomes prudent. This could manifest as reducing equity allocations, increasing cash reserves, or implementing protective hedging strategies. The neutral zone between these extremes suggests no strong directional bias from a sentiment perspective, during which time other analytical frameworks should take precedence in decision making.
Individual retail investors can derive substantial benefit from the indicator even without sophisticated infrastructure or large capital bases. The most straightforward application involves treating extreme readings as alerts that warrant careful examination of existing portfolio positioning. A reading in the extreme fear zone might prompt consideration of whether recent market declines have created opportunities to deploy excess cash or rebalance toward equities. A reading in the extreme greed zone could trigger review of whether current equity exposure exceeds target allocations and whether risk reduction measures merit consideration. Importantly, the indicator should inform rather than dictate investment decisions, serving as one valuable perspective within a broader analytical framework.
Retail investors frequently find themselves at a psychological disadvantage during market extremes because emotional responses to portfolio losses or gains often prompt actions contrary to long term wealth accumulation. The academic literature on investor behavior consistently documents that individual investors tend to buy near market peaks when confidence runs highest and sell near market bottoms when fear dominates (Barber and Odean, 2000). A systematic sentiment indicator provides an objective framework for recognizing these emotional extremes and consciously acting against natural psychological impulses. By externalizing the assessment of market mood into a quantifiable metric, investors create psychological distance from their own emotional state and gain perspective on the collective sentiment environment.
The decision to implement a sentiment indicator within an investment process requires thoughtful consideration of how it complements existing analytical approaches. Technical analysts may find that sentiment readings help contextualize chart patterns and momentum signals, with extreme fear adding conviction to bullish technical setups and extreme greed warranting caution even when price trends appear strong. Fundamental investors can use sentiment as a timing tool that helps avoid the common mistake of being right on valuation but wrong on timing. Quantitative investors might incorporate sentiment factors into multi factor models or use them to adjust position sizing across strategies.
Trading Behavior and Strategy Characteristics
The Aggregate Bull and Bear Index employs a contrarian investment methodology that fundamentally diverges from trend following approaches prevalent in systematic trading. The trading logic rests upon the principle of accumulating positions when collective fear pervades market sentiment and liquidating those positions when greed dominates investor psychology. This approach stands in direct opposition to momentum strategies that amplify existing market movements rather than positioning against them.
The observation that the indicator frequently initiates long positions despite subsequent downward price movement represents not a flaw but an inherent characteristic of contrarian strategies. When the indicator signals extreme fear, this indicates that market participants have already engaged in substantial selling and pessimistic expectations have become embedded in asset prices. However, this emphatically does not guarantee that the ultimate trough has been reached. Fear can intensify, panic selling can escalate, and fundamental deterioration can trigger additional price declines before stabilization occurs. The indicator identifies phases where the statistical probability distribution of future returns appears favorable rather than pinpointing exact inflection points. Academic research by De Bondt and Thaler (1985) demonstrated that markets systematically overreact to both positive and negative information, creating opportunities for patient contrarian investors willing to endure interim volatility.
Risk Profile and Investment Considerations
This characteristic produces a distinctive risk profile that investors must thoroughly comprehend before implementation. The primary danger manifests in what practitioners colloquially term catching a falling knife. Purchasing assets during declining markets exposes capital to potentially severe interim drawdowns even when the ultimate investment thesis proves correct. The backtest evidence reveals numerous instances where positions experienced double digit percentage declines before eventually generating positive returns or triggering exit signals. Investors lacking the psychological fortitude to maintain positions through such adversity will inevitably abandon the strategy at precisely the wrong moment, crystallizing losses that patient adherents would have recovered. Behavioral research by Odean (1998) documented that individual investors exhibit a strong disposition effect, holding losing positions too long in some contexts while selling winners prematurely, yet paradoxically abandoning systematic strategies during drawdowns when discipline matters most.
The temporal dimension of contrarian investing demands particular attention. Unlike trend following strategies that can generate returns relatively quickly by riding established momentum, contrarian approaches often require extended holding periods before mean reversion materializes. The indicator may signal fear and initiate positions that subsequently experience weeks or months of continued decline before sentiment shifts and prices recover. This extended timeline conflicts with human psychological preferences for immediate gratification and creates substantial opportunity for doubt and strategy abandonment. Investors must recognize that the strategy optimizes for terminal wealth accumulation over extended horizons rather than minimizing short term discomfort.
A critical risk factor involves the possibility of genuine regime changes that invalidate historical relationships. While extreme fear readings have historically preceded favorable forward returns, this pattern assumes that pessimism eventually proves excessive and fundamentals stabilize or improve. In scenarios involving structural economic transformation, permanent impairment of earnings power, or systemic financial crisis, fear may prove entirely justified rather than excessive. The indicator cannot distinguish between irrational panic creating buying opportunities and rational recognition of deteriorating fundamentals. This limitation underscores the importance of using the indicator as one input among many rather than as a standalone decision mechanism.
Risk management applications deserve particular attention given the indicator's historical tendency to signal market stress before price declines fully materialize. Portfolio managers charged with protecting capital during drawdowns can use rising greed readings as an early warning system that justifies defensive measures such as reducing beta exposure, increasing cash allocations, or purchasing portfolio protection through options strategies. The contrarian nature of the indicator means that protective action occurs when markets appear strongest rather than weakest, avoiding the common trap of implementing risk reduction after substantial losses have already occurred.
Opportunity Set and Compounding Benefits
The opportunity set presented by contrarian sentiment investing derives from persistent behavioral biases that academic research has extensively documented. Extrapolation bias leads investors to assume recent trends will continue indefinitely, causing excessive optimism after gains and excessive pessimism after losses (Greenwood and Shleifer, 2014). Herding behavior amplifies these tendencies as investors observe and mimic the actions of others, creating self reinforcing cycles of buying or selling that push prices away from fundamental values. The Aggregate Bull and Bear Index systematically exploits these patterns by positioning against the prevailing emotional consensus.
The compounding benefits of buying during fear merit emphasis. When the indicator signals extreme pessimism, asset prices by definition trade at depressed levels relative to recent history. Investors who accumulate positions at these reduced valuations capture not only potential price recovery but also enhanced long term compound returns from reinvesting dividends and earnings at favorable prices. This mathematical advantage compounds over decades, explaining why legendary investors from Benjamin Graham to Warren Buffett have emphasized the importance of purchasing during periods of market distress despite the psychological difficulty such actions entail.
Investor Suitability and Implementation Requirements
Regarding suitability, the Aggregate Bull and Bear Index aligns most appropriately with investors possessing specific characteristics. First, a genuinely long term investment horizon measured in years rather than months proves essential. The strategy will underperform during extended bull markets when momentum approaches dominate and will experience painful interim drawdowns during crisis periods. Only investors capable of maintaining positions through these challenging phases will capture the strategy's full return potential. Second, psychological resilience to act against consensus and tolerate portfolio volatility represents a prerequisite. Research by Goetzmann and Kumar (2008) demonstrated that most individual investors lack the temperament for contrarian strategies despite their theoretical appeal. Third, sufficient financial reserves to avoid forced liquidation during drawdowns ensures that temporary price declines do not become permanent capital impairment.
The indicator proves less suitable for investors seeking steady returns with minimal volatility, those with short investment horizons or imminent liquidity needs, and individuals whose emotional responses to portfolio fluctuations compromise rational decision making. Institutional investors with quarterly performance pressures may find the strategy incompatible with their governance constraints despite its long term merits. Retirees depending on portfolio withdrawals must carefully consider whether interim drawdowns could force disadvantageous liquidations.
For appropriate investors, the Aggregate Bull and Bear Index offers a systematic framework for implementing time tested contrarian principles that have generated superior long term returns across multiple market cycles. By externalizing sentiment assessment into an objective metric, the indicator helps investors overcome the natural human tendency to capitulate at market bottoms and chase performance at market tops. The strategy demands patience, discipline, and genuine long term orientation, but rewards those characteristics with the potential for meaningful wealth accumulation over extended investment horizons.
Proprietary Elements and Limitations
The proprietary aspects of the indicator's construction reflect both practical and theoretical considerations. From a practical standpoint, maintaining certain methodological details as proprietary preserves the informational advantage that the indicator provides and prevents degradation of signal quality that might occur if widespread adoption prompted market participants to trade directly against the underlying components. From a theoretical perspective, the specific parameter choices and weighting schemes represent empirical findings from extensive research that constitute intellectual property developed through substantial effort.
Academic research on sentiment indicators provides encouraging evidence regarding their predictive value while appropriately acknowledging limitations. Baker and Wurgler (2006) demonstrated that investor sentiment predicts the cross section of stock returns, with high sentiment periods followed by lower returns for speculative stocks prone to overvaluation during euphoric conditions. Brown and Cliff (2005) found that sentiment measures contain information about near term market returns beyond that captured by traditional risk factors. However, the same literature cautions that sentiment signals exhibit variable lead times and occasional false positives, reinforcing the importance of using such indicators as part of comprehensive analytical frameworks rather than standalone trading systems.
The Aggregate Bull and Bear Index ultimately represents an attempt to bridge the gap between institutional grade sentiment analysis and the tools available to broader investor populations. By providing a systematic framework for assessing collective market psychology, the indicator empowers users to recognize emotional extremes and consider contrarian positioning when conditions warrant. The historical tendency of markets to reverse from extreme sentiment readings creates opportunities for those willing to act against crowd psychology, while the indicator's multi factor construction and quality filters help distinguish genuine extremes from temporary fluctuations. Whether deployed by professional money managers seeking to refine risk management practices or individual investors striving to overcome behavioral biases, the Aggregate Bull and Bear Index offers a valuable perspective on the eternal struggle between fear and greed that drives financial markets.
References
Baker, M. and Wurgler, J. (2006) Investor sentiment and the cross section of stock returns. The Journal of Finance, 61(4), pp. 1645 to 1680.
Bank of America Global Research (2020) The Bull and Bear Indicator: A contrarian timing tool. Bank of America Securities Research Report.
Barber, B.M. and Odean, T. (2000) Trading is hazardous to your wealth: The common stock investment performance of individual investors. The Journal of Finance, 55(2), pp. 773 to 806.
Barberis, N. and Thaler, R. (2003) A survey of behavioral finance. Handbook of the Economics of Finance, 1, pp. 1053 to 1128.
Brown, G.W. and Cliff, M.T. (2005) Investor sentiment and asset valuation. The Journal of Business, 78(2), pp. 405 to 440.
De Bondt, W.F.M. and Thaler, R. (1985) Does the stock market overreact? The Journal of Finance, 40(3), pp. 793 to 805.
Goetzmann, W.N. and Kumar, A. (2008) Equity portfolio diversification. Review of Finance, 12(3), pp. 433 to 463.
Greenwood, R. and Shleifer, A. (2014) Expectations of returns and expected returns. The Review of Financial Studies, 27(3), pp. 714 to 746.
Hartnett, M. (2019) Flow Show: Bull and Bear Indicator methodology and applications. Bank of America Merrill Lynch Investment Strategy.
Kahneman, D. and Tversky, A. (1979) Prospect theory: An analysis of decision under risk. Econometrica, 47(2), pp. 263 to 291.
Odean, T. (1998) Are investors reluctant to realize their losses? The Journal of Finance, 53(5), pp. 1775 to 1798.
Shiller, R.J. (2000) Irrational Exuberance. Princeton University Press.
Script a pagamento
Bullish, Bearish, & Normal RSI1. Identifying "True" Momentum (The Aqua/Fuchsia Logic)The most useful part of this script is the comparison between the three lines.Bullish Conviction (Aqua): When both the Bullish and Bearish lines are above the Normal RSI, it suggests that even on "down" candles (red candles), the price isn't losing significant ground. The overall structure is buoyant.Bearish Conviction (Fuchsia): When both are below the Normal RSI, it indicates that even when you get "up" candles (green candles), they lack the strength to lift the average momentum. The sellers are effectively "smothering" the bounces.
2. Spotting Hidden Weakness/Strength (Spread Analysis)The "Spread" (the gap between rsiBull and rsiBear) provides a unique utility:ScenarioInterpretationUtilityWide SpreadHigh volatility and indecision. Green candles are very strong, but red candles are also very weak.Avoid trend-following; wait for a "squeeze" or narrowing.Tight SpreadHigh agreement in price action. Most candles are moving in a similar direction or with similar intensity.Great for identifying stable, trending moves with low noise.Bull/Bear CrossIf the Bullish RSI crosses above the Bearish RSI significantly.Can act as an early entry signal before the Standard RSI hits the 50-midline.
3. Practical Strategy Use CasesFilter for Breakouts: If you see a price breakout but the RSI color remains Gray, the move might lack "conviction." You ideally want to see the color flip to Aqua (for long) or Fuchsia (for short) as the breakout occurs.Exhaustion Signal: If the Normal RSI is overbought ($>70$) but the rsiBull begins to dip toward the rsiNormal, it suggests that the "green candle strength" is waning even if the price is staying high—a potential warning of a reversal.Potential Drawbacks to WatchLag: Like all RSI-based indicators, this is lagging. Because you are using a 14-period lookback on three different calculations, it may take a few bars to confirm a sentiment shift.Whipsaw in Sideways Markets: In a tight range-bound market, the color may flip between Aqua and Fuchsia rapidly, creating "noise."Pro-Tip: This indicator would be most effective when used in conjunction with Volume. If you get an "Aqua" signal on rising volume, the probability of a sustained trend is significantly higher.
ABCD Harmonic Pattern Strategy (Bull + Bear) This script is a strategy implementation of the classic ABCD Harmonic Pattern, designed for market structure analysis, backtesting, and educational research.
The ABCD pattern is one of the foundational harmonic price patterns in technical analysis. Its Fibonacci ratio relationships were formalized and standardized within harmonic trading theory by Scott M. Carney, whose work helped define modern harmonic pattern rules.
This strategy is conceptually inspired by educational ABCD pattern logic shared by the TradingView author theEccentricTrader.
The code, structure, execution logic, filters, and risk management have been independently developed, reconstructed, and extended into a complete TradingView strategy.
What this strategy does
Detects bullish and bearish ABCD harmonic patterns based on price structure and Fibonacci ratios.
Reconstructs ABCD market structure logic for both directions instead of using a simple visual inversion.
Draws the ABCD legs, structure labels (A, B, C, D), and projection levels directly on the chart.
Generates long and short trade entries using confirmed ABCD structures.
Includes optional confluence filters, such as:
Higher-timeframe EMA trend filter
RSI strength filter
ATR volatility filter
Volume confirmation
Candle body confirmation
Minimum bounce distance from point D
Provides built-in risk management, including:
Configurable Stop Loss
Configurable Take Profit
Optional trailing stop
Designed for backtesting, parameter optimization, and analytical research.
Why this strategy is different
This script is not a simple indicator conversion nor a basic bullish/bearish mirror.
The ABCD pattern logic has been recreated at the structural level to better reflect how bullish and bearish market formations behave in real price action.
Key differences
Reconstructed bullish and bearish structures
Bullish and bearish ABCD patterns are independently defined using market structure logic, not just inverted visually.
Each direction has its own pivot relationships and validation rules to produce a more faithful representation of the ABCD pattern.
Structure-aware pattern validation
Pattern confirmation is based on price swings, structure continuity, and Fibonacci alignment, helping reduce distorted or forced patterns.
Strategy-based execution
Unlike indicator-only ABCD tools that only visualize patterns, this script uses strategy.entry and strategy.exit, enabling full backtesting and performance analysis.
Confluence-driven entries
Trade entries can require multiple confirmation layers beyond the pattern itself, helping reduce low-quality signals and overtrading.
Integrated risk management
Stop Loss, Take Profit, and optional trailing logic are applied consistently for both long and short positions.
Non-repainting design
Pattern detection and entries rely on confirmed bars (barstate.isconfirmed) and higher-timeframe data with lookahead_off, ensuring signals do not repaint historically.
Improved and controlled visualization
Pattern drawings, projections, and entry markers are managed with strict object limits to comply with TradingView performance and publishing requirements.
How to use
Add the strategy to a chart and select a symbol and timeframe.
Enable or disable filters under “Entry Filters (Confluence)”.
Configure Stop Loss, Take Profit, and trailing behavior under “TP/SL”.
Use pattern drawings and entry markers as visual and analytical confirmation, not as standalone trade signals.
Important notes
This script is provided for educational and research purposes only.
It does not provide financial or investment advice.
No profitability or performance is implied or guaranteed.
Past performance does not indicate future results.
Always test across multiple markets and timeframes and apply proper risk management.
Credits
ABCD Harmonic Pattern: Harmonic trading principles as formalized by Scott M. Carney.
Conceptual inspiration: Educational ABCD pattern logic shared by @theEccentricTrader on TradingView.
Pattern reconstruction, strategy logic, and risk management: Independent development.
ATR Volatility Impulse Candles (Bull & Bear)This indicator highlights unusually strong momentum candles using ATR as a volatility filter. Treyding Stocks was the inspiration behind this powerful swing indicator!
A candle is marked only when its body is larger than the Average True Range, meaning price moved farther than normal for that timeframe. This filters out noise and focuses attention on candles that often matter most.
Lime green candles represent strong bullish impulse. They occur when price closes above the open and the candle body is larger than ATR. These candles often show aggressive buying, late-stage momentum, or exhaustion before a reversal.
Blue candles represent strong bearish impulse. They occur when price closes below the open and the candle body is larger than ATR. These candles often signal aggressive selling, liquidation, stop runs, or breakdown confirmation.
The indicator includes alerts for both bullish and bearish impulse candles, allowing traders to monitor multiple charts without watching them constantly.
Traders commonly use this tool to identify momentum exhaustion, reversal zones, and high-impact candles near VWAP, key moving averages, or important price levels. It works on any timeframe, does not repaint, and is designed to keep the chart clean while highlighting only the most meaningful price moves.
The Red (Blue) candle is very useful for swings especially on the Daily chart
*When the Blue (RED) candle appears, mark the high/low, and enter when the next candle breaks /closes above it.
Confluence Strength Meter (Bull/Bear) [v6]This indicator provides a quantified "Strength Score" (0-5) for price action setups by measuring the confluence of five key technical drivers. It features a Strategy Mode toggle, allowing traders to instantly switch between Bullish (Long) and Bearish (Short) scoring logic.
How it Works: The script analyzes the following factors to build a Confluence Score:
Trend Direction: Price relation to the Slow EMA (50).
EMA Stack: Fast EMA (20) vs. Slow EMA (50) alignment.
Volume Sentiment: Price relation to the Intraday VWAP.
Momentum: MACD vs. Signal line crossover.
RSI Health: Checks for momentum in the correct direction while filtering out extreme exhaustion (Overbought/Oversold).
Features:
Visual Histogram: Color-coded bars (Green/Red for strong setups, Orange for moderate, Gray for weak) make it easy to spot high-confluence zones.
Dual Modes: Input setting to switch the entire logic engine between Bullish and Bearish detection.
Alerts: Pre-configured alert conditions for both Long and Short setups, ready for webhook integration.
Usage: Look for a score of 4 or 5 (brightly colored bars) to confirm high-probability entries in the direction of your selected trend.
Bullish/Bearish Movement SumThis indicator calculates and displays the cumulative sum of bullish and bearish price movements over a specified period.
Features:
- Green line: Cumulative sum of all bullish movements
- Red line: Cumulative sum of all bearish movements (absolute value)
- Blue area: Net difference (bullish - bearish)
- Information table showing current values and bull/bear ratio
Settings:
- Calculation Period: Choose rolling window size (default: 100 bars) or 0 for cumulative from start
- Calculation Mode: Choose between "Points" (absolute price changes) or "Percentage" (% changes)
Use Cases:
- Identify market directional strength
- Compare bullish vs bearish pressure
- Spot divergences between price and directional momentum
- Ratio > 1 indicates more bullish than bearish movement
Developed with assistance from Claude (Anthropic)
Bull/Bear vs Base vs Index (% Change Spread)Visualizes the performance gap ("Beta Decay") between 3x Leveraged ETFs (SOXL/SOXS) and their underlying sector (SOXX), relative to the S&P 500 (SPY).
This indicator is designed for traders who trade leveraged products (like SOXL/SOXS, TQQQ/SQQQ) and need to see true relative strength beyond simple price action.
It calculates the percentage change over a user-defined lookback period for four instruments:
Base (1x): The sector benchmark (Default: SOXX).
Bull (3x): The leveraged long ETF (Default: SOXL).
Bear (-3x): The leveraged inverse ETF (Default: SOXS).
Index: The broad market zero-line (Default: SPY).
It then plots the Spread to reveal the health of the trend:
Bull Spread (Green Line): Bull % - Base %
Bear Spread (Red Line): Bear % - Base %
Base vs Index (Filled Area): Base % - SPY %
🧠 The Logic: Why Use Spreads?
In a perfectly efficient trending market, a 3x Bull ETF should move exactly 300% of the underlying asset. However, in choppy or volatile markets, volatility decay (beta slippage) causes leveraged ETFs to underperform mathematically.
Positive Spread: The leveraged ETF is successfully capturing momentum (The "Sweet Spot").
Negative Spread: The leveraged ETF is suffering from drag or the underlying asset is chopping.
📈 Recommended Trading Plan
Note: This indicator works best as a filter for entry conditions, not a standalone signal. Always use proper risk management.
Strategy A: The "Clean Trend" (Momentum)
Goal: Enter a 3x position only when volatility drag is minimal.
1. Bull Signal:
Condition 1: The Base vs Index (Area) is Green (Sector is outperforming SPY).
Condition 2: The Bull Spread (Green Line) is Positive (> 0).
Why: This confirms the sector is strong AND the 3x ETF is amplifying that move efficiently without decay eating the profits.
2. Bear Signal:
Condition 1: The Base vs Index (Area) is Red (Sector is lagging SPY).
Condition 2: The Bear Spread (Red Line) is Positive (> 0).
Why: This confirms the sector is crashing and the Bear ETF is successfully capturing the downside momentum.
Strategy B: The "Decay Avoidance" (Cash is King)
Goal: Avoid leveraged funds during chop.
Condition: If BOTH the Bull Spread and Bear Spread are Negative (< 0) (below the zero line).
Action: Stay in Cash or trade the 1x underlying (SOXX) only.
Why: When both spreads are negative, it mathematically proves that the market is too choppy for leverage. Both the Long and Short leveraged funds are losing value relative to the underlying asset.
Features:
Pine Script® v6: Updated for the latest engine performance and visuals.
Dashboard Table: Real-time percentage spreads displayed directly on the chart (customizable position).
Fully Customizable: Works on any sector (e.g., set inputs to QQQ/TQQQ/SQQQ for Tech).
Disclaimer:
Trading leveraged ETFs involves significant risk. This script is for educational purposes only.
20-50 EMA Bear / Bull TrendThis indicator identifies uptrends and downtrends based on confirmed EMA crossovers between the 20 EMA and 50 EMA, using candle close confirmation only to avoid false intrabar signals.
• Green up arrow (↑): EMA 20 crosses above EMA 50 → bullish signal / start of an uptrend
• Red down arrow (↓): EMA 20 crosses below EMA 50 → bearish signal / start of a downtrend
The signals are plotted directly on the chart and can be used to create separate TradingView alerts for bullish and bearish crosses.
Key features:
• Visual identification of uptrends and downtrends
• EMA 20 & EMA 50 plotted on the chart
• Signals confirmed on candle close (non-repainting)
• Clear arrow-based signals instead of text labels
• Selectable alert conditions for bullish and bearish crosses
• Optional support for “Any alert() function call”
This indicator works on all timeframes and is suitable for trend detection, momentum shifts, and trade confirmation.


