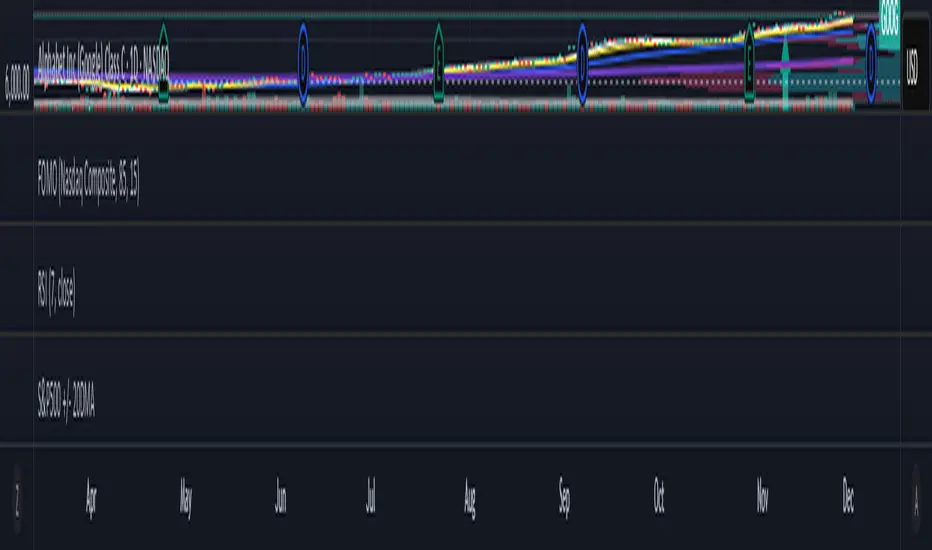
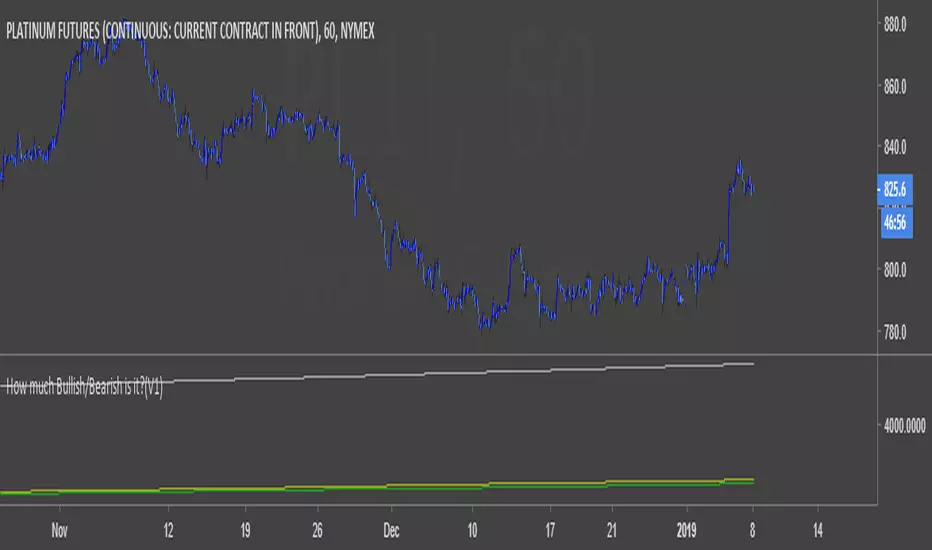
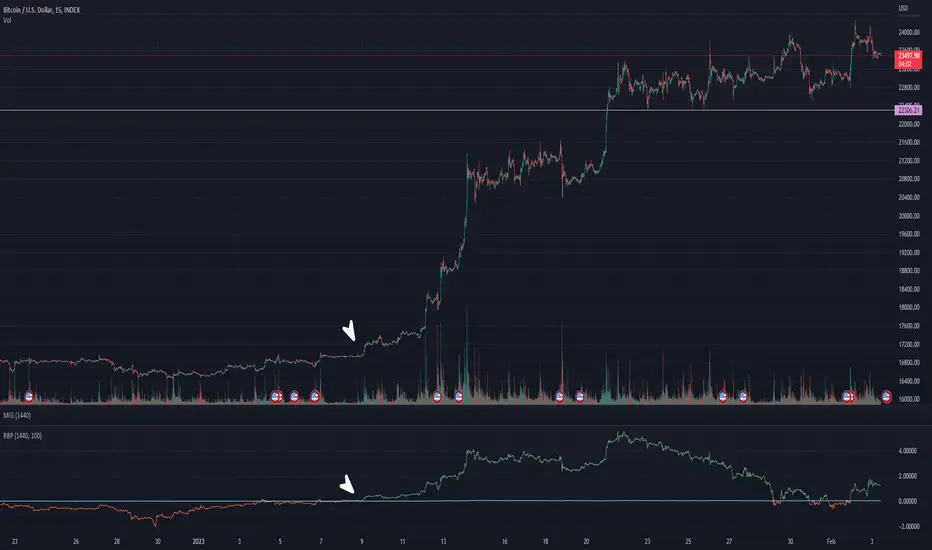
How much Bullish/Bearish is it?(V1)A script can show the amount of the bullishness and bearishness of candles on the chart based on the offered calculations.
Cerca negli script per "bear"
Bull/Bear CandleThis script identifies whether the current and previous candle is bullish, bearish or neutral. Bullish candles are displayed with a green triangle, bearish with a red, and neutral with a yellow. The bull/bear cut off is set at 65% but this is adjustable to your taste.
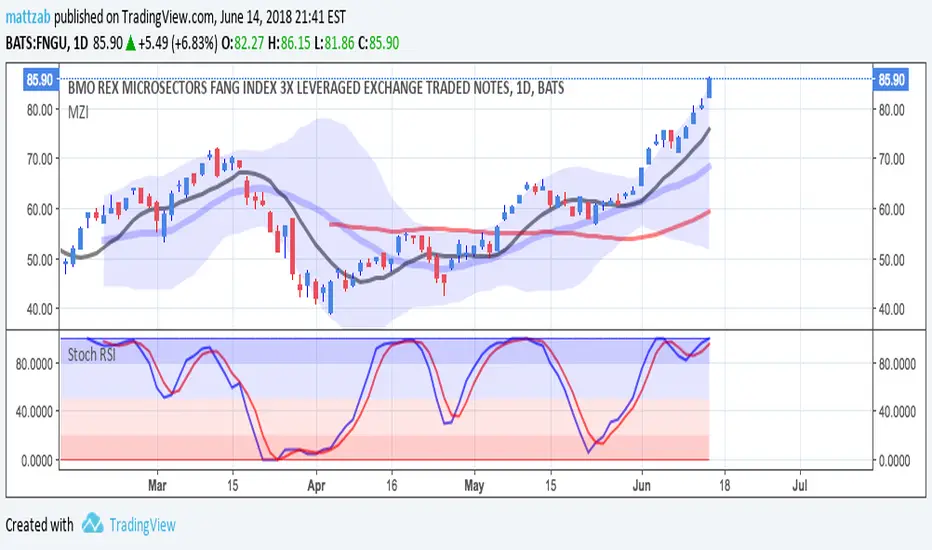
Bull Bear Stoch RSIStandard Stoch RSI with some color modification. 0 - 20 = Really Bearish (Dark Red Zone) 20 - 50 = Bearish (Light Red Zone) 50 - 80 = Bullish (Light Blue Zone) and 80 - 100 = Really Bullish (Strong Blue Zone). Thick lines at top and bottom to easily see 100 and 0.
Confluence Strategy Backtest This is modified version of Dale Legan's "Confluence" indicator written by Gary Fritz.
================================================================
Here is Gary`s commentary:
Since the Confluence indicator returned several "states" (bull, bear, grey, and zero),
he modified the return value a bit:
-9 to -1 = Bearish
-0.9 to 0.9 = "grey" (and zero)
1 to 9 = Bullish
The "grey" range corresponds to the "grey" values plotted by Dale's indicator, but
they're divided by 10.
You can change long to short in the Input Settings
Please, use it only for learning or paper trading. Do not for real trading.

Confluence Strategy This is modified version of Dale Legan's "Confluence" indicator written by Gary Fritz.
================================================================
Here is Gary`s commentary:
Since the Confluence indicator returned several "states" (bull, bear, grey, and zero),
he modified the return value a bit:
-9 to -1 = Bearish
-0.9 to 0.9 = "grey" (and zero)
1 to 9 = Bullish
The "grey" range corresponds to the "grey" values plotted by Dale's indicator, but
they're divided by 10.

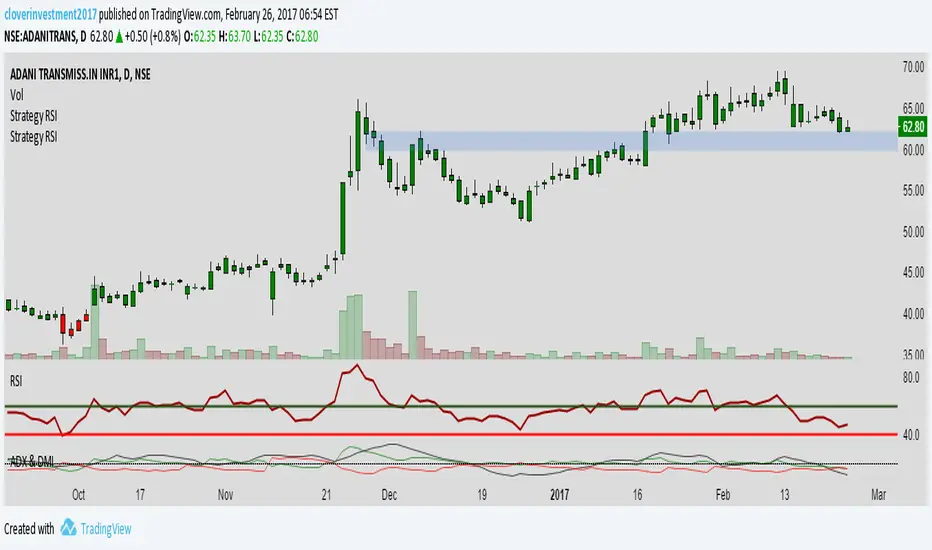
RSI IN Bull AND BEARLook RSI will oversold at 40 and 60 in Bullish Market
and RSI overbought at 60 and 40 at Bearish Market
To know more about Bullish and Bearish Market Criteria
Connect me at cloverinvestmentsindia@gmail.com
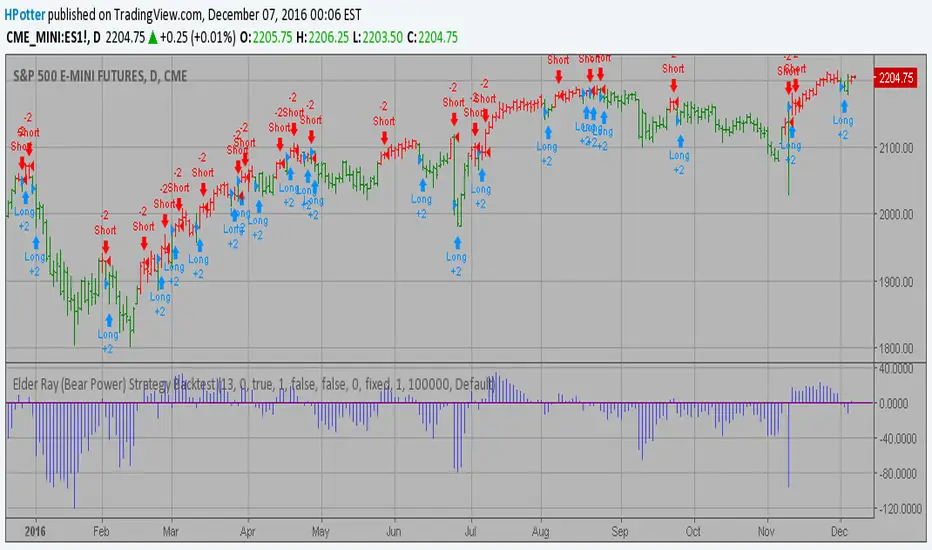
Elder Ray (Bear Power) Strategy Backtest Developed by Dr Alexander Elder, the Elder-ray indicator measures buying
and selling pressure in the market. The Elder-ray is often used as part
of the Triple Screen trading system but may also be used on its own.
Dr Elder uses a 13-day exponential moving average (EMA) to indicate the
market consensus of value. Bear Power measures the ability of sellers to
drive prices below the consensus of value. Bear Power reflects the ability
of sellers to drive prices below the average consensus of value.
Bull Power is calculated by subtracting the 13-day EMA from the day's High.
Bear power subtracts the 13-day EMA from the day's Low.
You can use in the xPrice any series: Open, High, Low, Close, HL2, HLC3, OHLC4 and ect...
You can change long to short in the Input Settings
Please, use it only for learning or paper trading. Do not for real trading.
EMA bullish/bearish dashboard - MTFThis is a good reminder for which way you should be placing orders.
It's best to not ignore these signals!!!
lime = full bull - 100ema above 200ema and price is above 200ema
green = hallf bull - price now below 200ema but 100ema is still above the 200
maroon = full bear - opposite of full bull
red = half bear - opposite of half bull
Also with multi timeframe option - so I guess you could stack several of these on a single framed chart if you wanted.

[NM] EMADiff v01 - an indicator for everyone !Allright gang, we are here with a new indicator that should help you with determining the direction to trade or whether you should trade at all.
It uses the close of the candle and 2 EMAs.
The faster moving line is the difference between the close and the Slow EMA, while the slower moving line shows the difference between the Fast EMA and the Slow EMA.
There are a couple of ways you can use this indicator, depending on your trading style :
For the quick profit, in and out :
- enable the safer trading option and keep smoothing at the default setting, buy when both lines are green, sell when both line are red and get out when one of the lines changes color (or when profit target is reached) (see the top option)
For longer trades :
- you can increase the smoothing, use a higher Slow EMA and disable the Safer trading option, enter either when both lines have the same color, either on a crossover. (the bottom option)
In both cases, if both lines hover around the zero line, the trend is definitely not strong.
Much more options are available so I would love to hear how you use this indicator. A thumbs up if you like it would be highly appreciated :)
Works nicely together with my other indicators below :
To add this indicator (or any other) to your chart, click the "Add to favorites" button. Then while having the chart you wish to apply it to open, click on Indicators > Favorites > EMADiff v01 (or any other indicator that you favorited.

Elder Ray Composite DOA hybrid representation of Elder Ray's Bear/Bull as an oscillator, using TEMA and LRC calculations to average out the signals. The Oscillation is based off of the Derivative oscillator. This gives an interesting interpretation of Bear vs Bull power. Give it a try!

M5_Bull/Bear BBOM5_ Bull/Bear BBO is a derivative oscillator built from LuxAlgo’s original Bollinger Bands Breakout Oscillator (BBO).
This version restructures the original breakout logic into a bull / bear adaptive oscillator, introduces inverted symmetry, and expands the visual system with dynamic level states and conditional color logic. The goal is to provide contextual momentum awareness rather than discrete trade signals.
A key design focus is the interaction between dominant pressure and the absence of opposing pressure. Buying and selling pressure may coexist, but moments where opposing pressure fully dissipates are treated as structurally significant — a “door opening” condition where price is no longer constrained by counter-pressure and is free to expand.
Pressure is explicitly mirrored from the opposite side, creating a symmetrical framework where each side’s expansion is reflected against the other. These mirrored structures are allowed to cross, not as directional signals, but as markers of peak intensity or exhaustion within an expanding pressure phase.
Transitional regimes — where one pressure fades before the other fully emerges — are intentionally left visible rather than smoothed away. These areas often produce late confirmation or no follow-through at all, and are presented as a challenging but informative market state rather than a condition to be optimized away.
The script is intended for visual analysis and context alignment, not as a standalone entry/exit system.
Credits & Licensing
Original concept and base implementation: LuxAlgo
Modifications, restructuring, and visual system: Metaltek5
License: Creative Commons Attribution–NonCommercial–ShareAlike 4.0 (CC BY-NC-SA 4.0)
This script is published as open source under the same license as the original work.
Non-commercial use only. Attribution and share-alike required.
Annotated example illustrating dominant pressure, mirrored behavior, and door opening conditions

MTF SMA Zones + EMA Trend (Bull & Bear) + EMA DisplayMTF SMA Zones + EMA Trend (Bull & Bear) + EMA Display

Ichimoku bull bear trend Multi-BG by Pranojit Dey It gives you bullish and bearish bias using ichimoku, VWAP, SMA and Pivot. can be used as a great confirmation tool for trading. Use it. You will love it. Lets trade traders....

Halo MTF Market Bias (Bull / Bear)This indicator is designed to provide a clear directional market bias at a glance, using a clean and easy-to-read multi-timeframe analysis.
It allows traders to quickly determine whether the market is bullish or bearish, helping them trade only in the direction of the overall market context.
The indicator automatically analyzes the bias on the following timeframes:
1 minute
5 minutes
15 minutes
30 minutes
1 hour
4 hours
Daily
👉 Works on all markets: Crypto, Forex, Indices, Gold, and more.
⚠️ Important
This indicator is not a trading system.
It should be used as a decision-support tool, always combined with a clear strategy and proper risk management.

Bull-Bear Strategy10-level EMA cross-period resonance, accurately capturing trend ignition points and outperforming single-period strategies by far. K-line bull-bear power weighting filters out 90% of oscillating noise, leading to a sharp surge in signal win rate. Historical backtesting yields an outstanding win rate. Strict position control is required for live trading. This does not constitute investment advice.

Bullish & Bearish Engulfing The Bullish & Bearish Engulfing Indicator is a body-based candlestick pattern indicator designed to identify potential trend reversal points in the markets. The indicator automatically detects Bullish Engulfing patterns that appear at the end of downtrends and Bearish Engulfing patterns that form at the end of uptrends.
The Bullish & Bearish Engulfing Indicator is suitable for use with price action, support-resistance, and trend continuation/reversal strategies. Rather than being a standalone trading tool, it is designed as a powerful contextual analysis tool to support decision-making processes. When used with the correct market structure and additional confirmations, it helps to identify high-quality trading opportunities.

RSI Bull bear thresholds region highlight on priceBullish & bearish relative strength thresholds
Default 61 & 39 RSI

Relative Volume: Bull/Bear Bars + Strength IntensityThis indicator:
- Plots volume bars in a separate pane under the ticker's chart.
- Computes and displays RVOL as a decimal (e.g., 1.37), based on current bar volume ÷ average volume over a lookback length (lookback length is customizable).
- Shows the RVOL value in the indicator’s “Values” line (the “ticker” area at the top-left of the pane) by plotting it as a line (and you can also optionally show a label).
- Colors volume bars:
- green on bullish candles
- red on bearish candles
- also reflects RVOL strength via intensity (stronger RVOL = less transparent / more vivid)

MACD-v Bullish/Bearish DivergenceMACD-v Bullish/Bearish Divergence
Overview This indicator is a specialized divergence detector based on the MACD-v (Volatility Normalized Momentum) concept. Unlike standard MACD which uses absolute price differences, MACD-v normalizes values against volatility (ATR), allowing for fixed, universal Overbought/Oversold thresholds across all assets and timeframes.
Recommendation: This script is highly effective when paired with the original MACD-v by Alex Spiroglou. While this indicator focuses on identifying and visualizing divergence entries, using the original oscillator alongside it provides the best visual context for the overall momentum structure.
How It Works
This tool uses a dual-signal mechanism (Raw Line + Signal Smooth) to identify specific divergence setups:
Setup (Yellow/Blue Dots): Identifies when price momentum has extended significantly into extreme zones (Overbought/Oversold).
Trigger (Red/Green Dots): Fires when price fails to make a new momentum extreme despite price action (classic divergence/failure swing).
Active State (Background Color): Once a trigger fires, the background highlights (Red for Bearish, Green for Bullish) to indicate an active divergence play.
Reset (Exit): The signal state clears when momentum returns to the neutral "safe zone."
Important Note: Momentum Washout
The colored background persists as long as the divergence trade remains valid. Traders should note the concept of "Momentum Washout":
Signal End: The background color turns off when the MACD returns to the neutral range, indicating the primary high-velocity impulse is over.
Performance Continuation: Significant positive or negative price performance can often continue even after the background signal ends. This period allows the remaining momentum to "wash out" or drift before the next major impulse.
Strategy Tip: The indicator is designed to capture the high-volatility portion of the reversal. Do not assume the end of the signal is the absolute top or bottom of the trend; it simply marks the normalization of momentum.
Strategy Recommendation: Multi-Timeframe Analysis
Divergence signals are most powerful when confirmed across timeframes. It is highly recommended to look for alignment before taking a trade:
Trend Confirmation: If you see a signal on a lower timeframe (e.g., 5m or 15m), check a higher timeframe (e.g., 1H or 4H). A bullish divergence on the 5m is significantly more reliable if the 1H momentum is already bullish or oversold.
Signal Stacking: Valid signals often appear sequentially—first on the 1m, then the 5m, and finally the 15m. Waiting for this "cascade" can filter out false reversals.
Visual Guide
🔵 Blue Dot: Bullish Divergence Setup (Watch for entry).
🟢 Green Dot: Bullish Divergence Trigger (Long Entry).
🟡 Yellow Dot: Bearish Divergence Setup (Watch for entry).
🔴 Red Dot: Bearish Divergence Trigger (Short Entry).
Background Color: Indicates an active trade (Red = Bearish / Green = Bullish).
Settings
Auto-Detect: Automatically switches between Scalping settings (tighter thresholds) for low timeframes and Swing settings for high timeframes.
Strict Invalidation: If enabled, cancels a setup if momentum pushes too far in the opposite direction before triggering.
Active Signal Multiplier: Dynamically smooths the signal line only when a trade is active to prevent premature exits during choppy corrections.
Disclaimer: This tool is for educational purposes and trend analysis only. Always manage your risk appropriately.

TraderDemircan - Ultimate Fibonacci Suite (Bearish) v2.0-Overview
This indicator is a comprehensive Fibonacci-based trading tool specifically designed for identifying and trading bearish XABCD harmonic patterns. It combines classical Fibonacci retracement/extension levels with advanced harmonic pattern recognition, risk management calculations, and confluence zone detection to provide traders with a complete analytical framework for short positions.
-What Makes This Script Original
Unlike standard Fibonacci tools that simply draw static levels, this script:
Dynamically identifies swing highs and lows using lookback period analysis
Automatically detects and labels XABCD formation points (X, A, B, C, D) in real-time
Recognizes multiple harmonic patterns (Gartley, Butterfly, Bat, Crab, Shark) with customizable tolerance
Calculates and displays Potential Reversal Zones (PRZ) at point D
Provides integrated risk management with position sizing, stop loss, and multiple take profit levels
Identifies confluence zones where multiple Fibonacci levels intersect
Includes trend filter to validate pattern direction
Offers trading mode presets for scalpers, day traders, and swing traders
-How It Works
XABCD Pattern Detection (Bearish Version)
The script uses a bearish structure where:
Point X: The highest point (swing high) identified within the lookback period
Point A: The lowest point (swing low) that occurs after X
Point B: The retracement level from A back toward X (typically 0.382, 0.5, 0.618, or 0.786)
Point C: The projected target below B (calculated as B minus the X-A range)
Point D: The Potential Reversal Zone (PRZ) where the short position is recommended
The algorithm:
Scans the last N bars (user-defined) to find the highest point (X)
Identifies the lowest point after X (point A)
Monitors price retracement to determine point B
Projects point C and D targets based on Fibonacci extensions
Validates the formation against minimum swing size requirements
Optionally applies trend filter to confirm bearish bias
Fibonacci Levels
The script plots 14 customizable Fibonacci levels:
Retracement levels: 0.0 (X), 0.236, 0.382, 0.5, 0.618, 0.786, 1.0 (A)
Extension levels: 1.272, 1.414, 1.618, 2.0, 2.618, 3.618, 4.236
Each level is color-coded and can be individually toggled on/off. In the bearish version, these levels are calculated from the swing high (X) downward to the swing low (A) and beyond.
Harmonic Pattern Recognition
The indicator automatically detects five classic harmonic patterns when enabled:
Bearish Gartley (75% probability): B retracement at 0.618, D target at 0.786
Bearish Butterfly (70% probability): B retracement at 0.786, D target at 1.272
Bearish Bat (80% probability): B retracement at 0.382-0.5, D target at 0.886
Bearish Crab (85% probability): B retracement at 0.382-0.618, D target at 1.618
Bearish Shark (72% probability): B retracement at 0.382-0.618, D target at 1.13
Pattern detection uses a tolerance parameter (default 5%) to account for market imperfections. When a pattern is identified, it displays the pattern name and estimated success probability.
Risk Management System
The script includes a complete risk management framework:
Position Sizing: Calculates the appropriate position size based on:
Account size (user input)
Risk percentage per trade (user input)
Distance from entry to stop loss
Stop Loss: Automatically placed 0.5% above point X to protect against invalidation
Take Profit Levels:
TP1: 1.272 extension (customizable)
TP2: 1.618 extension (customizable)
TP3: 2.0 extension (customizable)
Risk/Reward Ratio: Displayed in the info panel, calculated as (Entry - TP3) / (Stop Loss - Entry)
Confluence Detection
When multiple Fibonacci levels converge within 0.5% of each other, the script highlights these zones with translucent boxes. These confluence zones often act as strong support/resistance areas and increase the probability of reversal.
Minimum confluence threshold is customizable (default: 2 levels).
Trend Filter
Optional moving average filter (default: 50-period SMA) helps validate that patterns are forming in the direction of the prevailing trend. When enabled with "Only Show Patterns in Trend Direction," the indicator will only display formations that align with a bearish trend (price below MA).
-How to Use
For Scalpers:
Select "Scalper" trading mode
Use lower timeframes (1m, 5m, 15m)
Focus on TP1 and TP2 levels
Tight stop loss above point X
For Day Traders:
Select "Day Trader" trading mode
Use medium timeframes (15m, 30m, 1H)
Target TP2 and TP3 levels
Monitor confluence zones for entry refinement
For Swing Traders:
Select "Swing Trader" trading mode
Use higher timeframes (4H, D)
Hold for TP3 or beyond
Use trend filter to confirm macro direction
Entry Strategy:
Wait for point D (PRZ) to be reached
Look for bearish confirmation (candlestick patterns, volume, momentum)
Enter short position at or near point D
Place stop loss above point X as indicated
Scale out at TP1, TP2, and TP3 levels
-Key Settings
General Settings:
Trading Mode: Presets optimized for different trading styles
Lookback Bars: Historical period for swing detection (10-200)
Min Swing Size: Minimum percentage move to validate formation (0.1-10%)
Fibonacci Levels:
Individual toggle and color customization for all 14 levels
Line thickness and style options (Solid/Dashed/Dotted)
Optional price and percentage labels
Left and right line extension
Harmonic Patterns:
Enable/disable specific pattern types
Pattern tolerance adjustment (1-15%)
Risk Management:
Account size input
Risk percentage per trade (0.5-10%)
Customizable TP level multipliers
Toggle stop loss and take profit displays
Display Options:
Show/hide XABCD lines
C target and D target (PRZ) visualization
Confluence zone highlights
Trend MA overlay
Information panel with trade statistics
Alert Settings:
Pattern completion alerts
C target hit notifications
Key Fibonacci level alerts
-Visual Features
Color-coded Fibonacci levels: Each level has a distinct color for easy identification
Dynamic XABCD lines: Yellow lines connect pattern formation points
Target projections: Magenta for C target, blue for D target (PRZ)
Risk management lines: Red for stop loss, green for take profits
Confluence boxes: Golden translucent boxes highlight key zones
Information panel: Top-right panel displays pattern type, entry, stop loss, TP3, R:R ratio, position size, and direction
Point labels: Clear X, A, B, C, D markers with hover tooltips showing exact prices
-Important Disclaimers
Risk Warning: Trading financial instruments involves substantial risk and may not be suitable for all investors. Past performance of any trading system or pattern is not necessarily indicative of future results.
No Repainting: This indicator does NOT repaint. All pattern detection and level calculations are based on confirmed price data at the close of each bar.
Backtesting Note: If used as a strategy with backtesting, ensure realistic parameters:
Use appropriate commission (0.1% or higher for most markets)
Include slippage (10+ ticks for liquid markets)
Risk no more than 2-5% of account per trade
Test on sufficient sample size (100+ trades minimum)
Manual Confirmation: This indicator is a tool to assist analysis, not a complete trading system. Always use additional confirmation from:
Price action analysis
Volume confirmation
Market context and news
Risk tolerance assessment
Harmonic Pattern Probabilities: The success rates shown (70-85%) are theoretical estimates based on historical studies and should not be interpreted as guarantees. Actual results will vary based on market conditions, execution timing, and individual risk management.
-Technical Details
Pine Script Version: v6 (latest)
Overlay: True (displays on price chart)
Maximum Objects: 500 lines, 500 labels, 500 boxes
Calculation Method: Swing high/low detection with percentage-based Fibonacci calculations
No Lookahead Bias: All calculations use confirmed historical data
Compatible Timeframes: All timeframes (1m to 1M), recommended 15m and above
-Differences from Bullish Version
This is the bearish version specifically designed for short positions:
X point is the swing HIGH (not low)
A point is the swing LOW (not high)
B retracement moves UP from A toward X
C target projects DOWN from B
D target (PRZ) is calculated ABOVE X for short entries
All Fibonacci levels are inverted for downward price movement
Pattern recognition logic adjusted for bearish structures
A companion bullish version is available separately for long position analysis.

Direction via Zone Break [by rukich]🟠 OVERVIEW
The indicator shows the direction of movement and zones: SSL, BSL, FVG.
Zones serve as support/resistance and as validation/invalidation of a movement reversal.
🟠 COMPONENTS
The direction of movement is built based on a three-candle swing high (BSL) and swing low (SSL) pattern. If swing high (BSL) and swing low (SSL) are formed, and then an internal swing high/low is formed (depending on the direction of movement), then in case the initial movement continues — for example, in an upward movement — the new swing low (SSL) will be the minimum before the update, i.e., the internal low, while the swing high (BSL) will be formed according to the three-candle pattern.
A change of direction is considered when a candle closes beyond the key swing high/low (BSL/SSL), depending on the direction of movement. For example, in an upward movement, a break occurs when a candle closes beyond the swing low (SSL). After that, the swing high (BSL) will be the nearest fractal (swing high), and the swing low (SSL) will be formed according to the three-candle pattern.
All the above logic also applies to downward movements.
Within each movement, there can be FVG zones, which can act as support/resistance or indicate weakness in the movement direction.
Note: if the movement is upward, only bullish FVG+ will be displayed; if the movement is downward, only bearish FVG- will be displayed.
Weakness of movement direction.
For example, consider an upward impulse with the nearest FVG+ zone. If the price closes beyond the lower boundary of the zone, it will be considered invalidated (inv. FVG-), which in turn indicates weakness in the movement direction and a possible local short, which may subsequently lead to a break of the entire movement.
🟠 HOW TO USE
There are only two visual settings in the configuration:
Show previous SSL/BSL – enables/disables the display of all previous SSL/BSL zones
Show Bullish/Bearish trend – enables/disables background shading between SSL and BSL for visual understanding of the movement direction
On the chart, the following are displayed:
Labels with current SSL/BSL
FVG+- / inv. FVG+- zones, for trading in the movement direction
In case the nearest FVG is invalidated, a label will appear with the text: Weak bullish/bearish & local short/long (this is not a signal, but only indicates the probability of a potential move based on the weakness of the nearest zone)
🟠 CONCLUSION
The indicator helps determine the current movement with zones for trading in the direction, and also indicates movement weakness through invalidation of the nearest zones.

S&P 500 Breadth: Bull vs Bear (20DMA)S&P 500 Breadth: Bull vs Bear (20DMA)
Use as simple market breadth