dTF50This is a customized trend filter that has several uses:
It helps identify trend direction, either bullish or bearish
It distinguishes between a pullback and a trend reversal
It helps identify areas where traders should stand aside
It highlights areas of consolidation
Cerca negli script per "bear"
OBV divergence hidden and regular on both bearish and bullish.OBV (on balance volume) divergence indicator with hidden and regular signal on both bearish and bullish.

CMYK VRMI◊ Introduction
This script indicates the relative movement of price x volume.
◊ Origin
Based on 'The Relative Momentum Index' by Roger Altman : February, 1993 issue of Technical Analysis of Stocks & Commodities magazine.
While RSI counts up and down days from close to close, the Relative Momentum Index counts up and down days from the close relative to a close x number of days ago.
This results in an RSI that is smoother. The input has been changed to the change of a smoothed close multiplied by a smoothed volume.
The polarity of VRMI indicates bearish/bullish movement.
◊ Adjustments
CMYK color theme applied.
◊ Usage
VRMI indicates the force the market moves with.
◊ Future Prospects
-
◊ ◊ ◊ ◊ ◊ ◊ ◊ ◊ ◊ ◊ ◊ ◊ ◊ ◊ ◊ ◊ ◊ ◊ ◊ ◊ ◊ ◊ ◊ ◊ ◊ ◊ ◊ ◊ ◊ ◊ ◊ ◊ ◊ ◊ ◊ ◊ ◊ ◊ ◊ ◊ ◊ ◊ ◊ ◊ ◊ ◊ ◊ ◊ ◊ ◊ ◊ ◊ ◊ ◊ ◊ ◊ ◊ ◊ ◊ ◊ ◊ ◊ ◊ ◊ ◊ ◊ ◊ ◊ ◊ ◊ ◊ ◊ ◊ ◊ ◊ ◊ ◊ ◊ ◊ ◊ ◊ ◊ ◊ ◊ ◊ ◊ ◊ ◊ ◊ ◊ ◊ ◊ ◊ ◊ ◊ ◊ ◊ ◊ ◊ ◊ ◊ ◊ ◊ ◊ ◊ ◊

CMYK VRMI RAYS ◊ Introduction
Introducing VRMI in this script, an RMI based on price movement and volume, to indicate bullish and bearish trends.
This script marks the background depending on RMI <> VRMI , VRMI polarity and large buy/sell sprees.
◊ Origin
Based on 'The Relative Momentum Index' by Roger Altman : February, 1993 issue of Technical Analysis of Stocks & Commodities magazine.
While RSI counts up and down days from close to close, the Relative Momentum Index counts up and down days from the close relative to a close x number of days ago.
This results in an RSI that is smoother.
In addition VRMI reacts quick, it is used to cut off latency from RMI, and it's polarity indicates the beginning and end of a trend.
Large buy sell sprees and detected in their proportion with an sma on the volume
◊ Adjustments
CMYK color theme applied.
◊ Usage
This indicator can be used to detect trends and mark reversals.
◊ Prospects
◊ ◊ ◊ ◊ ◊ ◊ ◊ ◊ ◊ ◊ ◊ ◊ ◊ ◊ ◊ ◊ ◊ ◊ ◊ ◊ ◊ ◊ ◊ ◊ ◊ ◊ ◊ ◊ ◊ ◊ ◊ ◊ ◊ ◊ ◊ ◊ ◊ ◊ ◊ ◊ ◊ ◊ ◊ ◊ ◊ ◊ ◊ ◊ ◊ ◊ ◊ ◊ ◊ ◊ ◊ ◊ ◊ ◊ ◊ ◊ ◊ ◊ ◊ ◊ ◊ ◊ ◊ ◊ ◊ ◊ ◊ ◊ ◊ ◊ ◊ ◊ ◊ ◊ ◊ ◊ ◊ ◊ ◊ ◊ ◊ ◊ ◊ ◊ ◊ ◊ ◊ ◊ ◊ ◊ ◊ ◊ ◊ ◊ ◊ ◊ ◊ ◊ ◊ ◊ ◊ ◊


Bullish and Bearish Engulfing Patterns auto detectionThis simple indicator detects automatically most important bullish and bearish candlestick patterns formations. Used to locate potential supply and demand imbalances.
Copyright 2017 Alfonso Moreno www.set-and-forget.com


Super Envolvente (Bullish y Bearish)Identificador de Super-envolventes (SE), se encarga de darle un color verde a la SE alzista (Bullish) verde y rojo a la bajista (Bearish).

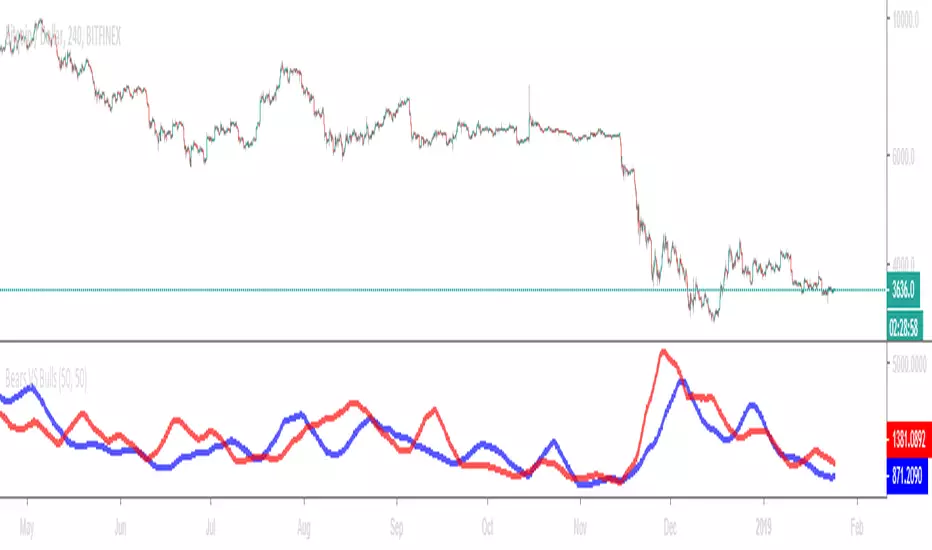
Bears VS BullsThis indicator will work on ANY instrument.
The red line is a moving average of ONLY sellers in the market.
The blue line is a moving average of ONLY buyers in the market.
The period or "length" of the individual moving averages can be adjusted in the indicator settings.
The default, it is set to 50.
Buying and selling trends often provide indications of market moves such as the most recent bottom in Cryptocurrencies.
Feel free to comment and share any indicator concepts or ideas for content you would like to see added to the Technical Indicator Bundle on www.kenzing.com
Bearish Trailing stopIt is a trailing SL. Works very well. Good good very good. Looks like my description needs more, so here is more random text.

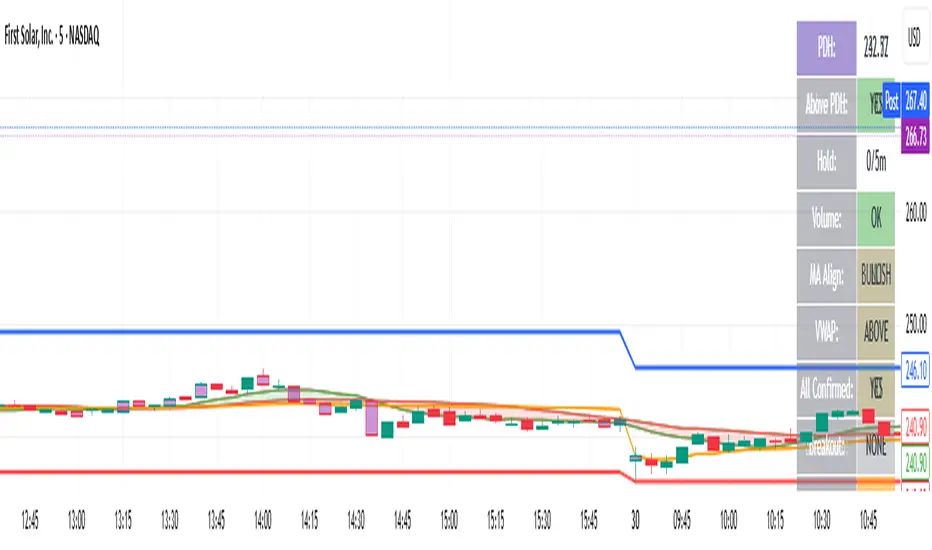
bearish Price Below PDL - Complete Multi-Confirmation Alert🎯 KEY IMPROVEMENTS:
1. Enhanced Alert Visibility:$jmoskyhigh
✅ HUGE triangle down marker with "SELL" text
✅ Alert title: "SELL SIGNAL - PDL BREAKDOWN CONFIRMED"
✅ Prominent info panel with red theme
✅ Clear "SELL ALERT: TRIGGERED" status
2. Better Visual Feedback:
Red frame around info panel
Larger shapes and markers
Color-coded confirmations (green = OK, red = FAIL)
Progress percentage displayed
Breakdown price label
3. Complete Alert System:
Main Alert: "SELL SIGNAL - PDL BREAKDOWN CONFIRMED"
Early Warning: "PDL Breakdown Started - Monitoring"
Reset Alert: "Confirmation Lost - Breakdown Reset"

Bearish signal using Point of Control (POC) with PAC by guruThis indicator code helps traders identify potential sell opportunities using several important technical indicators:
Point of Control (POC) – This is the price level where the most volume was traded over the past several days.
Previous Day's Low – This shows the lowest price reached during the previous day.
PAC (Price Action Channel) EMA – These are two moving averages (one based on the low price and one based on the close price) that help determine if the price is trending within a certain range.
Volume SMA – This is a 3-day simple moving average (SMA) of volume, which helps filter out signals based on market activity.
What the Script Does:
Point of Control (POC):
The script looks at the last 50 days (configurable) and calculates which price level had the highest trading volume.
It then plots a red line on the chart at the POC level. This is important because it helps identify areas where there was strong market interest in the past.
Volume Moving Average:
The script calculates a 3-day SMA of volume, but it excludes the current day to avoid premature signals based on today’s trading.
The volume SMA is used to ensure there’s enough market activity (with a threshold set to 25 units) before triggering a sell signal.
Price Action Channel (PAC) EMA:
The PAC consists of two exponential moving averages (EMAs):
The PAC Low EMA: This is based on the low prices over the last 34 periods (configurable).
The PAC Close EMA: This is based on the closing prices over the last 34 periods.
These EMAs help determine if the price is trending above or below certain price levels.
Sell Signal Logic: The script checks three conditions before displaying a "Sell" signal:
Price Below POC and Previous Day’s Low:
The close price must be below both the Point of Control (POC) and the previous day's low.
Volume SMA Above 25:
The 3-day volume SMA must be greater than 25. This ensures the signal only triggers when there’s enough trading volume in the market.
Today’s Low is Above PAC EMAs:
Today's low price must be above both the PAC low EMA and the PAC close EMA. This prevents sell signals when prices are already significantly below the PAC, indicating possible exhaustion in the downtrend.
If all three conditions are met, the script will display a red "Sell" label on the chart, signaling a potential selling opportunity.
No Sell Signal if Price Reverses:
If the price crosses back above the POC or the previous day's low, the script will remove the sell signal and reset for a new opportunity.
Summary of Conditions:
For the script to display a "Sell" label:
The close price must be below the Point of Control (POC) and the previous day’s low.
The 3-day volume SMA (excluding today) must be greater than 25 units.
The low price of the current day must be above both the PAC low EMA and the PAC close EMA.
If these conditions are met, a red sell label appears on the chart as a potential signal for a short (sell) trade.

Bearish FS Continuation S1BB - baby bar / inside bar
DF - downflow, meaning 20MA below 50MA
EXE - execution bar, indicator to short
Mainly to identify execution bar for shorting using inside bar identification and force top

Guneet-ScalperBearish trend candle color change to red with sell print
Bullish trend candle color change to green with buy print
thanks
jas toor

Rapid Signal Geometry (Multi-TF)Rapid Signal Geometry (RSG)
Structure-Driven Market Geometry & Signal Framework
Rapid Signal Geometry (RSG) is a structure-first trading framework designed to separate directional market geometry from entry execution .
Instead of relying on indicator crossovers or lagging confirmations, RSG evaluates price expansion, volatility boundaries, and candle geometry to determine when the market has structurally shifted.
The indicator is built for traders who prefer fewer, higher-quality signals and a clear, rule-based understanding of market direction across timeframes.
Conceptual Design (Why RSG Exists)
Most signal tools attempt to detect entries directly, which often results in:
Late signals
Repeated signals in chop
Entries taken against higher-timeframe structure
RSG addresses this by decoupling market structure from execution .
The framework operates in two coordinated layers :
• Geometry Layer – defines whether the market is structurally bullish or bearish
• Signal Layer – triggers only at the moment of a confirmed structural transition
This design reduces noise, prevents rapid repeated signals, and keeps execution aligned with actual market behavior rather than indicator coincidence.
How RSG Works (High-Level Mechanics)
1. Geometry Baseline
RSG constructs a smoothed price baseline using RMA combined with adaptive volatility (ATR or Standard Deviation).
This produces dynamic geometry bands that expand and contract with real price behavior instead of static levels.
2. Geometry Direction (Trend State)
The market is considered:
• Bullish when price closes decisively above the upper geometry band
• Bearish when price closes decisively below the lower geometry band
Once a geometry state is established, it remains active until an opposite structural condition is confirmed .
There is no trailing logic and no repainting .
3. Signal Generation
Signals are event-based, not continuous:
• A Buy signal appears only at the first bullish geometry transition
• A Sell signal appears only at the first bearish geometry transition
Signals never appear mid-trend and are designed to mark the start of a new structural leg , not continuation noise.
4. Candle Geometry Levels (Visual Guides)
On each signal candle, RSG can optionally plot:
• The candle’s 50% equilibrium level
• A wick-derived reference level
These are non-predictive visual guides intended for:
Entry refinement
Pullback assessment
Confluence with other price-based tools
Filters & Controls (How Components Work Together)
Cooldown + Re-Qualification Filter
Prevents rapid same-direction signals (“machine-gun effect”).
Within the cooldown window, a new signal is allowed only if price re-qualifies at a structurally better level .
Geometry Direction Filter
When enabled:
• Buy signals are shown only during bullish geometry
• Sell signals are shown only during bearish geometry
This allows RSG to function as a higher-timeframe bias engine while executing on lower timeframes.
Reference Timeframe Geometry
Users can select a higher timeframe to calculate geometry bias while trading on a lower timeframe.
All geometry states are derived from closed reference-timeframe candles , ensuring:
No repainting
No intrabar bias changes
How to Use RSG (Practical Workflow)
Recommended Approach
Select a higher timeframe (4H / Daily / Weekly) to define geometry bias
Trade entries on a lower timeframe (15m or 1hr or D)
Execute only in the direction shown by the geometry state
Example:
If geometry shows LONG → ignore Sell signals
If geometry shows SHORT → ignore Buy signals
Best Timeframes
• Geometry / Bias : 4H, Daily
• Execution : 15m and 1hr
RSG is timeframe-agnostic but performs best when structure and execution are separated .
Important Notes
• No repainting
• Signals are printed only after confirmed candle close
• This is a structural analysis tool, not a prediction system
• Always apply proper risk management
Who RSG Is Designed For
• Traders who prioritize structure over indicators
• Traders seeking clean, rule-based signals
• Price-action and geometry-focused traders
• Traders who prefer confirmation over frequency
Disclaimer
This script is a technical analysis tool and does not constitute financial advice. Trading involves risk. Always test on historical data and apply appropriate risk management.
Update Notes – Alert Reliability Improvement
• Alerts now trigger strictly on confirmed candle close
• Removed intrabar / forming-candle alert behavior
• Implemented forced alert() logic so alerts remain active without manual re-enable
• Signal logic and plotting behavior remain unchanged
Important:
When creating alerts, select “ Any alert() function call ”.

Entropy Divergence (No Repaint) [PhenLabs]📊 Entropy Divergence (No Repaint)
Version: PineScript™ v6
📌 Description
The Entropy Divergence Scalper (EDS) is a sophisticated trading indicator that applies information theory to market analysis. By calculating Shannon Entropy on price returns, it identifies periods when market behavior becomes more predictable and orderly—the ideal conditions for divergence-based trading.
Traditional divergence indicators generate signals regardless of market conditions, leading to many false signals during chaotic, high-entropy periods. EDS solves this by acting as an intelligent filter: it only triggers signals when entropy drops below your specified threshold, indicating that the market has entered a more structured, tradeable state.
This indicator is built with a strict non-repainting guarantee. All signals use barstate.isconfirmed and only appear after bar close, giving you reliable signals you can trust for live trading.
🚀 Points of Innovation
Shannon Entropy integration measures market randomness using information theory mathematics
Dual divergence engine detects both RSI and Volume divergences simultaneously
Entropy-filtered signals eliminate noise by only triggering in low-entropy (predictable) market conditions
100% non-repainting architecture ensures all signals are confirmed and historically accurate
Multi-layer confirmation combines entropy state, RSI divergence, and volume divergence for higher probability setups
Dynamic color visualization provides instant visual feedback on current market entropy state
🔧 Core Components
Shannon Entropy Calculator: Bins price returns into histograms and calculates entropy using H(X) = -Σ p(x) × log₂(p(x))
RSI Divergence Detector: Identifies when price makes lower lows while RSI makes higher lows (bullish) or price makes higher highs while RSI makes lower highs (bearish)
Volume Divergence Detector: Spots increasing volume interest at price lows (bullish) or decreasing conviction at price highs (bearish)
Pivot Detection System: Uses configurable lookback periods to identify and track price, RSI, and volume pivots
Signal Classification Engine: Labels signals as RSI, VOL, or RSI+VOL based on which divergences triggered
🔥 Key Features
Entropy Threshold Control: Set your preferred entropy level (default 2.5) to filter out signals during chaotic market periods
Configurable Smoothing: EMA smoothing on entropy values reduces noise while maintaining signal responsiveness
Flexible Pivot Detection: Adjust left/right lookback bars to tune sensitivity for different trading styles
Divergence Search Range: Control how far back the indicator looks for divergence patterns (20-200 bars)
Minimum Pivot Distance: Prevents false signals from pivots that are too close together
Complete Alert System: Four alert conditions for bullish signals, bearish signals, any signal, and low entropy zone entry
🎨 Visualization
Dynamic Entropy Line: Color gradient shifts from green (low entropy/tradeable) to orange (high entropy/chaotic)
Entropy Threshold Line: Dashed reference line shows your configured entropy threshold
Low Entropy Zone Fill: Background highlighting indicates when market is in tradeable low-entropy state
Scaled RSI Plot: RSI overlay scaled to fit the entropy pane for easy correlation analysis
Normalized Volume Bars: Volume displayed as columns normalized against 20-period average
Signal Labels: Clear LONG/SHORT labels with divergence type (RSI, VOL, or RSI+VOL)
Information Table: Real-time display of entropy value, state, RSI, and current signal status
📖 Usage Guidelines
Entropy Lookback Period — Default: 20, Range: 5-100 — Controls how many bars are used for entropy calculation; higher values provide smoother readings but slower response
Histogram Bins — Default: 10, Range: 5-50 — Number of bins for probability distribution; more bins provide finer granularity
Low Entropy Threshold — Default: 2.5, Range: 0.5-4.0 — Signals only trigger when entropy drops below this value; lower settings are more selective
Entropy Smoothing — Default: 3, Range: 1-10 — EMA smoothing applied to raw entropy values for noise reduction
RSI Length — Default: 14, Range: 5-50 — Standard RSI calculation period
Pivot Lookback Left — Default: 5, Range: 2-20 — Bars to the left for pivot detection
Pivot Lookback Right — Default: 2, Range: 1-10 — Bars to the right for pivot confirmation; lower values produce faster signals
Divergence Search Range — Default: 60, Range: 20-200 — Maximum bars to look back for divergence comparison
Min Bars Between Pivots — Default: 5, Range: 3-30 — Minimum distance between pivots for valid divergence detection
✅ Best Use Cases
Scalping during low-volatility consolidation periods when entropy drops and price becomes more predictable
Swing trade entry timing by waiting for divergence signals in low-entropy market conditions
Trend reversal identification when both RSI and Volume divergences align with low entropy readings
Multi-timeframe confirmation by checking entropy state on higher timeframes before taking signals
Filtering existing strategies by adding entropy as a confirmation layer to reduce false signals
⚠️ Limitations
Signals appear with a delay due to pivot confirmation requirements (pivotLookbackRight bars after pivot forms)
May generate fewer signals during strongly trending markets where entropy remains elevated
Entropy threshold requires optimization for different instruments and timeframes
Not designed for high-frequency trading due to bar-close confirmation requirement
Divergences can fail in extremely strong trends where momentum overwhelms the signal
💡 What Makes This Unique
First indicator to combine Shannon Entropy filtering with multi-factor divergence detection
Information theory approach provides mathematical foundation for identifying tradeable market states
Triple confirmation requirement (low entropy + divergence + bar close) significantly reduces false signals
Non-repainting guarantee makes it suitable for strategy backtesting and live trading
Open-source PineScript v6 code allows traders to understand and customize the methodology
🔬 How It Works
Step 1 — Entropy Calculation: The indicator calculates logarithmic returns, bins them into a histogram, and computes Shannon Entropy to measure market randomness
Step 2 — Entropy Filtering: When smoothed entropy drops below the threshold, the market is considered to be in a tradeable low-entropy state
Step 3 — Pivot Detection: The system continuously tracks price, RSI, and volume pivots using configurable lookback parameters
Step 4 — Divergence Analysis: When a new pivot is confirmed, the indicator compares it against previous pivots to detect bullish or bearish divergences
Step 5 — Signal Generation: A final signal only triggers when low entropy conditions coincide with a confirmed divergence pattern on a closed bar
💡 Note:
This indicator is designed for educational purposes and technical analysis. Always use proper risk management and never risk more than you can afford to lose. The non-repainting guarantee means signals will only appear after bar close—watch the indicator in real-time to verify this behavior. For optimal results, consider combining EDS signals with support/resistance levels and overall market context.

Dynamic Trend-Based Fibonacci Extension💡 This indicator is a sophisticated, automated technical analysis tool designed to identify high-probability trend continuation setups using the principles of market structure and Fibonacci geometry. By algorithmically detecting "A-B-C" price structures (Pivot -> Impulse -> Retracement), it projects dynamic Fibonacci Extension levels to forecast potential price targets for the next impulsive move (Wave C to D). Unlike static drawing tools, this script adapts to market volatility and features an advanced invalidation engine to keep your charts clean and your risk managed.
✨ Originality and Utility
Traders often struggle with the subjectivity of drawing Fibonacci extensions manually. This script solves that by standardizing the identification of market structure using a proprietary ZigZag algorithm enhanced with Average True Range (ATR) for volatility-adjusted sensitivity.
Key unique features include:
Automated Structure Detection: Instantly spots Bullish (Higher High, Higher Low) and Bearish (Lower Low, Lower High) sequences without manual input.
Dynamic Invalidation: The script monitors price action in real-time. If price breaks the invalidation point (Point A), the structure is immediately "grayed out" or deleted, preventing you from trading based on broken setups.
Golden Zone Targeting: Highlights the high-probability reversal zone between the 1.5 and 1.618 extensions, often associated with the completion of a measured move.
JSON Alerting: Built-in support for algorithmic trading with structured JSON payloads (Entry, TP, SL) ready for webhook integration.
🔬 Methodology and Concepts
The core logic operates on a three-step algorithmic sequence:
1. Pivot Identification: The script uses a "ZigZag" approach to find significant swing highs and lows. It employs an ATR-based threshold (or fixed deviation) to filter out market noise, ensuring only significant structural points are considered.
2. Geometric Validation: It evaluates the last three pivot points (A, B, C) to confirm a valid trend structure.
Bullish Setup: Point C must be higher than Point A but lower than Point B (a valid retracement).
Bearish Setup: Point C must be lower than Point A but higher than Point B.
3. Projection Mathematics: Once a valid ABC structure is locked, the script calculates extension targets using the standard formula: Target = Price C + ((Price B - Price A) * Ratio) . It also supports Logarithmic Scale calculations for assets with exponential growth, such as cryptocurrencies, ensuring proportional accuracy over large price ranges.
🎨 Visual Guide
The indicator paints a clear, detailed roadmap on your chart. Here is how to interpret the visual elements:
● Structure Lines
Solid Line (A to B): Represents the initial "Impulse" leg of the move.
Dashed Line (B to C): Represents the "Retracement" or corrective leg.
Green Structures: Indicate Bullish setups (looking for long entries).
Red Structures: Indicate Bearish setups (looking for short entries).
Gray/Dimmed Structures: These are invalidated setups where the price has breached the Stop Loss level (Point A).
● Extension Levels (Targets)
The script projects the following key Fibonacci ratios extending from Point C:
0.618 (Wave 5): An early profit-taking level, often corresponding to a truncated 5th wave.
1.0 (Measured Move): Where the extension equals the length of the initial impulse (AB = CD pattern).
1.272 (Harmonic): A common extension level for corrective structures or deep pullbacks.
Golden Zone (1.5 - 1.618): A highlighted fill area. The 1.618 level (Solid Line) is the "Golden Ratio" and is statistically one of the most significant targets in trending markets, often labeled as "Wave 3".
● Labels
Points A, B, C: Clearly marks the swing points defining the structure.
Right-Side Labels: Display the Ratio (e.g., 1.618) and the exact Price Level for easy order placement.
📖 How to Use
This tool is best used as a trend-following system.
1. Trend Identification
Wait for a new Solid Colored Structure (Green or Red) to appear. This confirms that a valid ABC retracement has occurred.
2. Entry Strategy
The "Trigger" is generally the reversal from Point C. Aggressive traders enter near C, while conservative traders may wait for a breakout above B.
Stop Loss: Place your SL just beyond Point A . If price breaks A, the script will automatically gray out the structure, signaling invalidation.
3. Profit Taking
Use the projected extension lines as dynamic Take Profit (TP) zones:
TP1: 1.0 (The Measured Move).
TP2: The Golden Zone (1.5 to 1.618). This is often the strongest target for a Wave 3 impulsive move.
4. Automation
For automated traders, create an alert using the "Any alert() function call" option. The script outputs a JSON string containing the Action, Ticker, Entry Price, TP (1.618), and SL (Point A).
⚙️ Inputs and Settings
You can fully customize the script to fit your asset class and timeframe:
● ZigZag Detection
Pivot Lookback Depth: (Default: 5) Determines how many bars to check left/right for a pivot. Higher numbers find larger, more significant structures.
Use ATR-Based Threshold: (Default: True) Adapts the sensitivity to market volatility.
ATR Multiplier: (Default: 2.0) Adjusts how much price must reverse to form a new leg.
● Structure Invalidation
Enable Structure Invalidation: (Default: True) Toggles the logic that checks if Point A is breached.
Invalidation Action: Choose "Gray Out" to keep history visible but dimmed, or "Delete" to remove failed setups entirely.
● Fibonacci Settings
Use Logarithmic Scale: Essential for crypto or long-term timeframe analysis.
Show 0.618 / 1.0 / 1.272 / 1.618: Toggles individual levels on/off to declutter the chart.
Extend Lines Right: Extends the target lines into the future for better visibility.
● Display Settings
Keep Last N Structures: Controls how many historical structures remain on the chart to prevent visual clutter.
Show Elliott Wave Labels: Adds theoretical wave counts (e.g., "Wave 3") to the ratio labels.
🔍 Deconstruction of the Underlying Scientific and Academic Framework
This indicator is grounded in Fractal Market Geometry and Elliott Wave Theory .
1. The Golden Ratio (Phi - 1.618):
Mathematically derived from the Fibonacci sequence, the 1.618 ratio is omnipresent in natural growth patterns. In financial markets, it represents the psychological "tipping point" of crowd behavior during an impulsive trend. This script emphasizes the 1.618 extension as the primary target for a "Wave 3," which is academically cited as typically the longest and strongest wave in a 5-wave motive sequence.
2. Harmonic AB=CD Patterns:
The inclusion of the 1.0 extension validates the "Measured Move" concept. Statistically, markets often move in symmetrical legs where the secondary impulse (CD) equals the magnitude of the primary impulse (AB).
3. Volatility Normalization (ATR):
By utilizing the Average True Range (ATR) for pivot detection, the script adheres to statistical volatility normalization. This ensures that the structures identified are statistically significant relative to the asset's current volatility regime, rather than relying on arbitrary percentage moves which fail across different asset classes.
⚠️ Disclaimer
All provided scripts and indicators are strictly for educational exploration and must not be interpreted as financial advice or a recommendation to execute trades. I expressly disclaim all liability for any financial losses or damages that may result, directly or indirectly, from the reliance on or application of these tools. Market participation carries inherent risk where past performance never guarantees future returns, leaving all investment decisions and due diligence solely at your own discretion.

MightyRSIMightyRSI by 10xTrading
MightyRSI is a professional-grade oscillator designed to turn market context into a single, readable 0–100 score (“xScore”) with an optional compact HUD. It blends mean-reversion, momentum/extension, price action positioning, and flow/volume context, then adds a confirmed structure layer (divergences + sweeps) to highlight when conditions become unusually meaningful.
This script is built for clean decision support: one normalized scale, clear zones, and optional confirmation layers — without requiring a chart full of indicators.
- Core concept: the xScore (0–100)
0 = strongly oversold / BUY area
100 = strongly overbought / SELL area
- Default zones:
Buy Zone: 25 and below
Sell Zone: 75 and above
The score is smoothed (T3/HMA/EMA options) to reduce noise and improve readability.
Structure layer (confirmed context, not hype)
MightyRSI includes a Structure Engine to provide context around potential tops/bottoms:
What it detects
- Confirmed divergences using up to three sources:
xScore divergence
RSI divergence
MACD histogram divergence
Liquidity sweeps (SFP-style) around confirmed pivots (sweep-and-reclaim behavior)
- What you see
Struct (Bull/Bear): direction of the most recent confirmed structure event
Impact (0–100): how strongly structure is currently influencing the xScore
Higher = structure bias has more weight right now
Lower = structure influence is near zero
These are meant as context enhancers, not standalone “signals”.
Confidence (0–100): market condition quality filter
A separate Confidence value summarizes “how clean” current conditions are (trend/range clarity, volatility environment, alignment).
Higher Confidence generally means cleaner conditions
Lower Confidence means choppier/noisier conditions
Confidence is displayed in the HUD and can optionally gate structure influence.
- HUD: compact decision panel
The optional HUD is designed for fast reading and consistent workflow. It shows:
xScore + label (BUY / NEUTRAL / SELL)
Struct (Bull/Bear/None)
Impact (0–100)
Confidence (0–100)
3 RSI values from higher timeframes (via the Timeframe Matrix)
MTF RSI Timeframe Matrix (power feature, safe by design)
The RSI Timeframe Matrix lets you map your chart timeframe to 3 additional RSI timeframes shown in the HUD.
- Basic RSI Add-on (optional)
If you prefer classic RSI on top of the xScore framework:
Optional Basic RSI line
Optional RSI moving average
Optional right-side value label with background color matching your RSI color thresholds
- Alerts (non-spam, bar-close stable)
Built-in alerts for:
xScore crossing into Buy/Sell zones
Strong conditions when a zone cross occurs shortly after a confirmed structure event
- Non-repainting option
You can toggle Non-repainting (bar close):
OFF (default): live updating for discretionary use
ON: updates only after bar close for maximum stability
- Recommended use
Works on all markets (crypto, forex, indices, equities)
Default tuning is especially comfortable on higher timeframes (4H and above)
For lower timeframes, consider adjusting smoothing and structure sensitivity to match volatility/noise.
- Disclaimer
This indicator is provided for educational and informational purposes only and does not constitute financial advice. Trading involves risk. Always test on your own charts, validate with your own process, and use appropriate risk management. Past performance is not indicative of future results.

Renko Brick Color Change AlertThis indicator detects Renko brick color flips (bullish ↔ bearish) on native Renko charts, including ATR-based Renko.
🔹 Highlights bullish and bearish bricks
🔹 Plots visual flip markers
🔹 Triggers alerts when brick color changes
Usage:
Apply this indicator on a Renko chart (traditional or ATR Renko). Alerts fire only when a confirmed brick flips direction.
Ideal for traders monitoring momentum shifts and trend reversals using Renko structures.

Advanced Buy Sell Reversal Trend ver 1 by S B PrasadDynamic Support & Resistance Logic
In Advanced Buy Sell Reversal Trend by S B Prasad (Upgraded Version), the blue Sigmoid-smoothed trend line functions as a dynamic support and resistance zone, not as a traditional moving average.
It represents price acceptance and rejection, making it a critical decision level rather than a lagging indicator.
🔍 How the Blue Line Behaves in Real Market Conditions
🔹 1. Weak Candles Near the Blue Line (Rejection Phase)
When:
Multiple small-bodied or weak candles approach the blue line
Price fails repeatedly to close above (or below) it
The blue line acts as strong dynamic support or resistance.
This usually indicates:
Lack of momentum
Absorption by stronger market participants
Market hesitation and indecision
📉 Result:
Price often respects the blue line and reverses.
🔹 2. Strong Candle Break & Close (Acceptance Phase – Key Behavior)
When:
A single strong candle
With a large real body
Decisively closes above or below the blue line
And does so in one move (without hesitation)
This signals:
Momentum dominance
Acceptance beyond dynamic support/resistance
A shift in control (buyers or sellers)
📈 Result:
Price typically continues moving in the breakout direction.
🧠 Why This Works
The Sigmoid Trend Line:
Is smoothed to eliminate noise
Reacts only to meaningful price shifts
Filters out weak and indecisive price action
Therefore:
❌ Weak / small candles → rejection
✅ Strong candle close → acceptance
This is why the blue line behaves like a professional-grade dynamic support & resistance, not a lagging moving average.
🚀 Advanced Buy Sell Reversal Trend – Upgraded Version
What Stayed the Same & What Improved
This upgraded version is a logical evolution of the earlier Advanced Buy Sell Reversal Trend.
The core philosophy remains intact, while discipline, structure, and trade management are significantly improved.
🔁 What Remains the Same (Core Strengths Preserved)
🟥🟩 PMR Ribbon (Present in Both Versions)
Exists in both original and upgraded versions
Uses FastLine & SlowLine smoothing
Color logic unchanged:
Green → bullish momentum
Red → bearish momentum
Acts as a trend bias & momentum filter
Ribbon fill logic restored exactly as Version-1 (with improved visibility)
👉 Existing users will experience continuity and familiarity.
📐 ATR-Based Dynamic Channel
Volatility-adaptive channel used for:
Trend direction
Near-miss detection
Reversal validation
Channel lines & fill remain optional
Core logic unchanged from earlier version
🟣 UW MA – Volatility Adaptive Hull MA
Present in both versions
Confirms trend strength and direction
Acts as dynamic support / resistance
Most effective when aligned with Ribbon + Signals
🚀 What Is New & Improved in the Upgraded Version
🔹 1. Structured Trade Cycle Logic (Major Upgrade)
The earlier indicator focused mainly on BUY / SALE signals.
The upgraded version introduces a complete trade lifecycle:
BUY / SALE → EXIT → Fresh Buy / Fresh Sale → Cycle Complete
This:
Prevents repeated signals in the same trend
Reduces over-trading
Adds discipline and patience to execution
🔹 2. Intelligent EXIT Signal (New)
EXIT generated using EMA neutral compression
Indicates:
Momentum loss
Trend pause
Consolidation phase
EXIT label is:
Bold text only
No box, no shading
Positioned logically above/below candle
👉 EXIT logic did not exist in the earlier indicator.
🔹 3. Fresh Buy & Fresh Sale Entries (New)
Allowed only after a confirmed EXIT
One fresh entry per trade cycle
Automatically locked after use
Ideal for:
Pullback entries
Trend continuation without chasing price
🔹 4. Improved Signal Quality (Anti-Spam Filters)
Compared to the earlier version, the upgraded version adds:
ATR-based candle body strength validation
Distance-from-channel filtering
Near-miss candle logic
Trend flip + reclaim confirmation
👉 Result:
Fewer signals, but much higher quality.
🔹 5. Enhanced Use of the Sigmoid Trend Line
Blue line actively used as dynamic S/R
Weak candles failing near it → rejection
Strong candle closing across it → acceptance & directional move
This behavior is integrated into trade logic, not just visual guidance.
🎨 Visual & Usability Improvements
Cleaner charts than the earlier version
No colored boxes
Minimal labels
Arrows close to candles, text clearly placed
Default view focuses on:
PMR Ribbon
UW MA
Everything else remains optional
🧠 Summary – Earlier vs Upgraded Version
Aspect Earlier Version Upgraded Version
PMR Ribbon ✔ Present ✔ Restored & refined
BUY / SALE Signals ✔ ✔ Cleaner & rarer
EXIT Logic ❌ ✔ New
Fresh Entries ❌ ✔ New
Trade Cycle Control ❌ ✔ Structured
Signal Discipline Medium High
Chart Cleanliness Good Excellent
📲 WhatsApp Group – Purpose & Ethics
This WhatsApp group is created purely for learning and mutual benefit.
❌ No paid tips
❌ No calls or recommendations
❌ No courses, services, or money-related activity
The group exists only to:
Share trading experiences
Discuss strategies and observations
Learn from each other’s market behavior
Improve discipline and understanding together
🔹 No one here is a teacher or mentor
🔹 Everyone is a learner and participant
Markets behave differently for everyone.
The goal is discussion and understanding, not blind following.
👉 Join the WhatsApp group:
chat.whatsapp.com
⚠️ Disclaimer:
This indicator and all discussions are for educational purposes only. Trading involves risk. Always use proper risk management and independent judgment.
