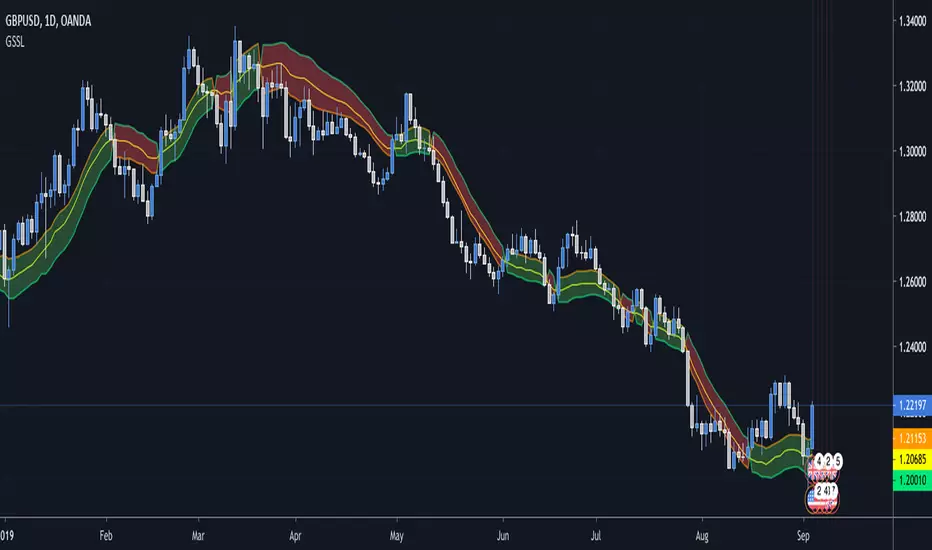
Average Down [Zeiierman]AVERAGING DOWN
Averaging down is an investment strategy that involves buying additional contracts of an asset when the price drops. This way, the investor increases the size of their position at discounted prices. The averaging down strategy is highly debated among traders and investors because it can either lead to huge losses or great returns. Nevertheless, averaging down is often used and favored by long-term investors and contrarian traders. With careful/proper risk management, averaging down can cover losses and magnify the returns when the asset rebounds. However, the main concern for a trader is that it can be hard to identify the difference between a pullback or the start of a new trend.
HOW DOES IT WORK
Averaging down is a method to lower the average price at which the investor buys an asset. A lower average price can help investors come back to break even quicker and, if the price continues to rise, get an even bigger upside and thus increase the total profit from the trade. For example, We buy 100 shares at $60 per share, a total investment of $6000, and then the asset drops to $40 per share; in order to come back to break even, the price has to go up 50%. (($60/$40) - 1)*100 = 50%.
The power of Averaging down comes into play if the investor buys additional shares at a lower price, like another 100 shares at $40 per share; the total investment is ($6000+$4000 = $10000). The average price for the investment is now $50. (($60 x 100) + ($40 x 100))/200; in order to get back to break even, the price has to rise 25% ($50/$40)-1)*100 = 25%, and if the price continues up to $60 per share, the investor can secure a profit at 16%. So by averaging down, investors and traders can cover the losses easier and potentially have more profit to secure at the end.
THE AVERAGE DOWN TRADINGVIEW TOOL
This script/indicator/trading tool helps traders and investors to get the average price of their position. The tool works for Long and Short and displays the entry price, average price, and the PnL in points.
HOW TO USE
Use the tool to calculate the average price of your long or short position in any market and timeframe.
Get the current PnL for the investment and keep track of your entry prices.
APPLY TO CHART
When you apply the tool on the chart, you have to select five entry points, and within the setting panel, you can choose how many of these five entry points are active and how many contracts each entry has. Then, the tool will display your average price based on the entries and the number of contracts used at each price level.
LONG
Set your entries and the number of contracts at each price level. The indicator will then display all your long entries and at what price you will break even. The entry line changes color based on if the entry is in profit or loss.
SHORT
Set your entries and the number of contracts at each price level. The indicator will then display all your short entries and at what price you will break even. The entry line changes color based on if the entry is in profit or loss.
-----------------
Disclaimer
Copyright by Zeiierman.
The information contained in my Scripts/Indicators/Ideas/Algos/Systems does not constitute financial advice or a solicitation to buy or sell any securities of any type. I will not accept liability for any loss or damage, including without limitation any loss of profit, which may arise directly or indirectly from the use of or reliance on such information.
All investments involve risk, and the past performance of a security, industry, sector, market, financial product, trading strategy, backtest, or individual’s trading does not guarantee future results or returns. Investors are fully responsible for any investment decisions they make. Such decisions should be based solely on an evaluation of their financial circumstances, investment objectives, risk tolerance, and liquidity needs.
My Scripts/Indicators/Ideas/Algos/Systems are only for educational purposes!
Cerca negli script per "entry"
Indicators Combination Framework v3 IND [DTU]Hello All,
This script is a framework to analyze and see the results by combine selected indicators for (long, short, longexit, shortexit) conditions.
I was designed this for beginners and users to facilitate to see effects of the technical indicators combinations on the chart WITH NO CODE
You can improve your strategies according the results of this system by connecting the framework to a strategy framework/template such as Pinecoder, Benson, daveatt or custom.
This is enhanced version of my previous indicator "Indicators & Conditions Test Framework "
Currently there are 93 indicators (23 newly added) connected over library. You can also import an External Indicator or add Custom indicator (In the source)
It is possible to change it from Indicator to strategy (simple one) by just remarking strategy parts in the source code and see real time profit of your combinations
Feel free to change or use it in your source
Special thanks goes to Pine wizards: Trading view (built-in Indicators), @Rodrigo, @midtownsk8rguy, @Lazybear, @Daveatt and others for their open source codes and contributions
SIMPLE USAGE
1. SETTING: Show Alerts= True (To see your entries and Exists)
2. Define your Indicators (ex: INDICATOR1: ema(close,14), INDICATOR2: ema(close,21), INDICATOR3: ema(close,200)
3. Define Your Combinations for long & Short Conditions
a. For Long: (INDICATOR1 crossover INDICATOR2) AND (INDICATOR3 < close)
b. For Short: (INDICATOR1 crossunder INDICATOR2) AND (INDICATOR3 > close)
4. Select Strategy/template (Import strategy to chart) that you export your signals from the list
5. Analyze the best profit by changing Indicators values
SOME INDICATORS DETAILS
Each Indicator includes:
- Factorization : Converting the selected indicator to Double, triple Quadruple such as EMA to DEMA, TEMA QEMA
- Log : Simple or log10 can be used for calculation on function entries
- Plot Type : You can overlay the indicator on the chart (such ema) or you can use stochastic/Percentrank approach to display in the variable hlines range
- Extended Parametes : You can use default parameters or you can use extended (P1,P2) parameters regarding to indicator type and your choice
- Color : You can define indicator color and line properties
- Smooth : you can enable swma smooth
- indicators : you can select one of the 93 function like ema(),rsi().. to define your indicator
- Source : you can select from already defined indicators (IND1-4), External Indicator (EXT), Custom Indicator (CUST), and other sources (close, open...)
CONDITION DETAILS
- There are are 4 type of conditions, long entry, short entry, long exit, short exit.
- Each condition are built up from 4 combinations that joined with "AND" & "OR" operators
- You can see the results by enabling show alerts check box
- If you only wants to enter long entry and long exit, just fill these conditions
- If "close on opposite" checkbox selected on settings, long entry will be closed on short entry and vice versa
COMBINATIONS DETAILS
- There are 4 combinations that joined with "AND" & "OR" operators for each condition
- combinations are built up from compare 1st entry with 2nd one by using operator
- 1st and 2nd entries includes already defined indicators (IND1-5), External Indicator (EXT), Custom Indicator (CUST), and other sources (close, open...)
- Operators are comparison values such as >,<, crossover,...
- 2nd entry include "VALUE" parameter that will use to compare 1st indicator with value area
- If 2nd indicator selected different than "VALUE", value are will mean previous value of the selection. (ex: value area= 2, 2nd entry=close, means close )
- Selecting "NONE" for the 1st entry will disable calculation of current and following combinations
JOINS DETAILS
- Each combination will join wiht the following one with the JOIN (AND, OR) operator (if the following one is not equal "NONE")
CUSTOM INDICATOR
- Custom Indicator defines harcoded in the source code.
- You can call it with "CUST" in the Indicator definition source or combination entries source
- You can change or implement your custom indicator by updating the source code
EXTERNAL INDICATOR
- You can import an external indicator by selecting it from the ext source.
- External Indicator should be already imported to the chart and it have an plot function to output its signal
EXPORTING SIGNAL
- You can export your result to an already defined strategy template such as Pine coders, Benson, Daveatt Strategy templates
- Or you can define your custom export for other future strategy templates
ALERTS
- By enabling show alerts checkbox, you can see long entry exits on the bottom, and short entry exits aon the top of the chart
ADDITIONAL INFO
- You can see all off the inputs descriptions in the tooltips. (You can also see the previous version for details)
- Availability to set start, end dates
- Minimize repainting by using security function options (Secure, Semi Secure, Repaint)
- Availability of use timeframes
-
Version 3 INDICATORS LIST (More to be added):
▼▼▼ OVERLAY INDICATORS ▼▼▼
alma(src,len,offset=0.85,sigma=6).-------Arnaud Legoux Moving Average
ama(src,len,fast=14,slow=100).-----------Adjusted Moving Average
accdist().-------------------------------Accumulation/distribution index.
cma(src,len).----------------------------Corrective Moving average
dema(src,len).---------------------------Double EMA (Same as EMA with 2 factor)
ema(src,len).----------------------------Exponential Moving Average
gmma(src,len).---------------------------Geometric Mean Moving Average
highest(src,len).------------------------Highest value for a given number of bars back.
hl2ma(src,len).--------------------------higest lowest moving average
hma(src,len).----------------------------Hull Moving Average.
lagAdapt(src,len,perclen=5,fperc=50).----Ehlers Adaptive Laguerre filter
lagAdaptV(src,len,perclen=5,fperc=50).---Ehlers Adaptive Laguerre filter variation
laguerre(src,len).-----------------------Ehlers Laguerre filter
lesrcp(src,len).-------------------------lowest exponential esrcpanding moving line
lexp(src,len).---------------------------lowest exponential expanding moving line
linreg(src,len,loffset=1).---------------Linear regression
lowest(src,len).-------------------------Lovest value for a given number of bars back.
mcginley(src, len.-----------------------McGinley Dynamic adjusts for market speed shifts, which sets it apart from other moving averages, in addition to providing clear moving average lines
percntl(src,len).------------------------percentile nearest rank. Calculates percentile using method of Nearest Rank.
percntli(src,len).-----------------------percentile linear interpolation. Calculates percentile using method of linear interpolation between the two nearest ranks.
previous(src,len).-----------------------Previous n (len) value of the source
pivothigh(src,BarsLeft=len,BarsRight=2).-Previous pivot high. src=src, BarsLeft=len, BarsRight=p1=2
pivotlow(src,BarsLeft=len,BarsRight=2).--Previous pivot low. src=src, BarsLeft=len, BarsRight=p1=2
rema(src,len).---------------------------Range EMA (REMA)
rma(src,len).----------------------------Moving average used in RSI. It is the exponentially weighted moving average with alpha = 1 / length.
sar(start=len, inc=0.02, max=0.02).------Parabolic SAR (parabolic stop and reverse) is a method to find potential reversals in the market price direction of traded goods.start=len, inc=p1, max=p2. ex: sar(0.02, 0.02, 0.02)
sma(src,len).----------------------------Smoothed Moving Average
smma(src,len).---------------------------Smoothed Moving Average
super2(src,len).-------------------------Ehlers super smoother, 2 pole
super3(src,len).-------------------------Ehlers super smoother, 3 pole
supertrend(src,len,period=3).------------Supertrend indicator
swma(src,len).---------------------------Sine-Weighted Moving Average
tema(src,len).---------------------------Triple EMA (Same as EMA with 3 factor)
tma(src,len).----------------------------Triangular Moving Average
vida(src,len).---------------------------Variable Index Dynamic Average
vwma(src,len).---------------------------Volume Weigted Moving Average
volstop(src,len,atrfactor=2).------------Volatility Stop is a technical indicator that is used by traders to help place effective stop-losses. atrfactor=p1
wma(src,len).----------------------------Weigted Moving Average
vwap(src_).------------------------------Volume Weighted Average Price (VWAP) is used to measure the average price weighted by volume
▼▼▼ NON OVERLAY INDICATORS ▼▼
adx(dilen=len, adxlen=14, adxtype=0).----adx. The Average Directional Index (ADX) is a used to determine the strength of a trend. len=>dilen, p1=adxlen (default=14), p2=adxtype 0:ADX, 1:+DI, 2:-DI (def:0)
angle(src,len).--------------------------angle of the series (Use its Input as another indicator output)
aroon(len,dir=0).------------------------aroon indicator. Aroons major function is to identify new trends as they happen.p1 = dir: 0=mid (default), 1=upper, 2=lower
atr(src,len).----------------------------average true range. RMA of true range.
awesome(fast=len=5,slow=34,type=0).------Awesome Oscilator is an indicator used to measure market momentum. defaults : fast=len= 5, p1=slow=34, p2=type: 0=Awesome, 1=difference
bbr(src,len,mult=1).---------------------bollinger %%
bbw(src,len,mult=2).---------------------Bollinger Bands Width. The Bollinger Band Width is the difference between the upper and the lower Bollinger Bands divided by the middle band.
cci(src,len).----------------------------commodity channel index
cctbbo(src,len).-------------------------CCT Bollinger Band Oscilator
change(src,len).-------------------------A.K.A. Momentum. Difference between current value and previous, source - source . is most commonly referred to as a rate and measures the acceleration of the price and/or volume of a security
cmf(len=20).-----------------------------Chaikin Money Flow Indicator used to measure Money Flow Volume over a set period of time. Default use is len=20
cmo(src,len).----------------------------Chande Momentum Oscillator. Calculates the difference between the sum of recent gains and the sum of recent losses and then divides the result by the sum of all price movement over the same period.
cog(src,len).----------------------------The cog (center of gravity) is an indicator based on statistics and the Fibonacci golden ratio.
copcurve(src,len).-----------------------Coppock Curve. was originally developed by Edwin Sedge Coppock (Barrons Magazine, October 1962).
correl(src,len).-------------------------Correlation coefficient. Describes the degree to which two series tend to deviate from their ta.sma values.
count(src,len).--------------------------green avg - red avg
cti(src,len).----------------------------Ehler s Correlation Trend Indicator by
dev(src,len).----------------------------ta.dev() Measure of difference between the series and its ta.sma
dpo(len).--------------------------------Detrended Price OScilator is used to remove trend from price.
efi(len).--------------------------------Elders Force Index (EFI) measures the power behind a price movement using price and volume.
eom(len=14,div=10000).-------------------Ease of Movement.It is designed to measure the relationship between price and volume.p1 = div: 10000= (default)
falling(src,len).------------------------ta.falling() Test if the `source` series is now falling for `length` bars long. (Use its Input as another indicator output)
fisher(len).-----------------------------Fisher Transform is a technical indicator that converts price to Gaussian normal distribution and signals when prices move significantly by referencing recent price data
histvol(len).----------------------------Historical volatility is a statistical measure used to analyze the general dispersion of security or market index returns for a specified period of time.
kcr(src,len,mult=2).---------------------Keltner Channels Range
kcw(src,len,mult=2).---------------------ta.kcw(). Keltner Channels Width. The Keltner Channels Width is the difference between the upper and the lower Keltner Channels divided by the middle channel.
klinger(type=len).-----------------------Klinger oscillator aims to identify money flow’s long-term trend. type=len: 0:Oscilator 1:signal
macd(src,len).---------------------------MACD (Moving Average Convergence/Divergence)
mfi(src,len).----------------------------Money Flow Index s a tool used for measuring buying and selling pressure
msi(len=10).-----------------------------Mass Index (def=10) is used to examine the differences between high and low stock prices over a specific period of time
nvi().-----------------------------------Negative Volume Index
obv().-----------------------------------On Balance Volume
pvi().-----------------------------------Positive Volume Index
pvt().-----------------------------------Price Volume Trend
ranges(src,upper=len, lower=-5).---------ranges of the source. src=src, upper=len, v1:lower=upper . returns: -1 source=upper otherwise 0
rising(src,len).-------------------------ta.rising() Test if the `source` series is now rising for `length` bars long. (Use its Input as another indicator output)
roc(src,len).----------------------------Rate of Change
rsi(src,len).----------------------------Relative strength Index
rvi(src,len).----------------------------The Relative Volatility Index (RVI) is calculated much like the RSI, although it uses high and low price standard deviation instead of the RSI’s method of absolute change in price.
smi_osc(src,len,fast=5, slow=34).--------smi Oscillator
smi_sig(src,len,fast=5, slow=34).--------smi Signal
stc(src,len,fast=23,slow=50).------------Schaff Trend Cycle (STC) detects up and down trends long before the MACD. Code imported from
stdev(src,len).--------------------------Standart deviation
trix(src,len) .--------------------------the rate of change of a triple exponentially smoothed moving average.
tsi(src,len).----------------------------The True Strength Index indicator is a momentum oscillator designed to detect, confirm or visualize the strength of a trend.
ultimateOsc(len.-------------------------Ultimate Oscillator indicator (UO) indicator is a technical analysis tool used to measure momentum across three varying timeframes
variance(src,len).-----------------------ta.variance(). Variance is the expectation of the squared deviation of a series from its mean (ta.sma), and it informally measures how far a set of numbers are spread out from their mean.
willprc(src,len).------------------------Williams %R
wad().-----------------------------------Williams Accumulation/Distribution.
wvad().----------------------------------Williams Variable Accumulation/Distribution.
HISTORY
v3.01
ADD: 23 new indicators added to indicators list from the library. Current Total number of Indicators are 93. (to be continued to adding)
ADD: 2 more Parameters (P1,P2) for indicator calculation added. Par:(Use Defaults) uses only indicator(Source, Length) with library's default parameters. Par:(Use Extra Parameters P1,P2) use indicator(Source,Length,p1,p2) with additional parameters if indicator needs.
ADD: log calculation (simple, log10) option added on indicator function entries
ADD: New Output Signals added for compatibility on exporting condition signals to different Strategy templates.
ADD: Alerts Added according to conditions results
UPD: Indicator source inputs now display with indicators descriptions
UPD: Most off the source code rearranged and some functions moved to the new library. Now system work like a little bit frontend/backend
UPD: Performance improvement made on factorization and other source code
UPD: Input GUI rearranged
UPD: Tooltips corrected
REM: Extended indicators removed
UPD: IND1-IND4 added to indicator data source. Now it is possible to create new indicators with the previously defined indicators value. ex: IND1=ema(close,14) and IND2=rsi(IND1,20) means IND2=rsi(ema(close,14),20)
UPD: Custom Indicator (CUST) added to indicator data source and Combination Indicator source.
UPD: Volume added to indicator data source and Combination Indicator source.
REM: Custom indicators removed and only one custom indicator left
REM: Plot Type "Org. Range (-1,1)" removed
UPD: angle, rising, falling type operators moved to indicator library
Volume Based Ichimoku CloudIntroduction
This release focuses primarily on a volume-based Donchian. For some time I was looking for a volume-based Donchian, not finding anything that satisfied me I tried to apply one, and then I applied it to Ichimoku.
I found advantages especially in the lateralization phase, where the integration with the volume filters some false signals.
I have added some features:
- Check the conditions of buy/sell of classic Ichimoku
- Verified reverse buy/sell condition
- Alerts
- Entrance package
- possibility to choose the type of Donchian to use (classic, volume-based)
Settings
There are the classic parameters of Ichimoku, for scalping, I use setting like(6-17-34-17 or 5-14-28-14), the new parameters are:
Donchian Type : Classic / Volume Based
Show Condition : it shows green/red square on the bottom when all the conditions of Ichimoku are satisfied, without the checkmark the inputs or the alarms will not work for this type of signal
Show Reversal : it shows yellow/purple triangle on the bottom when all during short/long state condition of Ichimoku Tenkan cross the Kijun, without the checkmark the inputs or the alarms will not work for this type of signal
Trades Framework
Show Trade Lines : show the lines for Entry Point, TP1, TP2, SL
Per n Bars : For how many bars the sending lines will be drawn
Enter Gap : It's the gap, in percentage, from the last candle low/high. For example, the entry point will be set 0.1% higher than the last high of the candle, in a long situation, or 0.1% lower than the last low of the candle in a short situation.
Take Profit 1 : It's the gap, in percentage, from the entry point. For example, the first take profit will be set 0.5% higher/lower than the entry point.
Take Profit 2 : It's the gap, in percentage, from the entry point. For example, the second take profit will be set 0.5% higher/lower than the entry point.
Stop Loss : It's the gap, in percentage, from the entry point. For example, the stop loss will be set 0.5% higher/lower than the entry point.
How to use
The use will be like that for the classic Ichimoku, the combination with a volatility indicator or the volume analysis will certainly help to reduce false signals and therefore to select only the most profitable signals.
Remember that every statistical indicator is just a tool, it needs to be understood to be used at its best, otherwise, it is just a colored line in a colored graph.
EneX SignalEneX is signal that give recommendation signals for entry and exit on spot market. This indicators not suitable for leverage trading in futures market.
EneX signal consider several indicators and has entry and exit rules.
EneX signal is suitable for investors who believe in trend following strategy (disclaimer on).
This script composed by Yohan Naftali for educational purpose only. Reader who will use this signal must do own research.
Indicator and Plot Involved
1. Williams Fractals with default periods = 2
2. William Alligator Indicators with default simple moving average 8, 13, and 21
3. Exponential Moving Averages with default value EMA 50, 100, and 200
4. Relative Strength Index with default overbought level = 80 and oversold level = 20
5. Williams Fractals are joined to create support and resistance line and fill area between support and resistance lines.
Entry signal conditions
1. Entry on Weakness when bullish fractal appear on n/2 period
2. Entry when price break resistance line
All entry condition must above EMA and alligator signal and not in overbought RSI
Exit signal conditions
1. Lowest price is below Exponential Moving Average
2. Lowest price is below William alligator lines
You can easily find entry and exit points by using Entry (E), Exit(X) signals
How to use
1. Monitor chart and wait until E or X signals
2. Entry if Entry Signal (E) appear (green colored label)
3. Exit if Exit Signal (X) appear (red colored label)
4. Change indicators setting when necessary
Best Practice
1. Entry only when entry signal (E) appear
2. Never entry when price below William alligator signal
3. Exit when exit signal (X) appear
4. Not exit when exit signal appear when you believe or you have information that price will be rebound
5. Exit if you believe that current price meet your target price
6. Always wise when use EneX signals
Disclaimer
Do your own research and consider fundamental price of asset.
The indicators provided on this script is for educational purposes only.
Author does not offer advisory or brokerage services, nor does it recommend or advise users to buy or sell particular stocks or securities.
Please examined script and give feedback for further improvement.
Risk Management Tool [LuxAlgo]Good money management is one of the fundamental pillars of successful trading. With this indicator, we propose a simple way to manage trading positions. This tool shows Profit & Loss (P&L), suggests position size given a certain risk, sets stop losses and take profit levels using fixed price value/percentage/ATR/Range, and can also determine entries from crosses with technical indicators which is particularly handy if you don't want to set an entry manually.
1. Settings
Position Type: Determines if the position should be a "Long" or "Short".
Account Size: Determines the total capital of the trading account.
Risk: The maximum risk amount for a trade. Can be set as a percentage of the account size or as a fixed amount.
Entry Price: Determines the entry price of the position.
Entry From Cross: When enabled, allows to set the entry price where a cross with an external source was produced.
1.1 Stop Loss/Take Profit
Take Profit: Determines the take profit level, which can be determined by a value or percentage.
Stop Loss: Determines the stop loss level, which can be determined by a value or percentage.
2. Usage
One of the main usages of position management tools is to determine the position size to allocate given a specific risk amount and stop-loss. 2% of your capital is often recommended as a risk amount.
Our tool allows setting stop losses and take profits with different methods.
The ATR method sets the stop loss/take profit one ATR away from the entry price, with the ATR period being determined in the drop-down menu next to the selected methods. The range method works similarly but instead of using the ATR, we use a rolling range with a period determined in the drop-down menu next to the selected methods as well.
Unlike the available position management tool on TradingView, the entry can be determined from a cross between the price an an external source. The image above shows entries from the Volatility Stop indicator. This is particularly useful if you set positions based on trailing stops.
SuperTrend+ DuoUses two SuperTrend+ indicators to signal when a change in trend is confirmed.
By using a minor trend within the major, a pullback after a turning point can signal a more optimal entry.
See SuperTrend+ for more details.
Bollinger Bands + Moving Average (BBMA Oma Ally)Found this strategy in babypips forums.babypips.com
This strategy using BB and MA
BBMA Oma Ally Trading Technique
I’m just sharing this Forex Technique that helping me making positive result.
In BBMA, BB (Bollinger Bands) act as Dynamic Support and Resistance.
SETTING OF BBMA - BOLLINGER BANDS
Period : 20
Deviations : 2
Shift : 0
Apply to : Close
Style : Dodge Blue
MA (Moving Average) are used to detect potential entry point.
SETTING OF BBMA - MOVING AVERAGE
Ma5 Hi
Period : 5
Ma Method : Linear Weighted
Apply to : High
Style : Red
Ma10 Hi
Period : 10
Ma Method : Linear Weighted
Apply to : High
Style : Yellow
Ma5 Low
Period : 5
Ma Method : Linear Weighted
Apply to : Low
Style : Magenta
Ma10 Low
Period : 10
Ma Method : Linear Weighted
Apply to : Low
Style : White
Ma50
Period : 50
Ma Method : Exponential
Apply to : Close
Style : Lime
.
EXTREM (SIGNAL)
Extrem is an early signal to say the Market journey is beginning to end - but not yet confirmed
Will only confirm when there is a reversal candle.
Extrem is not valid when there is a CS momentum, although Ma outside BB.
CHARACTERISTICS OF EXTREM
Ma out of Top / Low BB (will not valid if there is cs momentum, although Ma is outside BB)
Reverse candle must exist, as it indicates the journey of a Market is ending (not necessarily 1 or 2 cs)
Retest candle (entry point)
Entry at Highest or Lowest volume
Entry retest candle at Ma5 or body candle
MHV (LOSS VOLUME MARKET) (SETUP)
It is a setup for the beginning of long distance Market journey
This setup gives a validation for the Extrem signal earlier
It is to show the loss of strength for the market.
MHV is valid once CSA (direction candle) appear
***If the candle close NOT above or below Top / Low BB after the first Reentry, after MHV there is a directional candlestick, then there will be a reentry and after the reentry there is no momentum “COMPULSORY TP”
CHARACTERISTICS OF MHV :
Candle CANNOT close above or below Top / Low BB
Must have reverse candle, because reverse candle is confirming the end of the journey (Marking at candle body)
Retest candle (entry point) at Ma5 or highest volume / lowest at that current time
Must happen after Extrem
TYPES OF MHV
5 types but i can only post 1 photo. So sorry i cant give more on this.
RE-ENTRY
CHARACTERISTICS OF REENTRY
Candle close can not pass Ma5 / Ma10
It will be strong when the candle close does not pass Ma5 / Ma10 and also Mid BB
Candle close did not come in. He found Ma5 / Ma10 and mid BB at that Time would make the re-entry stronger
If there is a re-entry in Ma5 / Ma10 and mid BB, the minimum of 3 drops of candles or increments (follow TF) re-entry will be strong
Following market trend, then just search for re-entry and entry
Wait for the second candle, because the first candle validates the reentry and the second candle is for entry
3GBH - RSI vs BTC's RSIThis indicator compared the RSI of the pair you're viewing to BTC's RSI.
- Currently based against 'BTCUSD', more BTC pairs will be added in the near future.
-----
Included in this indicator:
- RSI of current pair
- RSI of 'BTCUSD'
- EMA of current pair RSI
- EMA of 'BTCUSD' RSI
-----
See what your pair is doing versus BTC.
EMA's to help with Technical Analysis.
-----
Help decide whether to look for a SHORT or LONG entry. ( Shows if 'Table' is On )
-----
User-friendly.
You can change all the inputs, they are labelled for ease-of-use.
You can toggle On/Off any or all of the options.
3GBH - EMA Clouds + Bollinger BandsIncluded in this indicator :
- 2 Sets of EMA clouds
- Bollinger Bands
-----
2 Sets of EMA clouds.
You can toggle On/Off, any or all of the Sets.
-----
Bollinger Bands.
-----
Help decide whether to look for a SHORT or LONG entry. ( Shows if Set is On )
-----
User-friendly.
You can change all the inputs, they are labelled for ease-of-use.
You can toggle On/Off any or all of the options.
[blackcat] L1 Tim Tillson T3Level: 1
Background
T3 Moving Average is the responsive form of traditional moving averages. Presented in 1998 by Tim Tillson, T3 is also known as the Tillson Moving Averages. The thought behind the development of this technical indicator was to improve lag and false signals, which can be present in moving averages.
Function
The T3 indicator performs better than the ordinary moving averages. The reason for this is T3 Moving Average is built with the EMA (exponential moving average).
Its calculation is based on the sum of single EMA, double EMA, Triple EMA, and so on.
This gives the following equation:
T3 = c1*e6 + c2*e5 + c3*e4 + c4*e3…
Where
e3 = EMA (e2, Period)
e4 = EMA (e3, Period)
e5 = EMA (e4, Period)
e6 = EMA (e5, Period)
a is the volume factor, with a default value of 0.7 but you can also use 0.618
c1 = a^3
c2 = 3*a^2 + 3*a^3
c3 =6*a^2 – 3*a – 3*a^3
c4 = 1 + 3*a + a^3 + 3*a^2
When a trend appears, the price action stays above or below the trend line and doesn’t get disturbed from the price swing. The moving of the T3 and the lack of reversals can indicate the end of the trend. The T3 Moving Average produces signals just like moving averages, and similar trading conditions can be applied. If the price is above the T3 Moving Average and the indicator moves upward, this is a sign of a bullish trend. Here we may look to enter long. Conversely, if the price action is below the T3 Moving Average and the indicator moves downwards, a bearish trend appears. Here we may want to look for a short entry.
Key Signal
Price --> Price Input.
T3 --> T3 Ouput.
Remarks
This is a Level 1 free and open source indicator.
Feedbacks are appreciated.
Target Price for KuCoin FuturesWhen trading on KuCoin, it can be difficult to determine what you're exit price should be.
This script solves this issue by giving you an exit price based on a given entry price, a base margin, and a target profit %.
USE CASES:
No Entry Price:
If you have no position in KuCoin, then this use case could be more helpful. With no entry price inputted, two lines will be drawn above and below the current closing price.
The blue line represents your exit price for if you were to enter into a long at the current close.
The orange line represents your exit price if you were to enter into a short at the current close.
With Entry Price:
If you're already in a position in KuCoin, then this case might be more helpful.
The green line represents your exit price for a long from your entry price
The red line represents your exit price for a short from your entry price
The yellow line represents your entry price itself.
Gann Price VibrationsCurrently there is no Script available for drawing Price Vibrations based on Gann theory. I have attempted to fill this gap. This indicator will draw Cycle lines based on Gann Theory. This is vey basic one. It draws lines at start/end of every cycle. One cycle is 360 degrees. Based on feedback, it will be upgraded further with lower Angles 90/180/270 degrees movement.
How to use it ? Once you load the indicator on the chart, edit settings and give current market price of Stock you are watching.
Example: If you are watching Reliance share price on chart, go to indicators/Public/Gann Price Vibrations. Once indicator is loaded, edit input Price as 2200. Then indicator will draw cycle lines.
How to trade ? Generally, it is assumed that stock prices move in cycles. Prices spend more time near these lines. So, if you find UP or Down breakout from cycle lines, take entry. For Long trade, Target is next upper line and stop loss is one line below. Similarly, for short trade, Target is next below line and stop loss is upper line. Just notice, how RIL is moving exactly within these cycles.
If you want to study historical charts, you need to enter Price value closer to that date.
Please Like it/Share it
AO-ZoneThe Zone is mention in New Trading Dimensions by Bill Williams,PhD.
The Zone is used for Entry Signal
Green Zone are painting Green when Awesome Oscillator (AO) and Accelerater/Decelerator (AC) are both increasing.
Red Zone are painting Red when Awesome Oscillator (AO) and Accelerater/Decelerator (AC) are both decreasing.
Gray Zone are painting Gray when AO and AC in difference changing
Gray Zone are indicate the indecision between bulls and bears.
Bill Williams, PhD. mention that Green Zone or Red Zone usually happen 6-8 bars Continuously.
(in my opinion, it happen lower than in intraday time frame)
The First Bar that change to be Green or Red color is the Signal Bar.
Entry Signal is the second bar in the same color as the Signal bar happen with Volume
Price go higher the high of previous Green Bar is Buy Signal. Entry Buy (Long) and place Stop at 1 tick lower the Low of previous bar.
Price go lower the Low of previous Red Bars is Sell Signal. Entry Sell (Short) and place Stop at 1 tick higher the High of previous bar.
Can Entry from 2nd bar to 5th bar.
Do not Entry if Green Bars or Red Bars completed 5 bars continuously.
This indicator have AO , AC and Zone in 1 tools and there are counter to show the number of Green bar or Red bar.
Green counter will happen when AO >0 and Green zone because AO > 0 show uptrend condition.
Red Counter will happen when AO < 0 and Red Zone because AO <0 show downtrend condition.
When we entry , we should follow the trend. So I design to non-show the counter if zone is against the trend.
#WaveRiders
scalping2sahilnarkarThis is the a bit edited to the previous script. As per regulations i have kept this as an open script.
The only Difference to confirm your support resistance levels is an addition of simple moving average 21.
Rules are the Same-
- Trade long when above vwap and 21EMA
- Trade Short when below the VWAP.
EMA21 and EMA50 acts as support where as SMA 21 will show the Trend.
Even though This script is purely based on EMA's, i tend to find the SMA21 as a good Support resistance/support while taking a trade as it avoids the wipsaws while taking an entry.
Please Note-
-This is a scalping Script so book profits and keep stoplosses accordingly.
-When you put this script on the screen, remove everything except EMA9,EMA21,EMA50,EMA200 and the SMA21(keep the arrows and edit the arrows as you want)
-This is not a plug and play script so tune it as you want on the settings.
-Please consider using a VWAP always.
-I have made this script after putting it into many indian stocks you have to tune it as per your stock exchange.
ADX Momentum cross + MacD + HH LL + Buy/Sell Signals and alerts Hello, This is the first indicator I have made and would like to contribute to the community.
This strategy came from trying to replicate a previous ADX Cross Indicator that I loved on MT4 which I used successfully on EUR/USD on high and low time frames. Through the process of trying to replicate it I failed, I decided to take what I had written so far and create my own ADX cross strategy using the combination of 3 ADX's, their lag. Then also using Higher highs and lower lows with the MacD to further filter the signals.
There are two buy and two sell conditions , the difference between these are just the order in which the ADX crossing determines the entry. The MacD and higher highs and lower lows are the same for filtering the signal.
You can change the look back for HH and LL look back range, along with the DI Length & ADX Smoothing for all ADX's. The lag used for either the buy or sell strategy with the Lag_Buy/Lag_Sell inputs. Lag_mid setting will affect all 4 conditions.
From testing and based on the ADX cross logic you should follow this structure when changing the inputs for:
DI Length: Lowest DI value (I.E. 1)
DI Lengtha: Middle DI value (I.E. 2)
DI Lengthb: Highest DI value (I.E. 3)
ADX Smoothing: Lowest Smoothing value (I.E. 1)
ADX Smoothinga: Middle Smoothing value (I.E. 2)
ADX Smoothingb: Highest Smoothing value (I.E. 3)
I tested this on the EUR/USD, but mainly I have been using it on BTC/USDT(binance) and BTC/USDT Perpetual futures(binance) with the 5 minute chart. I suggest playing around with the settings depending on the Symbol and timeframe you use because the default settings are what I last found to be optimal for my self on the 5min BTC/USDT Perpetual futures(binance) chart.
A good starting point I found when using the indicator on other charts is to use the below values:
DI Length: 7
DI Lengtha: 14
DI Lengthb: 21
ADX Smoothing: 7
ADX Smoothinga: 14
ADX Smoothingb: 21
If you have any questions, suggestions, or requests for this indicator feel free contact me. You can either comment on here or Message me
If you like this indicator please like and comment where you found it useful.
Electrified Aggressive Momentum SignalWhat this can be used for:
If you've already decided you want to trade a symbol, this can identify points of momentum alignment.
If a strong move has recently happened and you're looking for a change in momentum.
How it works:
This is a weighted combination of a Stochastic RSI and two modified SuperTrend (ATR Trailing Stop) indicators:
The Stochastic RSI signal is based upon aligned momentum and is negated at the overbought and oversold points.
The SuperTrend formula uses high and low values for calculation and both fast and slow can be adjusted for sensitivity.
Philosophy:
Signals have to be useful to humans. If a signal occurs to late, you've missed it. The intent of this indicator is to assist in timing a trade at very short time-frames. It assumes your conviction about a trade already exists, but you are trying to get an optimal entry.
Opposing momentum (weak signal) within an uptrend can be a sign that you should wait before entering. The frequency of a signal can indicate the strength of the trend. As the frequency of the aligned signal value decreases so does the reward vs risk.
Caco Maia's Double break out A setup created and used by Caco Maia — Brazilian trader with over 40 years experience.
It is based on the simultaneous crossing of the price with 8 and 20 moving averages, filtered by TRIX and Stochastic indicators.
How to use:
Wait for the signal bar to close.
Observe the context of the chart and direction of the trend. For example: do not follow the signal with the moving averages are pointing to the opposite direction of the trade/signal.
Better if used with other indicators to confirm the trade entry.
---------------------
Setup do duplo rompimento do Caco Maia.
Indica o rompimento simultâneo do preço com as médias móveis de 8 e 20, filtrado pelo TRIX e Estocástico.
Como usar:
Espere o fechamento da barra com o sinal.
Observe o contexto do gráfico e a direção da tendência. Por exemplo: não inicie o trade se as média móveis estão apontando para a direção oposta ao sinal.
Melhor se usado com outros indicadores para confirmar a entrada no trade.
White MAThis modified indicator just based on my 2cent strategy & experience,
which is:-
MA6, MA20, MA50, MA200
However, I always turn off MA20 since I also use BB (20) indicator.
Generally, if small MA cross up big MA, then it becomes entry signal, & vice versa
Each entry signal need confirmation state which is next price should close higher than crossing price.
If price close lower than crossing price, then it will be invalid entry's signal,
while if price keep maintain at same value, then it's mean uncertain for me until it close whether above or below crossing price.
"Strategy 1" (General)
In TF1D, the pattern should fulfill my condition as below:-
- MA20 above MA50 (bullish uptrend)
- Price pullback at least touch MA20 for reversal (making Higher Low)
- Price break resistance of pullback's price
My entry signal only after it close above the resistance, near "support" (RBS, Resistance become Support)
My stop-loss, if and only if price touch previous SMA6 price (or SMA10)
Unfortunately, I haven't had any specific target price. It's depending on what kind of "player" you are. (achievement)
Few TPs those I used:-
- Price touch my Static Resistance on chart obtained from,
~ Pullback price
~ Fibo (1.61++)
~ Higher price in 3 months, 6 months, 1 year, 3 year, and so on. (road to ATH, All Time High)
- Price close outside Upper BB (Dynamic Resistance)
I don't assume sell signal by using crossing indicator as TP, it's more to stop-loss for me. (means stop from loss your profit)
"Strategy 2" (Reversal Entry)
In TF15 minutes, we are assuming entry signal when SMA6 cross up SMA50. However, it's still need confirmation by next closing price.
This strategy can be apply in TF1D although SMA20 doesn't cross up SMA50 yet.
That's all my sharing strategy/system based on my 2cent experience, it's not a prefects strategy but I hope it will gives some idea for you guys in order to obtain your own system.
Phoenix Ascending 2.201Hi Everyone!
It's time to make this indicator public to relieve myself of replying to requests for access. There has been an update to this indicator; in which a Stochastic RSI was added to this indicator. Please follow the directions to SETUP the indicator in the SETUP VIDEO provided below.
Phoenix Ascending 2.201 and Bollinger Bands Setup Video.
The following are BASIC rules for the Phoenix 2.201 Indicator. More advanced rules and the requirements for those rules can be found in my publications in my public profile. Unfortunately, I do not have organized videos created on how to use this indicator in full but will be available in the future.
IMPORTANT: The BASIC rules below are beneficial but these are NOT all the rules. More rules and requirements for those rules will be available in the future.
RULE NO. 1
We PREFER the Blue LSMA to be at 80% or higher for SAFE EXIT (SHORT) bets.
We PREFER the Blue LSMA to be at 20% or lower for SAFE ENTRY (LONG) bets.
Rule No. 2
ANY time the red line is approaching a green line that’s moving UPWARD,
Be prepared to make an ENTRY (LONG) when the red line is about to touch the green line that’s moving upward.
One can look at a lower time frame to get a better idea of how much longer you may have
To wait for the red line to touch the green line. In many cases, you may make ENTRY (LONG)
Just before the red line actually touches the green line that’s moving up in that higher time frame
You were initially using as your COMPASS. I currently have the 1-Month TF as a compass for EURUSD.
Rule No. 3
ANY time the red line is approaching a green line that’s moving DOWNWARD,
Be prepared to make an EXIT (SHORT) when the red line is about to touch the green line that’s moving downward.
One can look at a lower time frame to get a better idea of how much longer you may have
To wait for the red line to touch the green line. In many cases, you may make your EXIT (SHORT)
Just before the red line actually touches the green line that’s moving downward in that higher time frame
You were initially using as your COMPASS. I currently have the 1-Month TF as a compass for EURUSD.
Rule No. 4
The Green Line and/or Ghost Line can often help one determine when an upward or downward move in a particular time frame
Is nearly exhausted and about to reverse.
Example for Upside Exhaustion about to reverse to the Downside:
When the Green Line and/or Ghost line is at 80% level or higher, this is a good indicator to inform
Us the current upside move may be approaching exhaustion. You can look at a higher time frame to try to gain
More insight as to whether this will only be a brief dip down in the lower time frame IF the higher time frame you
Went to reveals there is a lot more room remaining for the Green and/or Ghost Lines to reach the 80% or higher level.
Example for Downside Exhaustion about to reverse to the Upside:
When the Green Line and/or Ghost line is at 20% level or lower, this is a good indicator to inform
Us the current downside move may be approaching exhaustion. You can look at a higher time frame to try to gain
More insight as to whether this will only be a brief dip up in the lower time frame IF the higher time frame you
Went to reveals there is a lot more room remaining for the Green and/or Ghost Lines to reach the 20% or lower level.
Rule No. 5
The same rules you see in Rule No. 4 also apply to the Stochastic RSI. Keep in mind I changed the colors of the
Stochastic RSI to the following: Red default changed to Purple and Blue changed changed to Black to avoid confusing
Them with the lines in Godmode.
When the Stochastic RSI is at 80% or higher level, we need to be on guard for a reversal to the downside.
When the Stochastic RSI is at 20% or lower level, we need to be on guard for a reversal to the upside.
EXTREMELY IMPORTANT to apply these rules in GROUPS OF TIME FRAMES.
"TYPES" OF TIME FRAME GROUP TRADING SIGNALS
Scalping Group Signals: Signals provided for this group involve analyzing the following two groups of time frames. Short Term Group as a compass and Scalping Group for confirmation and more precise entry/exit.
Scalping Group: 6min. 12min. 23min & 45min.
Short Term Group: 90min. 3hr. 6hr. & 12hr.
Short Term Group Signals: Signals provided for this group involve analyzing the following two groups of time frames. NearTerm Group as a compass and Short Term Group for confirmation and more precise entry/exit.
Short Term Group: 90min. 3hr. 6hr. & 12hr.
Near Term Group: 24hr. 2-Day, 3-Day & 4-Day
Near Term Group Signals: Signals provided for this group involve analyzing the following two groups of time frames. Mid Term Group as a compass and Near Term Group for confirmation and more precise entry/exit.
Near Term Group: 24hr. 2-Day, 3-Day & 4-Day
Mid Term Group: 3-Day, 6-Day, 9-Day & 12-Day
Mid Term Group Signals: Signals provided for this group involve analyzing the following two groups of time frames. Long Term Group as a compass and Mid Term Group for confirmation and more precise entry/exit.
Mid Term Group: 3-Day, 6-Day, 9-Day & 12-Day
Long Term Group: 1-Week, 2-Week, 3-Week & 4-Week
Long Term Group Signals: Signals provided for this group involve analyzing the following two groups of time frames. Macro Term Group as a compass and Long Term Group for confirmation and more precise entry/exit.
Long Term Group: 1-Week, 2-Week, 3-Week & 4-Week
Macro Term Group: 1-Month, 2-Month, 3-Month & 4-Month
Macro Term Group Signals: Signals provided for this group involve analyzing the following two groups of time frames. Macro Term Group as a compass and Long Term Group for confirmation and more precise entry/exit.
Macro Term Group: 1-Month, 2-Month, 3-Month & 4-Month
Super Macro Group: 3-Month , 6-Month, 12-Month & 24-Month
[blackcat] L3 Bias ScalperLevel: 3
Background
Bias alone is a powerful tool for trading. I use SMA3, SMA10, SMA20, SMA30 to cover short and middle term of the trend for scalping. Multiple biases can be introduced for long and short entries.
Function
Use SMAs and biases for scalping with whale move alert (banker fund flow detection)
Key Signal
buy --> entry signal for long
strongbuy --> entry signal for long
add --> buy more or re-entry signal for long
reduce --> partial exit for long
exit --> complete exit for long
sell --> short entry signal
whalemove --> banker fund move detection
Pros and Cons
This script provides entry signal together with whale detection by bias algorithms, you can use whale move to predict next move of trend in large time frame. However, trading signal should be further filtered out for more precise entry signal.
Remarks
At beginning, I want to make it simple and it looks very complex at the end...
Readme
In real life, I am a prolific inventor. I have successfully applied for more than 60 international and regional patents in the past 12 years. But in the past two years or so, I have tried to transfer my creativity to the development of trading strategies. Tradingview is the ideal platform for me. I am selecting and contributing some of the hundreds of scripts to publish in Tradingview community. Welcome everyone to interact with me to discuss these interesting pine scripts.
The scripts posted are categorized into 5 levels according to my efforts or manhours put into these works.
Level 1 : interesting script snippets or distinctive improvement from classic indicators or strategy. Level 1 scripts can usually appear in more complex indicators as a function module or element.
Level 2 : composite indicator/strategy. By selecting or combining several independent or dependent functions or sub indicators in proper way, the composite script exhibits a resonance phenomenon which can filter out noise or fake trading signal to enhance trading confidence level.
Level 3 : comprehensive indicator/strategy. They are simple trading systems based on my strategies. They are commonly containing several or all of entry signal, close signal, stop loss, take profit, re-entry, risk management, and position sizing techniques. Even some interesting fundamental and mass psychological aspects are incorporated.
Level 4 : script snippets or functions that do not disclose source code. Interesting element that can reveal market laws and work as raw material for indicators and strategies. If you find Level 1~2 scripts are helpful, Level 4 is a private version that took me far more efforts to develop.
Level 5 : indicator/strategy that do not disclose source code. private version of Level 3 script with my accumulated script processing skills or a large number of custom functions. I had a private function library built in past two years. Level 5 scripts use many of them to achieve private trading strategy.
[fareid] Quick Backtest Framework█ OVERVIEW
This Framework allows Pine Coders to quickly code Study() based signal/strategy and validate its viability before proceed to code with more advance/complex customized rules for entry, exit, trailstop, risk management etc..
This is somewhat an upgraded version of my earlier personal template with different strategy used, cleaner code
and additional features.
█ USE CASES
- You have an idea for trade signal and need a quick way to verify its potential before writing lengthy/complicated code
- You found a study script for trading signal in public library and want to validate it profitability with minimum effort before including it in your trading playbook
█ FEATURES
- Alert: Ready to use alert function based on signals from your custom indicator.
- Visual Backtest: Auto-plot entry, stop-loss and take profit for simple strategy performance analysis
- Backtest Statistic: Provide basic key metrics based on backtest strategy
- BTE External Signal Protocol: Ready to use code that will supply required state to PineCoders Backtesting & Trading Engine if you wish to have more advance and sophisticated backtesting engine
Notes: All of the above features have On/Off toggle
█ Description & How To Use
This Framework consist of 5 Modules but you only need to edit the first 2 Modules:
Module1: Indicator
Module2: Framework Input Protocol
Module3: Alert
Module4: Backtest
Module5: Backtest & Trading Engine
Tips: The source-code includes collapsible block by module for easy navigating
Module1: Indicator:
-----------------------------------------------------------------------------------
Main Module. Place custom indicator input parameter/calculation/indicator plotting here
Sample Strategy: Double MACD Crossover
MACD Signal: 1st MACD Cross above signal line indicate Buy Signal
1st MACD Cross below signal line indicate Sell Signal
MACD Filter: 2nd MACD is above 0 line indicate Uptrend
2nd MACD is below 0 line indicate Downtrend
Module2: Framework Input Protocol:
-----------------------------------------------------------------------------------
Use this module to connect main indicator/signal calculated in Module1 to the rest of the framework's module
4 variables needed to be defined here:
1. Uptrend
2. Dntrend
3. BuySignal
4. SellSignal
i'm not sure how to place a code snippet here to show you example so in the source code i already put a comment in Module2 on which part u need to edit. I hope its pretty simple to use.
Module3: Alert Module Description:
-----------------------------------------------------------------------------------
As long as the variables in Module2 properly defined, the alert module is ready to use without any further modification.
Input:
Enable Alert --> Enable TV's alert and plot signal to chart
Alert Type --> Set to take Buy only, Sell only or Both alert
Module4: Backtest Module Description:
-----------------------------------------------------------------------------------
As long as the variables in Module2 properly defined, the backtest module is ready to use without any further modification.
Input:
Backtest Stat --> Enable Backtest Statistic Label
Backtest Visual --> Enable Backtest visual simulation
Backtest Type --> Set to take Buy only or Sell only or both
SL Type -->
ATR : Set SL in ATR times Multiplier below entry price
Fixed : Set SL in fixed point below entry point (in 'Dollar'). e.g. for Stocks -> 0.5 equals to 50cent while for EURUSD currency -> 0.005 equal to 50 pips
HiLo Bar: Set SL at highest/lowest wick of previous bar plus/minus Fixed point. e.g. EURUSD HiLo=3 and Fixed Point = 0.0005, buy trade will place SL 5 Pips below lowest of previous 3 bar
SL ATR Multi --> Set Lookback Period used for SL's ATR calculation
SL ATR Multi --> Set ATR Multiplier for SL
SL Fixed --> Set Fixed Level for SL
SL Bar --> Set Number of previous bar to check for SL placement
TP RR Ratio --> Set TP based on RR multiplier. e.g. 2 means TP level will be twice further from entry point compared to Entry-SL distance.
Notes: The point is for preliminary testing, so it only supports 1 trade at a time and no Trailing Stop
Module5: Backtest & Trading Engine Description:
-----------------------------------------------------------------------------------
As long as the variables in Module2 properly defined, the Pinecoders BTE module is ready to use without any further modification.
Input:
External Signal Protocol --> Set ESP State to send to "Backtesting & Trading Engine "
Signal With Filter --> Use this to send entry signal that already filtered by this study indicator (without stoploss level)
Signal Without Filter --> Use this to send raw entry signal that are NOT YET FILTERED by this study indicator (without stoploss level)
Signal and Stop With Filter --> Use this to send entry signal WITH StopLoss that already filtered by this study indicator (with stoploss level)
Signal and Stop Without Filter --> Use this to send raw entry signal WITH StopLoss that are NOT YET FILTERED by this study indicator (with stoploss level)
Notes: Backtesting & Trading Engine already have built-in Filter, Entries and Stop Level. e.g. Unselect all their filter state if only want to use custom filter and make sure send Signal with Filter (with or without SL level)
█ DISCLAIMER:
This framework main objective is to create my personal indicator template so that i just have to modify the indicator module for preliminary testing in future.
The sample strategy included are for educational purpose only. Use at your own risk
credit: LucF/PineCoders for a lot of his scripts that i use as a guide to complete this
[blackcat] L2 Ehlers Early Onset TrendLevel: 2
Background
John F. Ehlers introuced Early Onset Trend Indicator in Aug, 2014.
Function
In “The Quotient Transform” in Aug, 2014, John Ehlers described an early trend detection method, the idea of the quotient transform, that was designed to reduce the lag often found in other trend indicators. I provided a script with pine v4 code here for the early-onset trend-detection indicator and also describes an approach for creating a strategy based on this indicator as an example.
The entry points displayed in blue on the price chart are defined by the top Onset Trend Detector upper quotient crossing above a threshold value e.g zero or 0.25/-0.25 here in this script. In the article, Ehlers suggested using a different K value for the exit, so the exit points are determined by the lower Onset Trend Detector quotient crossing below a threshold e.g. zero or -0.25/0.25 here in this script.
Key Signal
Quotient1 --> upper quotient in yellow which determines long entry
Quotient2 --> lower quotient in fuchsia which determines short entry
long ---> long entry signal
short ---> short entry signal
Pros and Cons
100% John F. Ehlers definition translation, even variable names are the same. This help readers who would like to use pine to read his book.
Remarks
The 82th script for Blackcat1402 John F. Ehlers Week publication.
Readme
In real life, I am a prolific inventor. I have successfully applied for more than 60 international and regional patents in the past 12 years. But in the past two years or so, I have tried to transfer my creativity to the development of trading strategies. Tradingview is the ideal platform for me. I am selecting and contributing some of the hundreds of scripts to publish in Tradingview community. Welcome everyone to interact with me to discuss these interesting pine scripts.
The scripts posted are categorized into 5 levels according to my efforts or manhours put into these works.
Level 1 : interesting script snippets or distinctive improvement from classic indicators or strategy. Level 1 scripts can usually appear in more complex indicators as a function module or element.
Level 2 : composite indicator/strategy. By selecting or combining several independent or dependent functions or sub indicators in proper way, the composite script exhibits a resonance phenomenon which can filter out noise or fake trading signal to enhance trading confidence level.
Level 3 : comprehensive indicator/strategy. They are simple trading systems based on my strategies. They are commonly containing several or all of entry signal, close signal, stop loss, take profit, re-entry, risk management, and position sizing techniques. Even some interesting fundamental and mass psychological aspects are incorporated.
Level 4 : script snippets or functions that do not disclose source code. Interesting element that can reveal market laws and work as raw material for indicators and strategies. If you find Level 1~2 scripts are helpful, Level 4 is a private version that took me far more efforts to develop.
Level 5 : indicator/strategy that do not disclose source code. private version of Level 3 script with my accumulated script processing skills or a large number of custom functions. I had a private function library built in past two years. Level 5 scripts use many of them to achieve private trading strategy.