Target Trend [BigBeluga]The Target Trend indicator is a trend-following tool designed to assist traders in capturing directional moves while managing entry, stop loss, and profit targets visually on the chart. Using adaptive SMA bands as the core trend detection method, this indicator dynamically identifies shifts in trend direction and provides structured exit points through customizable target levels.
SP500:
🔵 IDEA
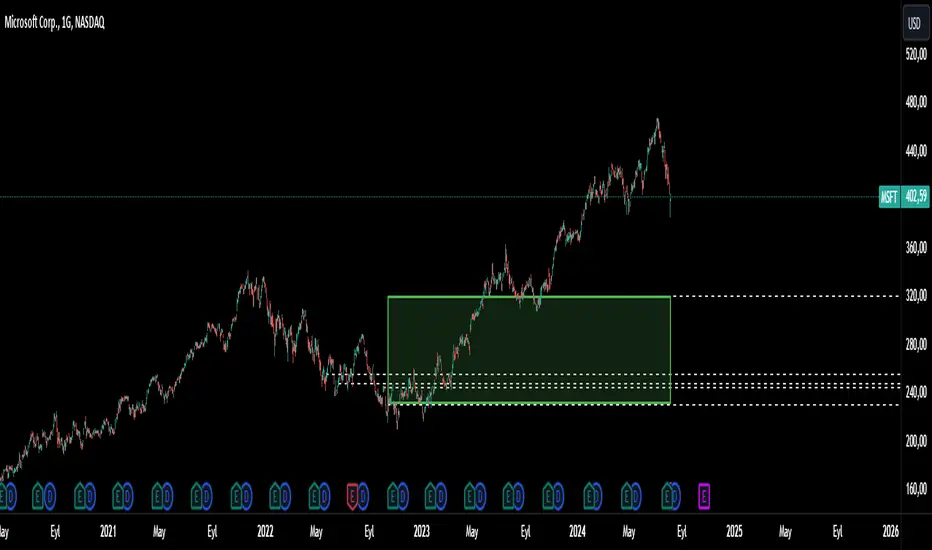
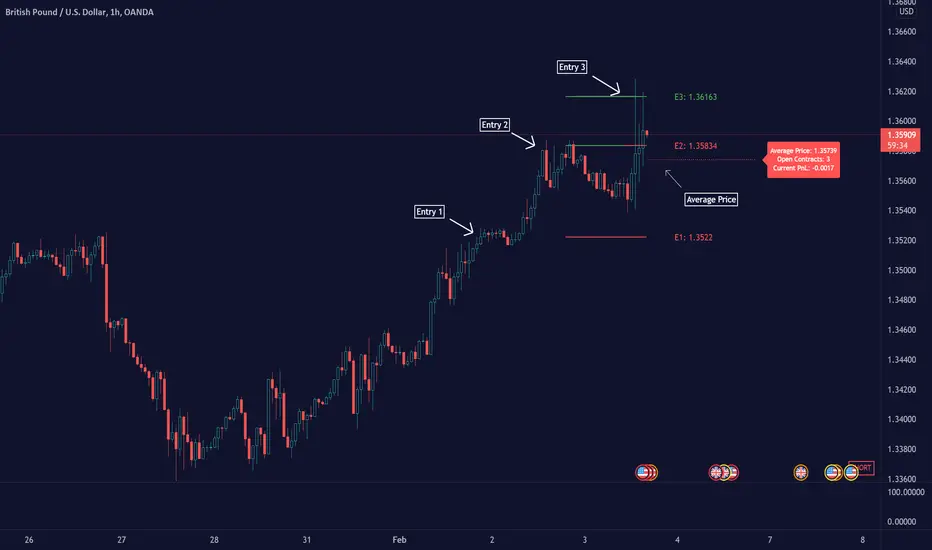
The Target Trend indicator’s concept is to simplify trade management by providing automated visual cues for entries, stops, and targets directly on the chart. When a trend change is detected, the indicator prints an up or down triangle to signal entry direction, plots three customizable target levels for potential exits, and calculates a stop-loss level below or above the entry point. The indicator continuously adapts as price moves, making it easier for traders to follow and manage trades in real time.
When price crosses a target level, the label changes to a check mark, confirming that the target has been achieved. Similarly, if the stop-loss level is hit, the label changes to an "X," and the line becomes dashed, indicating that the stop loss has been activated. This feature provides traders with a clear visual trail of whether their targets or stop loss have been hit, allowing for easier trade tracking and exit strategy management.
🔵 KEY FEATURES & USAGE
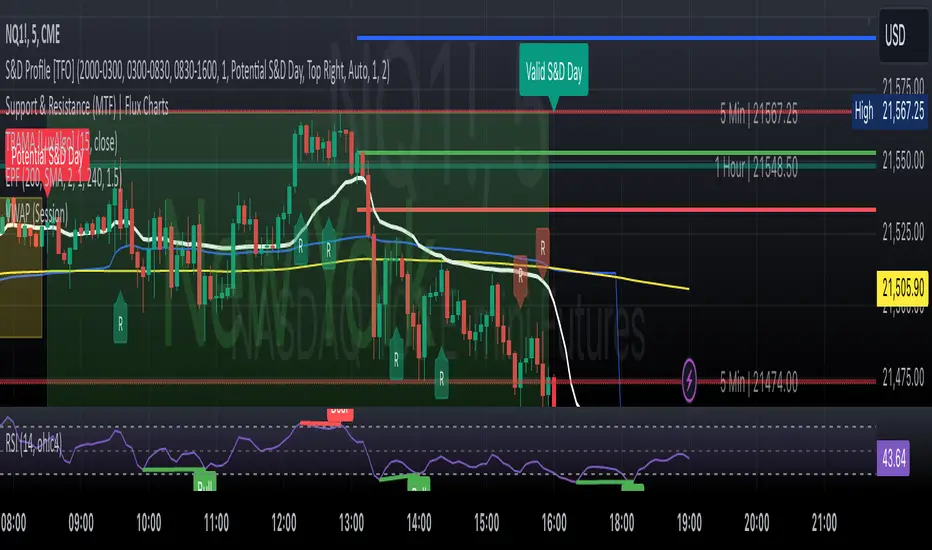
SMA Bands for Trend Detection: The indicator uses adaptive SMA bands to identify the trend direction. When price crosses above or below these bands, a new trend is detected, triggering entry signals. The entry point is marked on the chart with a triangle symbol, which updates with each new trend change.
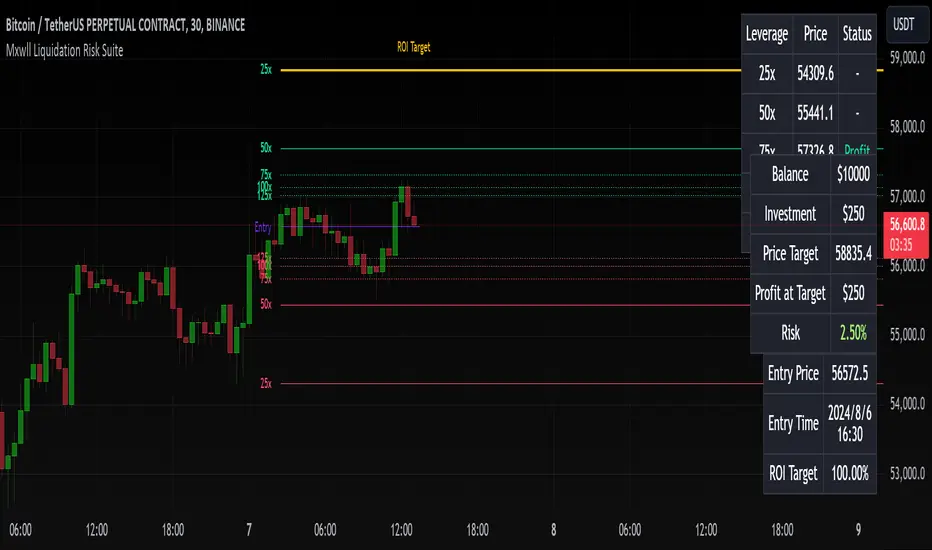
Automated Targets and Stop Loss Management: Upon a new trend signal, the indicator automatically plots three price targets and a stop loss level. These levels provide traders with structured exit points for potential gains and a clear risk limit. The stop loss is placed below or above the entry point, depending on the trend direction, to manage downside risk effectively.
Visual Target and Stop Loss Validation: As price hits each target, the label beside the level updates to a check mark, indicating that the target has been reached. Similarly, if the stop loss is activated, the stop loss label changes to an "X," and the line becomes dashed. This feature visually confirms whether targets or stop losses are hit, simplifying trade management.
The indicator also marks the entry price at each trend change with a label on the chart, allowing traders to quickly see their initial entry point relative to current price and target levels.
🔵 CUSTOMIZATION
Trend Length: Set the lookback period for the trend-detection SMA bands to adjust the sensitivity to trend changes.
Targets Setting: Customize the number and spacing of the targets to fit your trading style and market conditions.
Visual Styles: Adjust the appearance of labels, lines, and symbols on the chart for a clearer view and personalized layout.
🔵 CONCLUSION
The Target Trend indicator offers a streamlined approach to trend trading by integrating entry, target, and stop loss management into a single visual tool. With automatic tracking of target levels and stop loss hits, it helps traders stay focused on the current trend while keeping track of risk and reward with minimal effort.
Indicatore Pine Script®