Session Highs and Lows🔑 Key Levels: Session Liquidity & Structure Mapper
The Key Levels indicator is an essential tool for traders as it automatically plots and projects critical Highs and Lows established during key trading sessions. These levels represent major liquidity pools and define the current market structure, serving as high-probability targets, support, or resistance for the remainder of the trading day.
⚙️ Core Functionality
The indicator operates in two distinct modes, tailored for different asset classes:
1. Asset Class Mode (Toggle)
You can switch between two predefined setups depending on the asset you are trading:
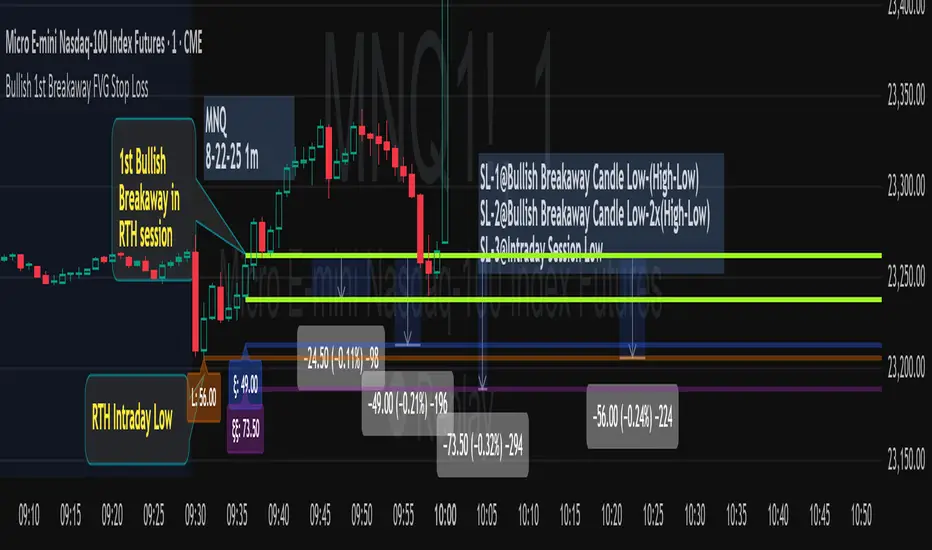
Stock Mode (RTH/ETH): Designed for US stocks and futures (e.g., NQ, ES, YM). It tracks and projects levels for Regular Trading Hours (RTH) (09:30-16:00) and Extended Hours (ETH) (16:00-09:30).
Forex/Default Mode (Asia/London/NY): Designed for global markets (e.g., currency pairs). It tracks and projects levels for the three major liquidity sessions: Asia (19:00-03:00), London (03:00-09:30), and New York (09:30-16:00).
🗺️ Key Levels Mapped
The script continuously tracks and plots the most significant structural levels:
Current Session High/Low: The running high and low of the currently active session.
Previous Session High/Low: The confirmed high and low from the most recently completed session. These are often targeted by market makers.
Previous Day High/Low (PDH/PDL): The high and low of the prior 24-hour day, acting as major structural boundaries and a crucial macro market filter.
🎛️ Advanced Liquidity Management
The indicator is built with specific controls for high-level liquidity analysis:
Extend Through Sweeps (Critical Setting):
OFF (Recommended): The projected line is automatically stopped or deleted the moment the price candle wicks or closes past it. This visually confirms that the liquidity at that level has been "swept" or "mitigated."
ON: The line extends indefinitely, treating the level as simple support/resistance, regardless of interaction.
Previous vs. Current View: You can select a checkbox (e.g., Use PREVIOUS London Level) to hide the current session's running levels and only display the static, confirmed high/low from the prior completed session. This helps declutter the chart and focus only on the confirmed structural levels.
Show Older History: Toggle to keep lines from prior days visible, allowing you to track multi-day structural context.
🎯 Trading Application
The lines plotted by the Key Levels indicator provide immediate, actionable information:
Bias Filter: Use the PDH/PDL to determine the overall market context. Trading above the PDH suggests a bullish bias, while trading below the PDL suggests a bearish bias.
Manipulation/Entry: Wait for price to aggressively sweep a Previous Session High/Low (line stops extending). This often signals a liquidity grab or "manipulation" phase. Look for entries in the opposite direction for the main move (Distribution).
Targets: Key levels (especially unmitigated ones) serve as excellent, objective take-profit targets for active trades.
Indicatore Pine Script®