ICT Smart Money Trading Suite PRO [SwissAlgo]ICT SMC Trading Suite Pro
Structure Detection. Imbalance Tracking. Trade Planning. Contextual Alerts.
Why This Integrated System Was Built
The ICT/SMC methodology requires tracking multiple analytical components simultaneously - a process prone to manual errors, time inefficiency, and visual clutter . This indicator consolidates these elements into a single, unified system , providing rules-based validation for experienced ICT traders who may struggle with execution speed, consistency, and manual calculations.
-----------------------------------------------------------------
What This Indicator Does
ICT/SMC methodology involves tracking multiple analytical components simultaneously. This indicator consolidates them into a single system.
Common challenges when applying ICT manually:
1️⃣ Structure Identification
Determining which pivots qualify as external (macro) structure versus internal (micro) structure requires consistent rules. Inconsistent structure identification affects the detection of the relevant trading range for entries , Change of Character (ChoCH) , and Break of Structure (BoS) . Accurate structure identification is paramount ; a faulty reading invalidates the entire ICT thesis for the current swing. While no automated system can replace human judgment, the indicator provides you with a rules-based starting point for structural analysis. The key goal is to help you find and map the relevant structural leg to focus on.
2️⃣ Chart Organization
Drawing Fibonacci retracements, Fair Value Gaps, Order Blocks, and other imbalances manually creates visual complexity that can obscure the analysis. The indicator addresses this by striving to show all imbalances in a consistent, unified, and understandable visual way , using color coding and z-order layering to maintain clarity even when multiple components are active.
3️⃣ Imbalance Tracking
ICT methodology requires monitoring a vast array of institutional footprints : Fair Value Gaps (FVG), Order Blocks (OB), Breaker Blocks (BB), Liquidity Pools (LP), Volume Imbalances, Wick Imbalances, and Kill Zone ranges. Tracking all these simultaneously and manually monitoring their mitigation status is highly time-intensive and prone to oversight . The indicator constantly scans and tracks all key imbalance types for you, automatically updating their status and creating a dynamic, real-time visual heatmap of unmitigated institutional inefficiency.
4️⃣ Trade Calculation
Determining structure-based Stop Loss (SL) placement, calculating multiple Take Profit (TP) levels with accurate position-sizing splits, and computing the final blended Risk-to-Reward (R:R) ratio involves multiple time-sensitive, manual calculations per setup . The indicator automates this entire trade calculation process for you, instantly providing the necessary pricing (entry, SL, TP), sizing, and performance projections, and mitigating the risk of execution error .
5️⃣ Condition Monitoring
ICT setups often require specific technical conditions to align: price reaching discount Fibonacci levels (0.618-0.882 for shorts, 0.118-0.382 for longs), EMA crossovers confirming momentum, or structural shifts (ChoCH/BoS). Identifying these moments requires continuous chart observation across multiple assets and timeframes.
This indicator includes an alert system that monitors these technical conditions and sends notifications when they occur (real-time). The alert system is designed to minimize spam. This allows traders to review potential setups on demand rather than through continuous observation - particularly relevant for those monitoring multiple instruments or trading sessions outside their local timezone.
-----------------------------------------------------------------
Intended Use
This indicator is designed for traders who:
♦ Apply ICT/SMC methodology - Familiarity with concepts such as Fair Value Gaps, Order Blocks, Liquidity Pools, market structure, and discount/premium zones is assumed. The indicator does not teach these concepts but provides tools to apply them.
♦ Trade on intraday to swing timeframes - The structure detection and Fibonacci zone mapping work across multiple timeframes. Recommended primary timeframe: 1H (adjustable based on trading approach).
♦ Prefer systematic entry planning - The trade calculation feature computes stop loss, take profit levels, and risk-to-reward ratios based on structure and Fibonacci positioning. Suitable for traders who use defined entry criteria.
♦ Monitor multiple instruments or sessions - The alert functionality notifies when specific technical conditions occur (discount zone entries, EMA crossovers, structure changes), reducing the need for continuous manual monitoring.
♦ Use trade execution platforms - The trade summary table displays pre-formatted values (entry, SL, TP levels with quantity splits) that can be manually input into trading platforms or bot services like 3Commas.
-----------------------------------------------------------------
How To Use
Step 1: Structure Analysis
The indicator automatically detects external and internal market structure using pivot analysis. Structure lines are color-coded: red for bearish structure, green for bullish. External pivots are marked with larger triangles, internal pivots with smaller markers. The pivot length parameters (default: 20/20) can be adjusted in settings to align with your structural analysis approach and the asset you are analyzing.
Step 2: Define Your Trading Zone
Use the "Start Swing" and "End Swing" date inputs to mark the beginning and end of the (external) structural leg you wish to analyze. The indicator calculates Fibonacci retracement levels based on these points and color-codes the zones:
* Green zones: Discount area (0.618-0.882 for bearish / 0.118-0.382 for bullish)
* Yellow zones: Premium area (0.786-1.0 for bearish / 0.0-0.214 for bullish)
* Red zones: Extension area beyond structure (potential fake-out zones)
Step 3: Review Imbalances
The indicator identifies and displays multiple imbalance types:
🔥 Volume imbalances (from displacement candles based on PVSRA methodology)
🔥 Fair Value Gaps (FVG)
🔥 Order Blocks (OB) and Breaker Blocks (BB)
🔥 Liquidity Pools (LP) at equal highs/lows
🔥 Wick imbalances (exceptional wick formations)
🔥 Kill Zone liquidity from specific trading sessions (Asian, London, NY AM)
Volume Imbalances
Fair Value Gaps
Order Blocks
Liquidity Pools
Wick Imbalances
Kill Zone Imbalances
According to ICT methodology, imbalances act as price magnets - areas where price tends to return for mitigation. When multiple imbalances overlap at the same price level, this creates a confluence zone with a higher probability of price reaction .
Imbalances are displayed as gray boxes , creating a visual heatmap of institutional inefficiencies. When imbalances overlap, the zones appear darker due to layering, and labels combine to show confluence (e.g., "FVG + OB" or "Vol + LP").
Heatmap of Imbalances
User can view each type alone, or all together (heatmap)
Each imbalance type is tracked until mitigated by price according to ICT principles and can be toggled on/off independently in settings.
Step 4: Reference Levels & Sessions
The indicator displays additional reference data:
🔥 Daily Pivot Points (PP, R1-R3, S1-S3) calculated from previous day
🔥Average Daily Range (ADR) projected from the current day's extremes
🔥 Daily OHLC levels: Today's Open (DO), Previous Day High (PDH), Previous Day Low (PDL)
🔥Session backgrounds (optional): Color-coded boxes for Asian, London, NY AM, and NY PM sessions
Sessions
While these are not ICT-specific imbalances, they represent widely-watched price levels that often attract institutional activity and can act as additional reference points for support, resistance, and liquidity targeting.
All reference levels can be toggled independently in settings.
Step 5: Momentum Reference
EMA 14 and EMA 21 lines are displayed for momentum analysis. When EMA 14 enters discount zones and crosses EMA 21, a triangle marker appears on the chart. This indicates a potential alignment of structure and momentum conditions.
Step 6: Trade Planning
Input your intended entry price in the "Entry Price" field along with your margin and leverage parameters. The indicator automatically calculates all trade parameters:
* Stop loss level (based on Fibonacci structure - typically at 1.118 extension)
* Three take profit levels (TP1, TP2, TP3) with position quantity splits
* Risk-to-reward ratio (blended across all three targets)
* Projected profit/loss values in both dollars and percentage
All calculated values are displayed both visually on the chart (as horizontal lines with labels) and in a formatted Trade Summary table. The table organizes the information for quick reference: entry details, take profit levels with quantities, stop loss parameters, and performance projections.
This pre-calculated data can be manually copied into trading platforms or bot services (such as 3Commas Smart Trades) without requiring additional calculations.
Step 7: Alert Configuration
Create alerts using TradingView's alert system (select "Any alert() function call"). The indicator sends notifications when:
* Price reaches specific discount Fibonacci levels (0.618, 0.786, 0.882 for shorts / 0.382, 0.214, 0.118 for longs)
* EMA 14/21 crossovers occur within discount zones
* Change of Character (ChoCH) is detected
* Break of Structure (BoS) is detected
Note: Alerts require active TradingView alert functionality. Update alerts when changing your trading zone parameters.
-----------------------------------------------------------------
Key Features
Structure & Zone Analysis
* Automated structure detection with external/internal pivots and zig-zag visualization
* Fibonacci retracement mapping with color-coded discount/premium zones
* Visual zone classification: Green (optimal discount), Yellow (premium), Red (fake-out risk)
ICT Imbalances Heatmap
* Volume imbalances (PVSRA displacement candles)
* Fair Value Gaps (FVG)
* Order Blocks (OB) and Breaker Blocks (BB)
* Liquidity Pools (LP) at equal highs/lows
* Wick imbalances (exceptional wick formations)
* Kill Zone liquidity (Asian, London, NY AM sessions)
* Confluence detection with combined labels and visual layering
Reference Levels
* Daily Pivot Points (PP, R1-R3, S1-S3)
* Average Daily Range (ADR) projections
* Daily OHLC levels (DO, PDH, PDL)
* Session backgrounds for kill zones
Trade Planning Tools
* Automated stop loss calculation based on Fibonacci structure
* Three-tier take profit system with position quantity splits
* Risk-to-reward ratio calculation (blended across all targets)
* P&L projections in dollars and percentages
* Trade Summary table formatted for manual platform entry
Momentum & Signals
* EMA 14/21 overlay for momentum analysis
* Visual crossover markers (triangles) in discount zones
* Change of Character (ChoCH) detection and labels
* Break of Structure (BoS) detection and labels
Chart Enhancements
* Higher timeframe candle overlay (5m to Monthly)
* PVSRA candle coloring (volume-based)
* Symbol legend for quick reference
* Customizable visual elements (toggle all components independently)
Alert System
* Discount zone entry notifications (Fibonacci level monitoring)
* EMA crossover signals within discount zones
* Structure change alerts (ChoCH and BoS)
* Configurable via TradingView alert functionality
Alert Functionality
The indicator includes an alert system that monitors technical conditions continuously.
When configured, alerts notify users when specific events occur:
❗ Discount Zone Monitoring
When EMA 14 crosses into key Fibonacci levels (0.618, 0.786, 0.882 for bearish structure / 0.382, 0.214, 0.118 for bullish structure), an alert is triggered. Example: Trading BTC and ETH simultaneously - instead of monitoring both charts for zone entries, alerts notify when either asset reaches the specified level.
❗ Momentum Alignment
When EMA 14 crosses EMA 21 within discount zones, an alert is sent. Example: Monitoring setups across multiple timeframes (1H, 4H, Daily) - alerts indicate when momentum conditions align on any timeframe being tracked.
❗ Structure Changes
Change of Character (ChoCH) and Break of Structure (BoS) events trigger alerts. Example: Trading during the Asian session while located in a different timezone - alerts notify of structure changes occurring outside active monitoring hours.
Configuration
Alerts are set up through TradingView's native alert system. Select "Any alert() function call" when creating the alert.
⚠️ Note: Alert parameters are captured at creation time, so alerts must be updated when changing trading zone settings (Start/End Swing dates) or any other parameter.
How to Create Alerts
Step 1: Open Alert Creation
Click the "Alert" button (clock icon) in the top toolbar of TradingView, or right-click on the chart and select "Add Alert."
Step 2: Configure Alert Condition
* In the alert dialog, set the Condition dropdown to select this indicator
* Set the alert type to ⚠️ " Any alert() function call "
* This configuration allows the indicator to trigger alerts based on its internal logic
Step 3: Set Alert Timing
* Timeframe: Same as chart
* Expiration: Choose "Open-ended (when triggered)" to keep the alert active until conditions occur
* Message tab: choose a name for the alert
Step 4: Notification Settings
Configure how you want to receive notifications:
* Popup within TradingView
* Email notification
* Mobile app push notification (requires TradingView mobile app)
Step 5: Create
Important Notes:
* Alert parameters are captured at creation time . If you change your trading zone (Start/End Swing dates) or entry price, delete the old alert and create a new one .
* One alert per chart: Create separate alerts for each instrument and timeframe you're monitoring.
* TradingView alert limits apply based on your TradingView subscription tier.
What Triggers Alerts: This indicator sends alerts for four key event types:
1. Discount Zone Entry - EMA 14 crossing key Fibonacci levels
2. Momentum Crossover - EMA 14/21 crossovers within discount zones
3. Change of Character (ChoCH) - Structure reversal detected
4. Break of Structure (BoS) - Trend continuation confirmed
All four conditions are monitored by a single alert configuration .
-----------------------------------------------------------------
Recommended Settings
* Timeframe : 1H works well for most assets
* Theme : Dark mode recommended
* Structural Pivots : Default 20/20 captures reasonable structure; adjust to match your analysis
-----------------------------------------------------------------
Chart Elements Guide
♦ Structure Visualization
Zig-zag lines
Automated structure detection - green lines indicate bullish structure, red lines indicate bearish structure. Thick lines represent external structure , thin faded lines show internal structure .
Triangle markers
Large triangles mark external pivots (swing highs/lows), small triangles mark internal pivots.
Fibonacci Zones
* Green zones: Discount area - potential entry zones (0.618-0.882 for shorts / 0.118-0.382 for longs)
* Yellow zones: Premium area - higher extension zones (0.786-1.0 for shorts / 0.0-0.214 for longs)
* Red zones: Fake-out risk area - price beyond structural extremes (above 1.0 for shorts / below 0.0 for longs)
* White dashed lines: Individual Fibonacci levels (1.0, 0.882, 0.786, 0.618, 0.5, 0.382, 0.214, 0.118, 0.0)
♦ Imbalance Heatmap
Gray boxes with dotted midlines
Unmitigated imbalances create a visual heatmap. Overlapping imbalances appear darker due to layering.
Combined labels
When multiple imbalances overlap, labels show confluence (e.g., "FVG + OB", "Vol + LP + Wick")
Types displayed : Vol (Volume), FVG (Fair Value Gap), OB (Order Block), BB (Breaker Block), LP (Liquidity Pool), Wick, KZ (Kill Zone)
♦ Momentum Indicators
* Red line: EMA 14
* Yellow line: EMA 21
* Small triangles on price: Crossover signals - red triangle (bearish crossover), green triangle (bullish crossover) when occurring within discount zones
♦ Structure Change Markers
* Labels with checkmarks/crosses: ChoCH (Change of Character) and BoS (Break of Structure) events (Green label with ✓: Bullish ChoCH or BoS, Red label with ✗: Bearish ChoCH or BoS)
♦ Trade Planning Lines (when entry price is set)
* Blue horizontal line: Entry price
* Green dashed lines: TP1 and TP2
* Green solid line: TP3 (final target)
* Red horizontal line: Stop Loss level
TP levels and SL are calculated based on the structure range, entry price, and mapped trading zone, and aim to achieve a minimum risk: reward ratio of 1:1.5 (R:R)
♦ Colored background zones:
Green shading between entry and TP3 (profit zone), red shading between entry and SL (loss zone)
♦ Reference Levels
* Orange dotted lines with labels: Daily Pivot Points (PP, R1-R3, S1-S3)
* Purple dotted lines with labels: ADR High and ADR Low projections
* Cyan dotted lines with labels: DO (Daily Open), PDH (Previous Day High), PDL (Previous Day Low)
♦ Session Backgrounds (optional)
* Yellow shaded box: Asian session (19:00-00:00 NY time)
* Blue shaded box: London session (02:00-05:00 NY time)
* Green shaded box: NY AM session (09:30-11:00 NY time)
* Orange shaded box: NY PM session (13:30-16:00 NY time)
♦ Trade Summary Table (top-right corner)
Displays a complete trade plan with sections:
* Sanity Check: Plan validation status
* Setup: Trade type, leverage, entry price, position size
* Take Profit: TP1, TP2, TP3 with prices, percentages, and quantity splits
* Stop Loss: SL price and type
* Performance: Potential profit/loss, ROI, and risk-to-reward ratio
♦ HTF Candle Overlay (optional, displayed to the right of the current price)
* Larger candlesticks representing higher timeframe price action
* Green bodies: Bullish HTF candles
* Red bodies: Bearish HTF candles
* Label shows selected timeframe (e.g., "HTF→ D" for daily)
♦ Legend Table (bottom-right corner)
Quick reference guide explaining all symbol abbreviations and color codes used on the chart.
-----------------------------------------------------------------
Methodology & Calculation Details
This indicator consolidates multiple ICT/SMC analytical components into a single integrated system. While individual elements could be created separately, this integration provides automated coordination between components , consistency, and reduces chart complexity.
Structure Detection External and internal pivots
Are identified using fractal pivot analysis with configurable lookback periods (default: 20 bars for both). A pivot high is confirmed when the high at the pivot bar exceeds all highs within the lookback range on both sides. Pivot lows use inverse logic. Structure lines connect validated pivots, with color coding based on price direction (higher highs/higher lows = bullish, lower highs/lower lows = bearish).
Fibonacci Retracement Calculation
Users define two swing points via date/time inputs. The indicator calculates the price range between these points and applies standard Fibonacci ratios (0.0, 0.118, 0.214, 0.382, 0.5, 0.618, 0.786, 0.882, 1.0, plus extensions at 1.118, 1.272, -0.118, -0.272). Zone classification is based on ICT discount/premium principles: 0.618-1.0 range for bearish setups, 0.0-0.382 for bullish setups.
Imbalance Identification
Volume Imbalances : Detected using PVSRA (Price, Volume, Support, Resistance Analysis) methodology. Candles are classified based on the percentile ranking of volume and price range over a 1344-bar lookback period. Type 1 imbalances require ≥95th percentile in both volume and range; Type 2 requires ≥85th percentile. Additional filters include body-to-range ratio (≥50% for Type 1, ≥30% for Type 2) and ATR validation.
Fair Value Gaps (FVG) : Identified when a three-candle sequence shows a price gap: low > high for bullish FVG, high < low for bearish FVG. The middle candle must close beyond the gap edge. Mitigation occurs when the price retraces into the gap.
Order Blocks (OB) : Detected by identifying the last opposing candle before a significant price move. When price breaks a swing high/low, the algorithm scans backwards to find the candle with the highest high (bearish OB) or lowest low (bullish OB) before the breakout. When an OB is breached, it converts to a Breaker Block (BB).
Liquidity Pools (LP) : Identified by detecting equal highs or equal lows using a tolerance threshold based on ATR. Pivot highs/lows within this tolerance range are grouped. Equal highs create Buy-Side Liquidity (BSL) zones above the level; equal lows create Sell-Side Liquidity (SSL) zones below the level.
Wick Imbalances: Flagged when a candle's wick exceeds 1.0x ATR and comprises >50% of the total candle range. These represent rapid rejections or absorption events.
Kill Zone Liquidity: Tracks the high/low range during specific ICT-defined sessions (Asian: 19:00-00:00 NY, London: 02:00-05:00 NY, NY AM: 09:30-11:00 NY). At session close, BSL and SSL zones are created above/below the session range.
Change of Character (ChoCH) & Break of Structure (BoS)
ChoCH is detected when price breaks counter to the established structure (bearish structure broken upward = bullish ChoCH; bullish structure broken downward = bearish ChoCH). BoS occurs when price breaks in the direction of the established trend (bearish structure breaking lower = bearish BoS; bullish structure breaking higher = bullish BoS).
Trade Calculations
Stop Loss and Take Profit levels are calculated based on the entry position within the Fibonacci zone structure:
* Premium entries (0.786-1.0 for shorts / 0.0-0.214 for longs): SL at 1.118/-0.118 extension, TP structure weighted toward zone extremes
* Golden entries (0.618-0.786 for shorts / 0.214-0.382 for longs): SL at 1.0/0.0 boundary, TP structure balanced across range
Risk-to-reward ratios are calculated as blended values across all three take profit levels, weighted by position quantity splits.
Reference Level Calculations
* Pivot Points: Standard formula using previous day's high, low, and close: PP = (H + L + C) / 3
* Support/Resistance: R1 = 2×PP - L, S1 = 2×PP - H, with R2/S2 and R3/S3 calculated using range extensions
* ADR: 14-period simple moving average of daily high-low range, projected from current day's extremes
Momentum Analysis
EMA 14 and EMA 21 use standard exponential moving average calculations. Crossovers are detected when EMA 14 crosses EMA 21 within user-defined discount zones, with directional confirmation (cross under in bearish discount = short signal; cross over in bullish discount = long signal).
Why This Integration Matters
While components like EMA crossovers, pivot detection, or Fibonacci retracements exist as separate indicators, this system provides:
1. Coordinated Analysis : All components reference the same structural framework (user-defined trading zone)
2. Automated Mitigation Tracking : Imbalances are monitored continuously and removed when mitigated according to ICT principles
3. Contextual Alerts : Notifications are triggered only when conditions align within the defined structural context
4. Trade Parameter Automation : Stop loss and take profit calculations adjust dynamically based on entry positioning within the structure
5. Consistent Visual Display : All elements use a unified color scheme, labeling system, and z-order layering. This eliminates visual conflicts that occur when stacking multiple independent indicators (overlapping lines, label collisions, inconsistent transparency levels, conflicting color schemes).
This consolidation reduces the need to manually coordinate 8-10 separate indicators, eliminates redundant calculations across disconnected tools, and maintains visual clarity even when all components are displayed simultaneously.
-----------------------------------------------------------------
Disclaimer
1. Indicator Functionality and Purpose
This indicator is solely a technical analysis tool built upon established methodologies (Smart Money Concepts/ICT) and statistical calculations (Pivots, Fibonacci, EMAs). It is designed to assist experienced traders in visualizing complex data, streamlining the analytical workflow, and automating conditional alerting.
The indicator is NOT:
♦ Financial Advice: It does not provide personalized investment recommendations, solicited advice, or instruction on buying, selling, or holding any financial instrument.
♦ A Guarantee of Profit: The presence of a signal, alert, or trade plan output by this tool does not guarantee that any trade will be profitable.
♦ A Predictor of Future Prices: The tool calculates probabilities and potential scenarios based on historical data and current structure; it does not predict future market movements.
2. General Trading Risks and Capital Loss
♦ All trading involves substantial risk of loss. You may lose some or all of your initial capital. Leveraged products, such as futures, CFDs, and margin trading, carry a high degree of risk and are not suitable for all investors.
♦ Risk Acknowledgment: By using this indicator, you acknowledge and accept that you are solely responsible for all trading decisions, and you bear the full risk of any resulting profit or loss.
♦ Risk Management is Crucial: This indicator is an analytical tool only. You must employ independent risk management techniques (position sizing, stop-loss orders) tailored to your personal financial situation and risk tolerance.
3. Calculation Limitations and Non-Real-Time Data
The calculations performed by this indicator are based on the data provided by your charting platform (e.g., TradingView).
♦ Data Accuracy: The accuracy of the outputs (e.g., Price Delivery Arrays, Pivots, P&L projections) is dependent on the accuracy and real-time nature of the underlying market data feed.
♦ Latencies: Trade alerts and signals may be subject to minor delays due to server processing, internet connectivity, or charting platform performance. Do not rely solely on alerts for execution.
♦ Backtesting and Performance: Any depiction of past performance, including data visible on the chart, is not indicative of future results. Trading results will vary based on market conditions, liquidity, and execution speed.
4. Software and Platform Disclaimer
"As Is" Basis: The indicator is provided on an "as is" basis without warranties of any kind, whether express or implied. The author does not guarantee the script will be error-free or operate without interruption.
Third-Party Integration: This indicator is not affiliated with, endorsed by, or connected to TradingView, 3Commas, or any other broker or execution platform. All third-party names are trademarks of their respective owners. The formatting of the Trade Summary Table for 3Commas is for user convenience only.
5. Required Competency (User Responsibility)
This indicator is built on the assumption that the user is an experienced trader with a working understanding of the complex concepts being visualized (ICT/SMC, FVG, Order Blocks, Liquidity, etc.). The indicator does not teach these concepts.
You Must Always Do Your Own Research (DYOR) before making any trading decision based on signals or visualization provided by this tool.
By installing and using this indicator, you explicitly agree to these terms and assume full responsibility for all trading activity.
Cerca negli script per "fvg"

ICT PDA - Gold & BTC (QuickScalp Bias/FVG/OB/OTE + Alerts)What this script does
This indicator implements a complete ICT Price Delivery Algorithm (PDA) workflow tailored for XAUUSD and BTCUSD. It combines HTF bias, OTE zones, Fair Value Gaps, Order Blocks, micro-BOS confirmation, and liquidity references into a single, cohesive tool with early and final alerts. The script is not a mashup for cosmetic plotting; each component feeds the next decision step.
Why this is original/useful
Symbol-aware impulse filter: A dynamic displacement threshold kTune adapts to Gold/BTC volatility (body/ATR vs. per-symbol factor), reducing noise on fast markets without hiding signals.
Scalping preset: “Quick Clean” mode limits drawings to the most recent bars and keeps only the latest FVG/OB zones for a clear chart.
Three display modes: Full, Clean, and Signals-Only to match analysis vs. execution.
Actionable alerts: Early heads-up when price enters OTE in the HTF bias direction, and Final alerts once mitigation + micro-break confirm the setup.
How it works (high-level logic)
HTF Bias: Uses request.security() on a user-selected timeframe (e.g., 240m) and EMA filter. Bias = close above/below HTF EMA.
Dealing Range & OTE: Recent swing high/low (pivot length configurable) define the range; OTE (62–79%) boxes are drawn contextually for up/down ranges.
Displacement: A candle’s body/ATR must exceed kTune and break short-term structure (displacement up/down).
FVG: 3-bar imbalance (bull: low > high ; bear: high < low ). Latest gaps are tracked and extended.
Order Blocks: Last opposite candle prior to a qualifying displacement that breaks recent highs/lows; zones are drawn and extended.
Entry & Alerts:
Long: Bullish bias + price inside buy-OTE + mitigation of a bullish FVG or OB + micro BOS up → “PDA Long (Final)”.
Short: Bearish bias + price inside sell-OTE + mitigation of a bearish FVG or OB + micro BOS down → “PDA Short (Final)”.
Early Alerts: Trigger as soon as price enters OTE in the direction of the active bias.
Inputs & controls (key ones)
Bias (HTF): timeframe minutes, EMA length.
Structure: ATR length, Impulse Threshold (Body/ATR), swing pivot length, OB look-back.
OTE/FVG/OB/LP toggles: show/hide components.
Auto-Tune: per-symbol factors for Gold/BTC + manual tweak.
Display/Performance: View Mode, keep-N latest FVG/OB, limit drawings to last N bars.
Recommended usage (scalping)
Timeframes: Execute on M1–M5 with HTF bias from 120–240m.
Defaults (starting point): ATR=14, Impulse Threshold≈1.6; Gold factor≈1.05, BTC factor≈0.90; Keep FVG/OB=2; last 200–300 bars; View Mode=Clean.
Workflow: Wait for OTE in bias direction → see mitigation (FVG/OB) → confirm with micro BOS → manage risk to nearest liquidity (prev-day H/L or recent swing).
Alerts available
“PDA Early Long/Short”
“PDA Long (Final)” / “PDA Short (Final)”
Attach alerts on “Any alert() function call” or the listed conditions.
Chart & screenshots
Please include symbol and timeframe on screenshots. The on-chart HUD shows the script name and state to help reviewers understand context.
Limitations / notes
This is a discretionary framework. Signals can cluster during news or extreme volatility; use your own risk management. No guarantee of profitability.
Changelog (brief)
v1.2 QuickScalp: added Quick Clean preset, safer array handling, symbol-aware impulse tuning, display modes.
------------------------------
ملخص عربي:
المؤشر يطبق تسلسل PDA عملي للذهب والبتكوين: تحيز من فريم أعلى، مناطق OTE، فجوات FVG، بلوكات أوامر OB، وتأكيد micro-BOS، مع تنبيهات مبكرة ونهائية. تمت إضافة وضع “Quick Clean” لتقليل العناصر على الشارت وحساسية إزاحة تتكيّف مع الأصل. للاستخدام كسكالب: نفّذ على M1–M5 مع تحيز 120–240 دقيقة، وابدأ من الإعدادات المقترحة بالأعلى. هذا إطار سلوكي وليس توصية مالية.

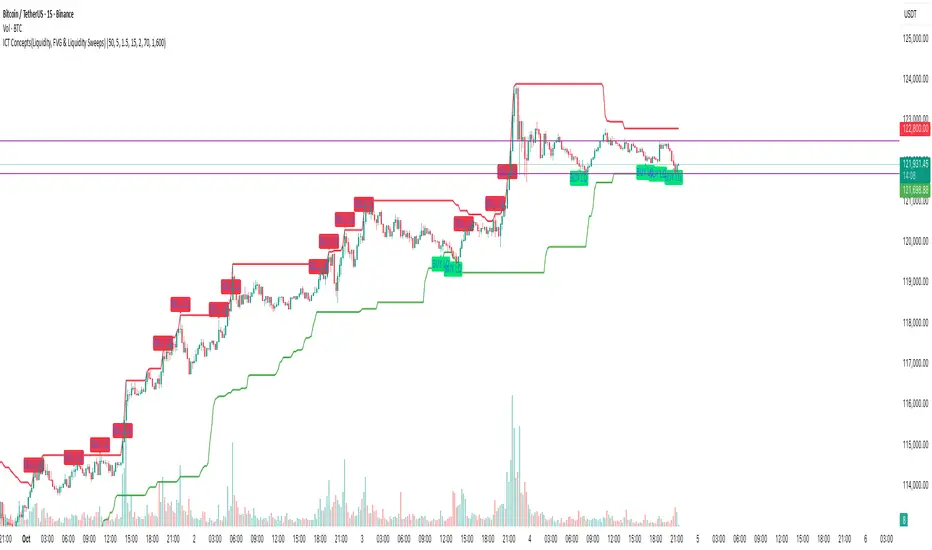
ICT Concepts(Liquidity, FVG & Liquidity Sweeps)📄 Description:
A Smart Money Concept (SMC)-based utility that blends ICT-style Liquidity Sweeps, Fair Value Gap (FVG) mapping, and Swing Structure proxies – designed for traders seeking clean precision in price imbalance analysis.
⸻
🔍 1. What This Script Does
T his indicator brings together three core Institutional Concepts:
• Liquidity Sweep Detection : Identifies buy/sell-side liquidity grabs (fakeouts) confirmed by volume spikes – a common precursor to institutional order flow shifts.
• Fair Value Gaps (FVGs) : Highlights inefficiencies between price legs using strict ICT-style 3-candle or gap-based rules. These are areas institutions often revisit.
• Swing Structure Proxy (OB Mapping) : Tracks dynamic swing highs/lows to act as proxy zones for potential order blocks and structural boundaries.
It also includes a cooldown-based signal filtering engine to prevent overfitting and noise, helping traders avoid false positives in choppy markets.
⚙️ 2. How It Works (Core Logic)
✅ A. Liquidity Sweep Engine
• Looks back N bars to find Equal Highs or Equal Lows.
• Triggers a signal only if price sweeps the level and closes on the other side with a volume spike.
• Customizable volume threshold (e.g., 1.5x average volume).
• Includes a signal cooldown period to reduce clutter and boost quality.
Bullish Sweep = Price dips below equal lows but closes higher
Bearish Sweep = Price spikes above equal highs but closes lower
Visuals: Signal arrows with alerts (BUY LQ / SELL LQ)
⸻
✅ B. Fair Value Gap (FVG) Zones
• Detects FVGs using:
• Sequential logic: Low > High (bullish), High < Low (bearish)
• Gap logic: Open gaps at bar open
• Dynamic box drawing:
• Automatically extends FVG zones until price fully closes through them.
• Different color coding for bullish (teal) and bearish (orange) gaps.
• Customizable:
• Opacity control
• Option to include/exclude gap-based FVGs
• Hide filled zones
• Limit total zones rendered (for performance)
⸻
✅ C. Swing High/Low Structure
• Uses a lookback period to find latest swing high/low levels.
• Acts as a proxy for Order Block zones or structural shift reference points.
• Plotted as red (high) and green (low) lines.
⸻
🚀 3. How to Use It
• Scalpers and Intraday Traders can use Liquidity Sweep + FVG Confluence to time reversals or catch early entries into trend continuation moves.
• Swing Traders can observe swing OB proxies and recent FVG zones to frame directional bias and target zones.
• Volume-Aware Traders benefit from the volume filter that confirms sweeps are meaningful – not just random stop hunts.
🔔 Set alerts on:
• Bullish Liquidity Sweeps
• Bearish Liquidity Sweeps
You can use this in combination with your own trend filters, or even confluence it with Order Blocks, VWAP, or EMA trend tools.
⸻
💡 What Makes It Original?
• The script doesn’t merely combine standard tools — it builds a cohesive ICT-style detection system using:
• A custom volume-confirmed liquidity sweep filter
• Dynamic FVG rendering with filled logic + performance optimization
• Visual hierarchy to avoid clutter: clean line plots, contextual boxes, and conditional signals
• Highly customizable yet lightweight, making it suitable for fast-paced decision making.
⸻
✅ Notes
• Invite-only script for serious traders interested in Smart Money and ICT concepts.
• Does not repaint signals.
• All visuals are dynamically managed for clarity and performance.
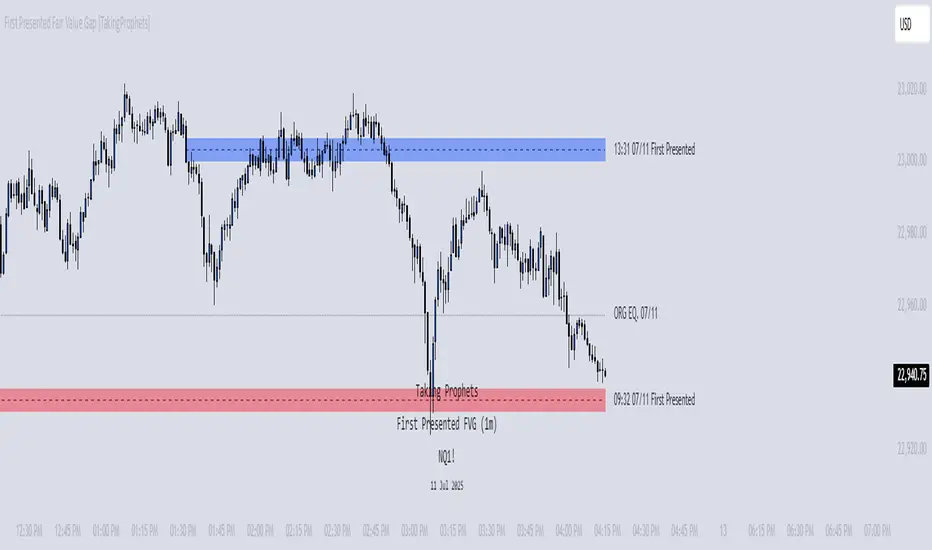
First Presented Fair Value Gap [TakingProphets]🧠 Indicator Purpose:
The "First Presented Fair Value Gap" (FPFVG) by Taking Prophets is a precision tool designed for traders utilizing Inner Circle Trader (ICT) concepts. It automatically detects and highlights the first valid Fair Value Gap (FVG) that forms between 9:30 AM and 10:00 AM New York time — one of the most critical windows in ICT-based trading frameworks.
It also plots the Opening Range Equilibrium (the average of the previous day's 4:14 PM close and today's 9:30 AM open) — a key ICT reference point for premium/discount analysis.
🌟 What Makes This Indicator Unique:
This script is highly specialized for early session trading and offers:
Automatic Detection: Finds the first Fair Value Gap after the 9:30 AM NYSE open.
Clear Visualization: Highlights the FVG zone and labels it with optional time stamps.
Equilibrium Line: Plots the Opening Range Equilibrium for instant premium/discount context.
Time-Sensitive Logic: Limits detection to the most volatile early session (9:30 AM - 10:00 AM).
Extension Options: You can extend both the FVG box and Equilibrium line out to 3:45 PM (end of major session liquidity).
⚙️ How the Indicator Works (Detailed):
Pre-Market Setup:
Captures the previous day's 4:14 PM close.
Captures today's 9:30 AM open.
Calculates the Equilibrium (midpoint between the two).
After 9:30 AM (New York Time):
Monitors each 1-minute candle for the creation of a Fair Value Gap:
Bullish FVG: Low of the current candle is above the high two candles ago.
Bearish FVG: High of the current candle is below the low two candles ago.
The first valid gap is boxed and optionally labeled.
Post-Detection Management:
The FVG box and label extend forward in time until 3:45 PM (or the current time, based on settings).
If enabled, the Equilibrium line and label also extend to help with premium/discount analysis.
🎯 How to Use It:
Step 1: Wait for market open (9:30 AM New York time).
Step 2: Watch for the first presented FVG on the 1-minute chart.
Step 3: Use the FPFVG zone to guide entries (retracements, rejections, or breaks).
Step 4: Use the Opening Range Equilibrium to determine premium vs. discount conditions:
Price above Equilibrium = Premium market.
Price below Equilibrium = Discount market.
Best Application:
In combination with ICT Killzones, especially during the London or New York Open.
When framing intraday bias and identifying optimal trade locations based on liquidity theory.
🔎 Underlying Concepts:
Fair Value Gaps: Price imbalances where liquidity is likely inefficient and future rebalancing can occur.
Opening Range Equilibrium: Key ICT price anchor used to separate premium and discount conditions post-open.
Time-Gated Setup: Limits focus to early session price action, aligning with inner circle trader timing models.
🎨 Customization Options:
FVG color, label visibility, and label size.
Opening Range Equilibrium line visibility and label styling.
Extend lines and boxes to 3:45 PM automatically for full session tracking.
✅ Recommended for:
Traders applying Inner Circle Trader (ICT) models.
Intraday scalpers or day traders trading the New York session open.
Traders who want to frame early session bias and liquidity traps effectively.
Price Action Smart Money Concepts [BigBeluga]THE SMART MONEY CONCEPTS Toolkit
The Smart Money Concepts [ BigBeluga ] is a comprehensive toolkit built around the principles of "smart money" behavior, which refers to the actions and strategies of institutional investors.
The Smart Money Concepts Toolkit brings together a suite of advanced indicators that are all interconnected and built around a unified concept: understanding and trading like institutional investors, or "smart money." These indicators are not just randomly chosen tools; they are features of a single overarching framework, which is why having them all in one place creates such a powerful system.
This all-in-one toolkit provides the user with a unique experience by automating most of the basic and advanced concepts on the chart, saving them time and improving their trading ideas.
Real-time market structure analysis simplifies complex trends by pinpointing key support, resistance, and breakout levels.
Advanced order block analysis leverages detailed volume data to pinpoint high-demand zones, revealing internal market sentiment and predicting potential reversals. This analysis utilizes bid/ask zones to provide supply/demand insights, empowering informed trading decisions.
Imbalance Concepts (FVG and Breakers) allows traders to identify potential market weaknesses and areas where price might be attracted to fill the gap, creating opportunities for entry and exit.
Swing failure patterns help traders identify potential entry points and rejection zones based on price swings.
Liquidity Concepts, our advanced liquidity algorithm, pinpoints high-impact events, allowing you to predict market shifts, strong price reactions, and potential stop-loss hunting zones. This gives traders an edge to make informed trading decisions based on liquidity dynamics.
🔵 FEATURES
The indicator has quite a lot of features that are provided below:
Swing market structure
Internal market structure
Mapping structure
Adjustable market structure
Strong/Weak H&L
Sweep
Volumetric Order block / Breakers
Fair Value Gaps / Breakers (multi-timeframe)
Swing Failure Patterns (multi-timeframe)
Deviation area
Equal H&L
Liquidity Prints
Buyside & Sellside
Sweep Area
Highs and Lows (multi-timeframe)
🔵 BASIC DEMONSTRATION OF ALL FEATURES
1. MARKET STRUCTURE
The preceding image illustrates the market structure functionality within the Smart Money Concepts indicator.
➤ Solid lines: These represent the core indicator's internal structure, forming the foundation for most other components. They visually depict the overall market direction and identify major reversal points marked by significant price movements (denoted as 'x').
➤ Internal Structure: These represent an alternative internal structure with the potential to drive more rapid market shifts. This is particularly relevant when a significant gap exists in the established swing structure, specifically between the Break of Structure (BOS) and the most recent Change of High/Low (CHoCH). Identifying these formations can offer opportunities for quicker entries and potential short-term reversals.
➤ Sweeps (x): These signify potential turning points in the market where liquidity is removed from the structure. This suggests a possible trend reversal and presents crucial entry opportunities. Sweeps are identified within both swing and internal structures, providing valuable insights for informed trading decisions.
➤ Mapping structure: A tool that automatically identifies and connects significant price highs and lows, creating a zig-zag pattern. It visualizes market structure, highlights trends, support/resistance levels, and potential breakouts. Helps traders quickly grasp price action patterns and make informed decisions.
➤ Color-coded candles based on market structure: These colors visually represent the underlying market structure, making it easier for traders to quickly identify trends.
➤ Extreme H&L: It visualizes market structure with extreme high and lows, which gives perspective for macro Market Structure.
2. VOLUMETRIC ORDER BLOCKS
Order blocks are specific areas on a financial chart where significant buying or selling activity has occurred. These are not just simple zones; they contain valuable information about market dynamics. Within each of these order blocks, volume bars represent the actual buying and selling activity that took place. These volume bars offer deeper insights into the strength of the order block by showing how much buying or selling power is concentrated in that specific zone.
Additionally, these order blocks can be transformed into Breaker Blocks. When an order block fails—meaning the price breaks through this zone without reversing—it becomes a breaker block. Breaker blocks are particularly useful for trading breakouts, as they signal that the market has shifted beyond a previously established zone, offering opportunities for traders to enter in the direction of the breakout.
Here's a breakdown:
➤ Bear Order Blocks (Red): These are zones where a lot of selling happened. Traders see these areas as places where sellers were strong, pushing the price down. When the price returns to these zones, it might face resistance and drop again.
➤ Bull Order Blocks (Green): These are zones where a lot of buying happened. Traders see these areas as places where buyers were strong, pushing the price up. When the price returns to these zones, it might find support and rise again.
These Order Blocks help traders identify potential areas for entering or exiting trades based on past market activity. The volume bars inside blocks show the amount of trading activity that occurred in these blocks, giving an idea of the strength of buying or selling pressure.
➤ Breaker Block: When an order block fails, meaning the price breaks through this zone without reversing, it becomes a breaker block. This indicates a significant shift in market liquidity and structure.
➤ A bearish breaker block occurs after a bullish order block fails. This typically happens when there's an upward trend, and a certain level that was expected to support the market's rise instead gives way, leading to a sharp decline. This decline indicates that sellers have overcome the buyers, absorbing liquidity and shifting the sentiment from bullish to bearish.
Conversely, a bullish breaker block is formed from the failure of a bearish order block. In a downtrend, when a level that was expected to act as resistance is breached, and the price shoots up, it signifies that buyers have taken control, overpowering the sellers.
3. FAIR VALUE GAPS:
A fair value gap (FVG), also referred to as an imbalance, is an essential concept in Smart Money trading. It highlights the supply and demand dynamics. This gap arises when there's a notable difference between the volume of buy and sell orders. FVGs can be found across various asset classes, including forex, commodities, stocks, and cryptocurrencies.
FVGs in this toolkit have the ability to detect raids of FVG which helps to identify potential price reversals.
Mitigation option helps to change from what source FVGs will be identified: Close, Wicks or AVG.
4. SWING FAILURE PATTERN (SFP):
The Swing Failure Pattern is a liquidity engineering pattern, generally used to fill large orders. This means, the SFP generally occurs when larger players push the price into liquidity pockets with the sole objective of filling their own positions.
SFP is a technical analysis tool designed to identify potential market reversals. It works by detecting instances where the price briefly breaks a previous high or low but fails to maintain that breakout, quickly reversing direction.
How it works:
Pattern Detection: The indicator scans for price movements that breach recent highs or lows.
Reversal Confirmation: If the price quickly reverses after breaching these levels, it's identified as an SFP.
➤ SFP Display:
Bullish SFP: Marked with a green symbol when price drops below a recent low before reversing upwards.
Bearish SFP: Marked with a red symbol when price rises above a recent high before reversing downwards.
➤ Deviation Levels: After detecting an SFP, the indicator projects white lines showing potential price deviation:
For bullish SFPs, the deviation line appears above the current price.
For bearish SFPs, the deviation line appears below the current price.
These deviation levels can serve as a potential trading opportunity or areas where the reversal might lose momentum.
With Volume Threshold and Filtering of SFP traders can adjust their trading style:
Volume Threshold: This setting allows traders to filter SFPs based on the volume of the reversal candle. By setting a higher volume threshold, traders can focus on potentially more significant reversals that are backed by higher trading activity.
SFP Filtering: This feature enables traders to filter SFP detection. It includes parameters such as:
5. LIQUIDITY CONCEPTS:
➤ Equal Lows (EQL) and Equal Highs (EQH) are important concepts in liquidity-based trading.
EQL: A series of two or more swing lows that occur at approximately the same price level.
EQH: A series of two or more swing highs that occur at approximately the same price level.
EQLs and EQHs are seen as potential liquidity pools where a large number of stop loss orders or limit orders may be clustered. They can be used as potential reverse points for trades.
This multi-period feature allows traders to select less and more significant EQL and EQH:
➤ Liquidity wicks:
Liquidity wicks are a minor representation of a stop-loss hunt during the retracement of a pivot point:
➤ Buy and Sell side liquidity:
The buy side liquidity represents a concentration of potential buy orders below the current price level. When price moves into this area, it can lead to increased buying pressure due to the execution of these orders.
The sell side liquidity indicates a pool of potential sell orders below the current price level. Price movement into this area can result in increased selling pressure as these orders are executed.
➤ Sweep Liquidation Zones:
Sweep Liquidation Zones are crucial for understanding market structure and potential future price movements. They provide insights into areas where significant market participants have been forced out of their positions, potentially setting up new trading opportunities.
🔵 USAGE & EXAMPLES
The core principle behind the success of this toolkit lies in identifying "confluence." This refers to the convergence of multiple trading indicators all signaling the same information at a specific point or area. By seeking such alignment, traders can significantly enhance the likelihood of successful trades.
MS + OBs
The chart illustrates a highly bullish setup where the price is rejecting from a bullish order block (POC), while simultaneously forming a bullish Swing Failure Pattern (SFP). This occurs after an internal structure change, marked by a bullish Change of Character (CHoCH). The price broke through a bearish order block, transforming it into a breaker block, further confirming the bullish momentum.
The combination of these elements—bullish order blocks, SFP, and CHoCH—creates a powerful bullish signal, reinforcing the potential for upward movement in the market.
SFP + Bear OB
This chart above displays a bearish setup with a high probability of a price move lower. The price is currently rejecting from a bear order block, which represents a key resistance area where significant selling pressure has previously occurred. A Swing Failure Pattern (SFP) has also formed near this bear order block, indicating that the price briefly attempted to break above a recent high but failed to sustain that upward movement. This failure suggests that buyers are losing momentum, and the market could be preparing for a move to the downside.
Additionally, we can toggle on the Deviation Area in the SFP section to highlight potential levels where price deviation might occur. These deviation areas represent zones where the price is likely to react after the Swing Failure Pattern:
BUY – SELL sides + EQL
The chart showcases a bullish setup with a high probability of price breaking out of the current sell-side resistance level. The market structure indicates a formation of Equal Lows (EQL), which often suggests a build-up of liquidity that could drive the price higher.
The presence of strong buy-side pressure (69%), indicated by the green zone at the bottom, reinforces this bullish outlook. This area represents a key support zone where buyers are outpacing sellers, providing the foundation for a potential upward breakout.
EQL + Bull ChoCh
This chart illustrates a potential bullish setup, driven by the formation of Equal Lows (EQL) followed by a bullish Change of Character (CHoCH). The presence of Equal Lows often signals a liquidity build-up, which can lead to a reversal when combined with additional bullish signals.
Liquidity grab + Bull ChoCh + FVGs
This chart demonstrates a strong bullish scenario, where several important market dynamics are at play. The price begins its upward momentum from Liquidity grab following a bullish Change of Character (CHoCH), signaling the transition from a bearish phase to a bullish one.
As the price progresses, it performs liquidity grabs, which serve to gather the necessary fuel for further movement. These liquidity grabs often occur before significant price surges, as large market participants exploit these areas to accumulate positions before pushing the price higher.
The chart also highlights a market imbalance area, showing strong momentum as the price moves swiftly through this zone.
In this examples, we see how the combination of multiple “smart money” tools helps identify a potential trade opportunities. This is just one of the many scenarios that traders can spot using this toolkit. Other combinations—such as order blocks, liquidity grabs, fair value gaps, and Swing Failure Patterns (SFPs)—can also be layered on top of these concepts to further refine your trading strategy.
🔵 SETTINGS
Window: limit calculation period
Swing: limit drawing function
Mapping structure: show structural points
Algorithmic Logic: (Extreme-Adjusted) Use max high/low or pivot point calculation
Algorithmic loopback: pivot point look back
Show Last: Amount of Order block to display
Hide Overlap: hide overlapping order blocks
Construction: Size of the order blocks
Fair value gaps: Choose between normal FVG or Breaker FVG
Mitigation: (close - wick - avg) point to mitigate the order block/imbalance
SFP lookback: find a higher / lower point to improve accuracy
Threshold: remove less relevant SFP
Equal H&L: (short-mid-long term) display longer term
Liquidity Prints: Shows wicks of candles where liquidity was grabbed
Sweep Area: Identify Sweep Liquidation areas
By combining these indicators in one toolkit, traders are equipped with a comprehensive suite of tools that address every angle of the Smart Money Concept. Instead of relying on disparate tools spread across various platforms, having them integrated into a single, cohesive system allows traders to easily see confluence and make more informed trading decisions.

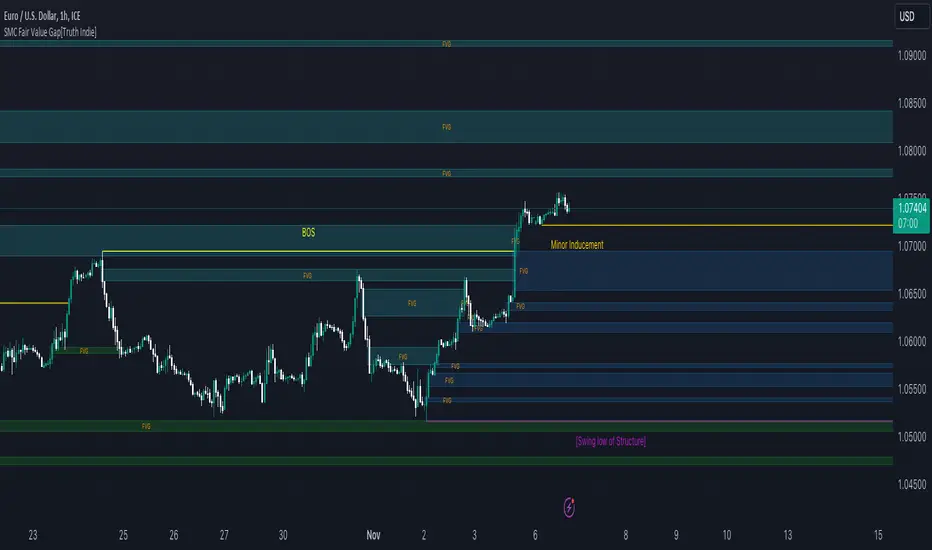
SMC Fair Value Gap[Truth Indie]FVG (Fair Value Gap)
FVG is another component used in the SMC Concept.
This indicator will help you quickly identify FVG along with customizable market structure.
HISTORY FVG SETTING
-You can choose to show or hide the FVG (Fair Value Gap).
-You can choose to expand the History FVG to the right.
-You can change the number of History Internal FVG.
-You can change the number of History External FVG.
FVG Setting
-You can adjust the strength of the imbalance candlestick.
An example:
The imbalance candlestick in the image has a strength of 124.6 times compared to the previous candlestick.
FVG TEXT/COLOR SETUP
-You can change the name of FVG.
-Adjust the font size and color.
-Adjust the color of the FVG BOX and History BOX.
Market Structure
Comprising the process of breaking the price structure, resulting in BOS (Breakout of Structure) or CHoCH (Change of Character High), and creating new High or Low based on the price structure.
Structure Setting
1.You can choose to show or hide the swing of the structure.
2.Adjust the font size and color.
3.When the market forms a price structure with High and Low, when the price moves to disrupt the structure in either direction, it will lead to BOS or CHoCH, resulting in a new High or Low. You can adjust the method of breaking the structure using the close, high, or low.
Miner Inducement Setting
4.You can choose to show or hide the Minor Inducement.
5.You can choose to show or hide the Fibo Minor Inducement.
6.When price break the price structure, a High or Low will be formed on one side, and it will lead to an Inducement Swing. When the price moves and collides, it will create a price range of High and Low. You can adjust the method of breaking the structure using the close, high, or low.
7.There is an option for testing Fibonacci (Fibo). Its function is similar to the Inducement Swing. You can adjust the Fibonacci settings.
8.Adjust the length of the Minor Inducement swing.
- In this section, it functions similarly to Pivot Points High Low, capturing swings based on the specified length.
9.Adjust Fibo Minor Inducement.
- Fibo IDM helps filter Swing IDM.
- When the market is in an uptrend, IDM will be lower than Fibo IDM.
- When the market is in a downtrend, IDM will be higher than Fibo IDM.
-Adjust the font size.
-Adjust the color of the Fibo Minor Inducement.
-Adjust the color of the Fibo for break.
-Show or hide the Label Swing.
An example of a market in a downtrend.
1. Fibo IDM filters out Swing IDM that is above the Fibo line.
2. IDM occurs above the Fibo line in a downtrending market and below the Fibo line in an uptrending market.
3. An example of the Pivot Points High Low indicator with the length set to 3.
Premium & Discount Zone
-The Premium & Discount Zone will appear based on the current price structure. It helps you see the price zones you are interested in.
-You can adjust the %Premium & Discount as needed.
-Show or hide the premium & discount zone.
-Adjust the font size.
-Adjust the color of the premium & discount zone.
Fair Value Gap Signals [Kodexius]Fair Value Gap Signals is an advanced market structure tool that automatically detects and tracks Fair Value Gaps (FVGs), evaluates the quality of each gap, and highlights high value reaction zones with visual metrics and signal markers.
The script is designed for traders who focus on liquidity concepts, order flow and mean reversion. It goes beyond basic FVG plotting by continuously monitoring how price interacts with each gap and by quantifying three key aspects of each zone:
-Entry velocity inside the gap
-Volume absorption during tests
-Structural integrity and depth of penetration
The result is a dynamic, information rich visualization of which gaps are being respected, which are being absorbed, and where potential reversals or continuations are most likely to occur.
All visual elements are configurable, including the maximum number of visible gaps per direction, mitigation method (close or wick) and an ATR based filter to ignore insignificant gaps in low volatility environments.
🔹 Features
🔸 Automated Fair Value Gap Detection
The script detects both bullish and bearish FVGs based on classic three candle logic:
Bullish FVG: current low is strictly above the high from two bars ago
Bearish FVG: current high is strictly below the low from two bars ago
🔸 ATR Based Gap Filter
To avoid clutter and low quality signals, the script can ignore very small gaps using an ATR based filter.
🔸Per Gap State Machine and Lifecycle
Each gap is tracked with an internal status:
Fresh: gap has just formed and has not been tested
Testing: price is currently trading inside the gap
Tested: gap was tested and left, waiting for a potential new test
Rejected: price entered the gap and then rejected away from it
Filled: gap is considered fully mitigated and no longer active
This state machine allows the script to distinguish between simple touches, multiple tests and meaningful reversals, and to trigger different alerts accordingly.
🔸 Visual Ranking of Gaps by Metrics
For each active gap, three additional horizontal rank bars are drawn on top of the gap area:
Rank 1 (Vel): maximum entry velocity inside the gap
Rank 2 (Vol): relative test volume compared to average volume
Rank 3 (Dpt): remaining safety of the gap based on maximum penetration depth
These rank bars extend horizontally from the creation bar, and their length is a visual score between 0 and 1, scaled to the age of the gap. Longer bars represent stronger or more favorable conditions.
🔸Signals and Rejection Markers
When a gap shows signs of rejection (price enters the gap and then closes away from it with sufficient activity), the script can print a signal label at the reaction point. These markers summarize the internal metrics of the gap using a tooltip:
-Velocity percentage
-Volume percentage
-Safety score
-Number of tests
🔸 Flexible Mitigation Logic (Close or Wick)
You can choose how mitigation is defined via the Mitigation Method input:
Close: the gap is considered filled only when the closing price crosses the gap boundary
Wick: a full fill is detected as soon as any wick crosses the gap boundary
🔸 Alert Conditions
-New FVG formed
-Price entering a gap (testing)
-Gap fully filled and invalidated
-Rejection signal generated
🔹Calculations
This section summarizes the main calculations used under the hood. Only the core logic is covered.
1. ATR Filter and Gap Size
The script uses a configurable ATR length to filter out small gaps. First the ATR is computed:
float atrVal = ta.atr(atrLength)
Gap size for both directions is then measured:
float gapSizeBull = low - high
float gapSizeBear = low - high
If useAtrFilter is enabled, gaps smaller than atrVal are ignored. This ties the minimum gap size to the current volatility regime.
2. Fair Value Gap Detection
The basic FVG conditions use a three bar structure:
bool fvgBull = low > high
bool fvgBear = high < low
For bullish gaps the script stores:
-top as low of the current bar
-bottom as high
For bearish gaps:
-top as high of the current bar
-bottom as low
This defines the price range that is considered the imbalance area.
3. Depth and Safety Score
Depth measures how far price has penetrated into the gap since its creation. For each bar, the script computes a currentDepth and updates the maximum depth:
float currentDepth = 0.0
if g.isBullish
if l < g.top
currentDepth := g.top - l
else
if h > g.bottom
currentDepth := h - g.bottom
if currentDepth > g.maxDepth
g.maxDepth := currentDepth
The safety score expresses how much of the gap remains intact:
float depthRatio = g.maxDepth / gapSize
float safetyScore = math.max(0.0, 1.0 - depthRatio)
safetyScore near 1: gap is mostly untouched
safetyScore near 0: gap is mostly or fully filled
4. Velocity Metric
Velocity captures how aggressively price moves inside the gap. It is based on the body to range ratio of each bar that trades within the gap and rewards bars that move in the same direction as the gap:
float barRange = h - l
float bodyRatio = math.abs(close - open) / barRange
float directionBonus = 0.0
if g.isBullish and close > open
directionBonus := 0.2
else if not g.isBullish and close < open
directionBonus := 0.2
float currentVelocity = math.min(bodyRatio + directionBonus, 1.0)
The gap keeps track of the strongest observed value:
if currentVelocity > g.maxVelocity
g.maxVelocity := currentVelocity
This maximum is later used as velScore when building the velocity rank bar.
5. Volume Accumulation and Volume Score
While price is trading inside a gap, the script accumulates the traded volume:
if isInside
g.testVolume += volume
It also keeps track of the number of tests and the volume at the start of the first test:
if g.status == "Fresh"
g.status := "Testing"
g.testCount := 1
g.testStartVolume := volume
An average volume is computed using a 20 period SMA:
float volAvg = ta.sma(volume, 20)
The expected volume is approximated as:
float expectedVol = volAvg * math.max(1, (bar_index - g.index) / 2)
The volume score is then:
float volScore = math.min(g.testVolume / expectedVol, 1.0)
This produces a normalized 0 to 1 metric that shows whether the gap has attracted more or less volume than expected over its lifetime.
6. Rank Bar Scaling
All three scores are projected visually along the time axis as horizontal bars. The script uses the age of the gap in bars as the maximum width:
float maxWidth = math.max(bar_index - g.index, 1)
Then each metric is mapped to a bar length:
int len1 = int(math.max(1, maxWidth * velScore))
g.rankBox1.set_right(g.index + len1)
int len2 = int(math.max(1, maxWidth * volScore))
g.rankBox2.set_right(g.index + len2)
int len3 = int(math.max(1, maxWidth * safetyScore))
g.rankBox3.set_right(g.index + len3)
This creates an intuitive visual representation where stronger metrics produce longer rank bars, making it easy to quickly compare the relative quality of multiple FVGs on the chart.

Multi-Timeframe Fair Value Gap by Vigna📊 Multi-Timeframe Fair Value Gap (FVG) Indicator
This indicator displays Fair Value Gaps (FVGs) from multiple timeframes simultaneously on your chart. FVGs are price gaps that occur when the market moves quickly and skips certain price levels. These gaps tend to be "filled" later and often serve as important support and resistance zones.
🎯 What are Fair Value Gaps?
A Fair Value Gap occurs when:
Bullish FVG: The current low is higher than the high from 2 candles ago (gap upward)
Bearish FVG: The current high is lower than the low from 2 candles ago (gap downward)
⏱️ Supported Timeframes:
1 Hour (1H)
2 Hours (2H)
3 Hours (3H)
4 Hours (4H)
1 Day (1D)
1 Week (1W)
🎨 Features:
✅ All timeframes visible simultaneously
✅ Each timeframe has its own color (bullish & bearish)
✅ Labels show the timeframe of each gap
✅ Automatic deletion when gap is filled
✅ Optional: MidPoint Fill (gap marked as filled at 50%)
✅ Extend right: Gaps extend to the right until filled
✅ All colors fully customizable
⚙️ Settings:
Timeframes: Enable/disable individual timeframes as needed
MidPoint Fill: Mark gap as filled when 50% is reached
Delete On Fill: Automatically remove filled gaps from chart
Label Timeframes: Show labels with timeframe names
Colors: Customize all colors to your preferences
💡 Application:
FVGs often serve as magnetic attraction points for price
Higher timeframe FVGs (4H, 1D, 1W) are typically more significant
Use FVGs as potential entry/exit zones
Combine with other indicators for better confirmation
📈 Recommended Use:
Works best on timeframes from 15min to 1H
Ideal for Forex, Crypto, and Stocks
Especially useful for Swing Trading and Day Trading
🔧 Technical Details:
Uses optimized request.security() calls (12 total, under the 40 limit)
Employs tuple syntax for efficient data fetching
Real-time gap detection and filling mechanism
Memory-efficient array management with var keyword

Direction via Zone Break [by rukich]🟠 OVERVIEW
The indicator shows the direction of movement and zones: SSL, BSL, FVG.
Zones serve as support/resistance and as validation/invalidation of a movement reversal.
🟠 COMPONENTS
The direction of movement is built based on a three-candle swing high (BSL) and swing low (SSL) pattern. If swing high (BSL) and swing low (SSL) are formed, and then an internal swing high/low is formed (depending on the direction of movement), then in case the initial movement continues — for example, in an upward movement — the new swing low (SSL) will be the minimum before the update, i.e., the internal low, while the swing high (BSL) will be formed according to the three-candle pattern.
A change of direction is considered when a candle closes beyond the key swing high/low (BSL/SSL), depending on the direction of movement. For example, in an upward movement, a break occurs when a candle closes beyond the swing low (SSL). After that, the swing high (BSL) will be the nearest fractal (swing high), and the swing low (SSL) will be formed according to the three-candle pattern.
All the above logic also applies to downward movements.
Within each movement, there can be FVG zones, which can act as support/resistance or indicate weakness in the movement direction.
Note: if the movement is upward, only bullish FVG+ will be displayed; if the movement is downward, only bearish FVG- will be displayed.
Weakness of movement direction.
For example, consider an upward impulse with the nearest FVG+ zone. If the price closes beyond the lower boundary of the zone, it will be considered invalidated (inv. FVG-), which in turn indicates weakness in the movement direction and a possible local short, which may subsequently lead to a break of the entire movement.
🟠 HOW TO USE
There are only two visual settings in the configuration:
Show previous SSL/BSL – enables/disables the display of all previous SSL/BSL zones
Show Bullish/Bearish trend – enables/disables background shading between SSL and BSL for visual understanding of the movement direction
On the chart, the following are displayed:
Labels with current SSL/BSL
FVG+- / inv. FVG+- zones, for trading in the movement direction
In case the nearest FVG is invalidated, a label will appear with the text: Weak bullish/bearish & local short/long (this is not a signal, but only indicates the probability of a potential move based on the weakness of the nearest zone)
🟠 CONCLUSION
The indicator helps determine the current movement with zones for trading in the direction, and also indicates movement weakness through invalidation of the nearest zones.

Gabbie - FVG/OBGabbie – FVG-OB plots Fair Value Gaps (FVGs) and Order Blocks (OBs) to help visualize price imbalances and institutional reaction zones.
Fair Value Gaps
Bullish FVGs and Bearish FVGs are marked automatically.
The indicator also shows when an FVG is mitigated (price returns to fill the imbalance).
If price wicks into an FVG without a full body close through it, the FVG remains valid under this model.
Order Blocks / Breaker Blocks
Bullish OBs are marked in green
Bearish OBs are marked in red
Breaker Blocks are marked in yellow
Use these zones for confluence with your market structure and liquidity framework.
Settings
Choose the timeframe source for OB/BB detection.
Adjust the number of active FVGs displayed. Defaults are designed for immediate use.
Limitations / reminder
Zones are plotted from historical price action and are not trade guarantees. Always confirm with structure, liquidity, and risk rules.

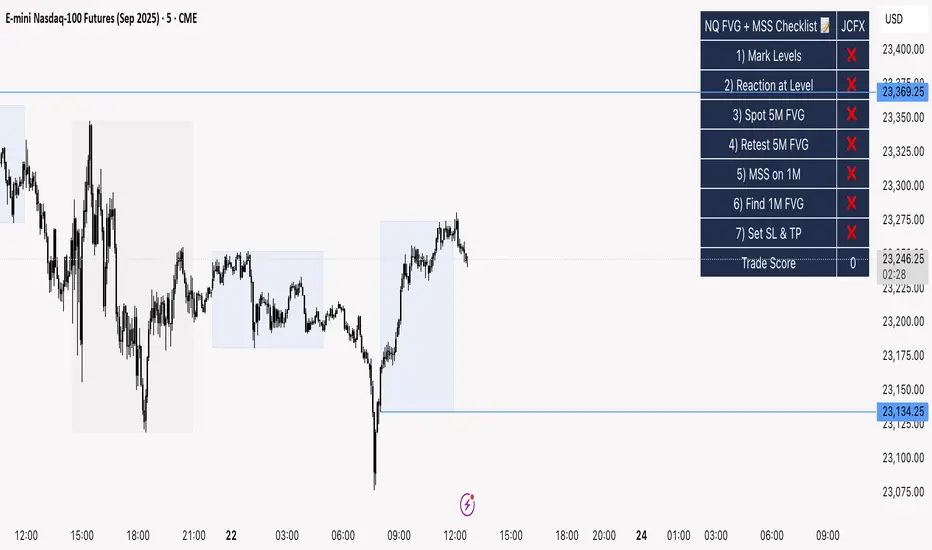
ICT 1st FVG + Date/News [NQTrades]🎯 Indicator Summary: ICT 1st FVG + Date/News
This indicator combines a core ICT (Inner Circle Trader) concept—the tracking of the first Fair Value Gap (FVG) of a session—with convenient on-screen information about the current date and scheduled economic news events.
🟢 Section 1: 1st FVG (Fair Value Gap) Tracker
This logic is dedicated to automatically detecting and visualizing the very first Fair Value Gap that forms at the start of the trading session.
Session-Specific: The indicator only searches for an FVG within the user-defined trading session (defaulting to 09:32 - 16:00 EST for the NY session).
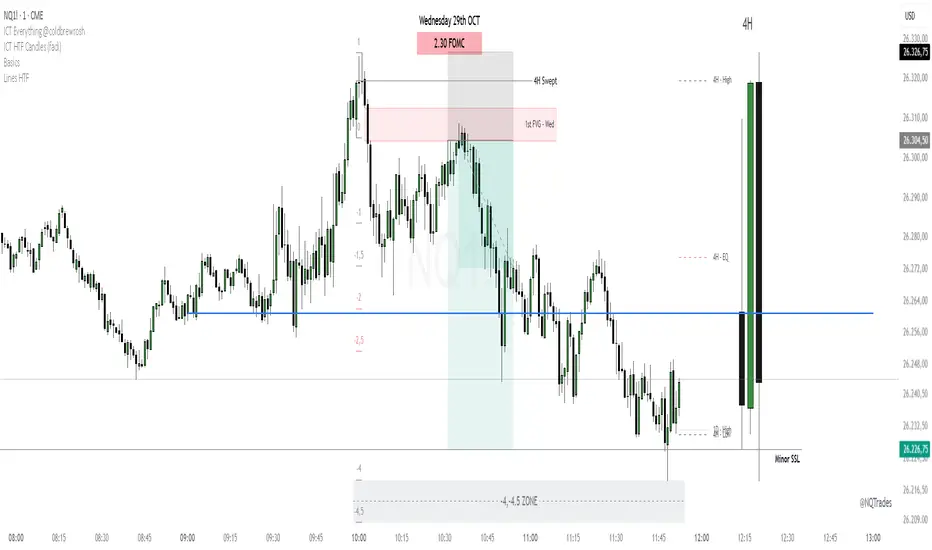
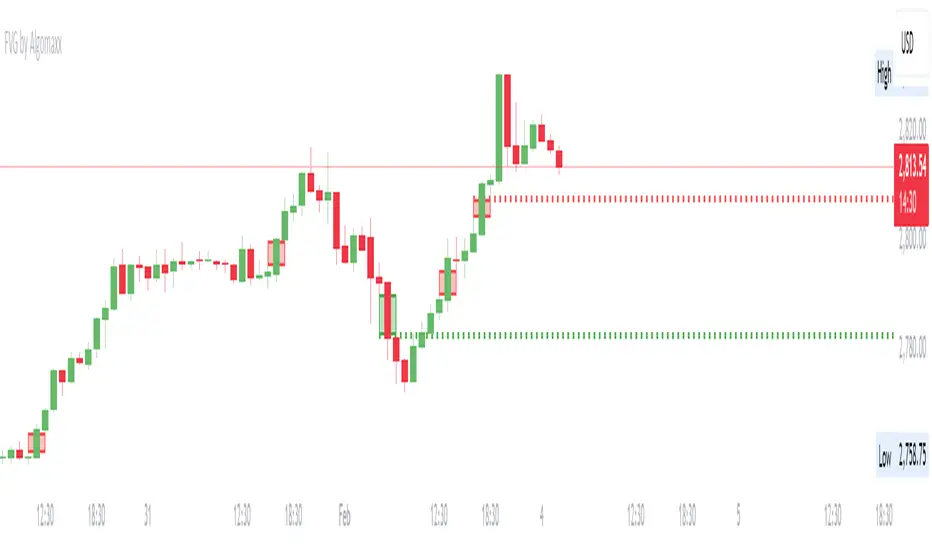
First Only: It plots only the first valid FVG that meets the minimum distance requirement (Min FVG Distance) and ignores all subsequent FVGs for the remainder of that session.
Visual Tracking (Modified): The FVG is drawn as a transparent box that begins at the current bar and extends forward into the chart, allowing traders to monitor its fill or reaction in real-time without cluttering the historical chart data.
Customization: Allows setting distinct colors for bullish (up) and bearish (down) FVGs.
📰 Section 2: Date & News Display
This module provides an organized, persistent display on the chart for critical time and event information.
Date & Time: Displays the current weekday, date, and month in a customizable format.
Configurable News Events: Users can set up to three high-impact news events for the day (e.g., NFP, FOMC, CPI, etc.).
Visual Alert: Each news event is displayed with its own customizable background color, text size, and text color, providing a quick visual alert for upcoming market volatility drivers.
Positioning: The entire information box (Date + News) can be anchored to any of the chart's four corners (Top/Bottom and Left/Center/Right).
Fair Value Gap (FVG) by AlgoMaxxFair Value Gap (FVG) by AlgoMaxx
Advanced Fair Value Gap (FVG) detector with dynamic support/resistance lines. This professional-grade tool helps traders identify and track important market inefficiencies through Fair Value Gaps.
Features:
• Auto-detection of bullish and bearish FVGs
• Dynamic dotted extension lines for latest FVGs
• Smart gap filtering system
• Color-coded visualization
• Customizable parameters
• Clean, optimized code
Key Functions:
• Detects imbalance zones between candlesticks
• Marks FVGs with color-coded boxes
• Extends dotted lines for active reference levels
• Automatically updates with new gap formations
• Tracks gap fills in real-time
Inputs:
• Lookback Period: Historical gaps to display
• Minimum Gap Size %: Filter for gap significance
• Bullish/Bearish Colors: Visual customization
• Show Filled Gaps: Toggle filled gap visibility
Practical Applications:
1. Support/Resistance Levels
2. Mean Reversion Trading
3. Trend Continuation Setups
4. Market Structure Analysis
5. Price Action Trading
Usage Tips:
• Higher timeframes (1H+) provide more reliable signals
• Multiple FVGs in one zone indicate stronger levels
• Use in conjunction with other technical tools
• Monitor price reactions at FVG levels
• Consider gaps as zones rather than exact prices
Note: This is a premium-grade indicator designed for serious traders. Works best on higher timeframes where price inefficiencies are more significant.
═══════════════════
By Algomaxx
Version: 1.0
═══════════════════
Disclaimer:
This indicator is for informational purposes only. Trade at your own risk and always use proper risk management.
#FVG #technical #trading #algomaxx #premium
Cumulative Volume Delta Strategy | Flux Charts💎 GENERAL OVERVIEW
Introducing the Cumulative Volume Delta Strategy (CVDS) Indicator, an advanced tool designed to enhance trading strategies by identifying potential trend reversals through volume dynamics. This script features integrated order block detection, Fair Value Gaps (FVGs), and a dynamic take-profit (TP) and stop-loss (SL) system. For an in-depth understanding of the strategy, refer to the "HOW DOES IT WORK?" section below.
Features of the new Cumulative Volume Delta Strategy (CVDS) Indicator :
Cumulative Volume Delta-based Strategy
Order Block and Fair Value Gap (FVG) Entry Methods
Dynamic TP/SL System
Customizable Risk Management Settings
Alerts for Buy, Sell, TP, and SL Signals
📌 HOW DOES IT WORK ?
The CVDS indicator operates by tracking the net volume difference between buyers and sellers to identify divergences that could indicate potential trend reversals. A cumulative volume delta (CVD) calculation is employed to measure the intensity of these divergences in relation to price movements. The net volume sum is reset every trading day (can be changed from the settings using the anchor period option), and divergences are detected when the cumulative volume crosses the 0-line over or under.
Once a significant divergence is detected, the indicator identifies breakout points, confirmed by either Fair Value Gaps (FVGs) or Order Blocks (OBs). Depending on your chosen entry mode, the indicator will trigger a buy or sell entry when the confirmation signal aligns with the breakout direction. Alerts for Buy, Sell, Take-Profit, and Stop-Loss are available.
Note that the indicator cannot run on 1-minute and 1-second charts, as it needs to get data from a lower timeframe. 1-minutes & 1-second timeframes are the minimum timeframes in their ranges respectively.
🚩 UNIQUENESS
What sets this indicator apart is the combination of volume divergence analysis with advanced price action tools like Fair Value Gaps (FVGs) and Order Blocks (OBs). The ability to choose between these methods, along with a dynamic TP/SL system that adapts based on volatility, provides flexibility for traders in any market condition. The backtesting dashboard provides metrics about the performance of the indicator. You can use it to tune the settings for best use in the current ticker. The CVD-based strategy ensures that trades are initiated only when meaningful divergences between volume and price occur, filtering out noise and increasing the likelihood of profitable trades.
⚙️ SETTINGS
1. General Configuration
Anchor Period: Time anchor period used in CVD calculation. This is essentially the period that the volume delta sum will be reset. Lower timeframes may result in more entries at the cost of less reliable results.
Entry Mode: Choose between FVGs or OBs to trigger your entries based on the confirmation signals.
Retracement Requirement: Enable to confirm the entry after a retracement toward the FVG or OB.
2. Fair Value Gaps
FVG Sensitivity: Modify the sensitivity of FVG detection, allowing for more or fewer gaps to be considered valid.
3. Order Blocks (OB)
Swing Length: Define the swing length to identify OB formations. Shorter lengths find smaller OBs, while longer lengths detect larger structures.
4. TP / SL
TP / SL Method:
a) Dynamic: The TP / SL zones will be auto-determined by the algorithm based on the Average True Range (ATR) of the current ticker.
b) Fixed : You can adjust the exact TP / SL ratios from the settings below.
Dynamic Risk: The risk you're willing to take if "Dynamic" TP / SL Method is selected. Higher risk usually means a better winrate at the cost of losing more if the strategy fails. This setting is has a crucial effect on the performance of the indicator, as different tickers may have different volatility so the indicator may have increased performance when this setting is correctly adjusted.

ICT Unicorn Model [LuxAlgo]The ICT Unicorn Model indicator highlights the presence of "unicorn" patterns on the user's chart which is derived from the lectures of "The Inner Circle Trader" (ICT) .
Detected patterns are followed by targets with a distance controlled by the user.
🔶 USAGE
At its core, the ICT Unicorn Model relies on two popular concepts, Fair Value Gaps and Breaker Blocks. This combination highlights a future area of support/resistance.
A Bullish Unicorn Pattern consists out of:
A Lower Low (LL), followed by a Higher High (HH)
A Fair Value Gap (FVG), overlapping the established Breaker Block
A successful re-test of the FVG which confirms the pattern.
A Bearish Unicorn Pattern consists of:
A Higher High (HH), followed by a Lower Low (LL)
A Fair Value Gap (FVG), overlapping the established Breaker Block
A successful re-test of the FVG which confirms the pattern
The pattern detection depends on detected swings, which can be controlled by the Swing setting. Using higher values of this setting will return longer-term breaker blocks.
🔹 Using Risk/Reward Targets
A confirmed Unicorn pattern will show a blue ( Target ) / grey ( Stop Loss) "Risk/Reward" areas (RR).
When the Stop Loss or Target is hit, a white line is shown on the concerned side.
The Risk/Reward ratio can be adjusted in the "Targets" settings.
🔹 Trailing Stop
As seen in the previous snapshots, besides the RR areas, this indicator also includes an optional Trailing Stop .
This can be helpful to lower your risk, by exiting earlier than if you would wait until the Stop Loss is hit.
This example shows a successful bullish and bearish Unicorn Pattern . In this scenario, the Trailing Stop could be used for partial Take Profit.
The goal of this publication is to show confirmed Unicorn Patterns . To increase the chance of success, it is important to evaluate the bigger picture & use this in confluence with your price action analysis. For example, look for potential areas of liquidity, consider this pattern only during certain market sessions, avoid trading during heavy impact news, &/or incorporate other aspects of technical analysis rather than just following this pattern blindly.
🔶 DETAILS
🔹 Combine
When disabled, all potential Unicorn Patterns will delete previous unconfirmed patterns:
Enabling Combine ensures the last Unicorn Patterns in the opposite direction will remain.
While the latter bullish pattern became invalid, another one formed.
The combination of the previous bearish pattern, and looking at the big picture, the bullish pattern did not have much chance to be successful.
While disabling 'combine' helps minimize clutter, enabling this feature can give a pattern more chance to hit the SL/Target level.
🔹 Mitigated FVG
Users can determine if a pattern becomes invalid due to a mitigated FVG, causing the pattern to be deleted.
🔹 New pattern detected
When a new pattern is detected, the previous unconfirmed pattern in the same direction (bullish - bullish or bearish - bearish) will be deleted. This will always be the case, whether "Combine' is enabled or disabled.
When the previous pattern was confirmed but no SL or Target level was hit, this pattern will stop updating.
🔶 SETTINGS
🔹 Unicorn
Swings: This sets the length of swings, used for the underlying ZigZag and Unicorn Patterns detection.
Bull: Enable/disable Bullish patterns, and set the color of FVG box and Trailing Stop .
Bear: Enable/disable Bearish patterns, and set the color of FVG box and Trailing Stop .
Combine: When enabled, patterns in opposite directions (bullish/bearish) can exist at the same time. disabling this feature tends to give less clutter. See the "Usage" section for more information.
🔹 Targets
Risk/Reward: Sets the Risk/Reward ratio.
Trailing Stop: Set the length of small swings, which is used for the Trailing Stop .

Inversion GapsAn inverted fair value gap (FVG) occurs when candles start closing below a bullish FVG or above a bearish FVG and in this case, support FVGs become resistances and vice versa. This is a smart money concept introduced by ICT. While we a number of have indicators for FVGs, we don't have any for inversion FVGs. This indicator is just for that - it shows FVGs only after they're inverted.
The meat of it comes from being able to plot HTF inverted FVGs in LTF. In the above BTC chart, you can see M15 inverted FVGs plotted on M1 chart and you can see price respecting them. Mitigations can also be shown as lines (as you can see in the chart).
You can also setup alerts for formation and mitigation of such inversion FVGs.

[FR]Custom Candles/FVG/nSideBarCustom Candles /FVG/ nSideBar
- I used this as a learning project for understanding plot()'s Better
- My goal was to see if I could use normal plots to cleanly plot FVGs on the chart using only plots with out and boxes/lines
The problem was if multiple FVGs were on back to back bars the plot fill would fill the line to the next FVG/Bar
I solved this by using 4 plots and alternating them if consecutive FVGs form
- 2 MODES
- Slim
- Normal
//////////////////////////////////////////////////////////////////////////////////////////////////////////////////////////////////////////////////////////////////////////////
-Slim
Uses 3 plotcandle() parts and divides the candle between body/wicks/open and close
by manipulating the ohlc inputs and the colors I was able to pretty make them full customizable
all components are customizable with up/down colors
-Normal
These are your normal candles but they are full customize able from components to individual up/down colors
--------------------------------------------------------------------------------------------------------------------------------------------------------------------------------------------------------------------------------------------------------
- FVGs
There are 2 FVG settings can be used with both MODES
- Big
These are the FVGs that use plots and since there isn't a 500 object limit on plots you don't need to manage them in the code and they are there how ever far you need to look back
- Slim
These use a Line and the width of the line can be adjusted for user preferences
--------------------------------------------------------------------------------------------------------------------------------------------------------------------------------------------------------------------------------------------------------
- INSIDE-BARS
These will change the color of the body of either SLIM or NORMAL Candles
--------------------------------------------------------------------------------------------------------------------------------------------------------------------------------------------------------------------------------------------------------
Drawing Snap Features Work Just Fine!
I suggest hiding your chart candles with the eye in the top left of the screen and moving the indicator to the top of your object tree
I understand that the candles in the chart pictures are impractical I was just demonstrating the functionality of the tool
Hope You Enjoy!!
FFriZz

CRT Inside Hunter + FVG (Final Fusion)CRT Inside Hunter + FVG (Final Fusion)
This indicator automatically detects Inside Bar → CRT (Consolidation – Range – Trap) structures and generates LONG / SHORT BAM breakout signals whenever the mother bar is violated.
It also includes optional Fair Value Gap (FVG) confirmation.
🔍 1. Inside Bar → Mother Bar Detection
Automatically identifies inside bar sequences.
Creates the Mother Bar with High / Low boundaries.
Draws Q1 – Mid – Q3 levels as visual guidance.
Auto-removes CRT structure after a user-defined number of bars.
🚨 2. BAM Breakout Signals
Breakout events trigger automatic trade signals:
Upper violation → SHORT signal
Lower violation → LONG signal
Signals are displayed as labels and fully support alerts.
🟦 3. FVG (Fair Value Gap) Confirmation
Optional FVG detection mode:
Automatically marks Demand and Supply FVG zones.
If the price touches an FVG at the breakout moment, the signal becomes FVG-Confirmed.
🎨 4. Additional Features
Inside bars highlighted for clarity.
Clean, minimal drawing system.
All drawings reset daily for maximum chart hygiene.
This tool combines liquidity, imbalance, breakout logic and provides a powerful structure for scalping and intraday trading.

AR–CISD-Market Shift-FVGAR–CISD-Market Shift-FVG is a precision price-action indicator that combines three core ideas in one tool:
• Shift → market structure breaks (internal + major) using a wick→body confirmation model.
• CISD → Change in State of Delivery, where one-sided orderflow is decisively wiped out.
• FVG → cleaned-up, ATR-filtered Fair Value Gaps that only highlight meaningful imbalances.
It’s built to give you structure, delivery and imbalance on a single chart without turning everything into spaghetti.
________________________________________
What it plots
1. Shift (structure breaks)
• Detects both internal and major structural breaks from user-defined pivots.
• Uses a wick→body close (no zigzags, no candle-by-candle stepping).
• Optional displacement gating (ATR-aware): the break candle must have
o a minimum body size vs ATR,
o decent body/range ratio,
o close near the bar’s extreme,
o and close beyond the broken level by a fraction of ATR.
• Internal and major breaks that occur at (almost) the same price are merged into a single “Shift” line, so you see one clean level instead of two overlapping labels.
2. CISD (Change in State of Delivery)
• Looks for a run of one-sided candles (e.g. a series of reds) that is taken out by the opposite side.
• Uses strict validation to avoid random noise:
o Opposite run must be longer / more meaningful than the wipe run (Opp ÷ Cur ratio).
o Wipe bar must show real displacement (body vs ATR + body/range).
o Opposite run must span a minimum price range vs ATR and contain at least one non-doji candle.
o Optional EMA baseline and de-dup (time + ATR-scaled price radius) to prevent spam.
• When valid, it draws a wick→body horizontal line with inline CISD text, rendered as
---- CISD ---- in bull or bear color.
3. FVG (Fair Value Gaps)
• Detects 3-bar FVGs only when the gap exceeds a minimum ATR-scaled size, so tiny micro-gaps are ignored.
• Boxes project forward for N bars and are automatically removed on fill.
• Labels are small and slightly dim, so they support structure/CISD rather than overpower them.
(If you enabled it in the inputs, you’ll also see optional VI (Volume Imbalance) hints as tiny horizontal tags when a body gap clears the prior body band with elevated volume.)
________________________________________
Inputs & usage tips
• Shift block – control pivot sensitivity (L/R & Li/Ri), displacement rules, equality tolerance, and whether to extend lines right.
• CISD block – adjust min opposite bars, max wipers, strict filters (ATR, body/range, range vs ATR), EMA context, and de-dup radius.
• FVG block – set the minimum FVG size (×ATR), right extension, how many to track, and label style.
• If you see too many lines, first tighten CISD strictness and Shift displacement, or increase pivot lengths, before touching anything else.
• On your execution timeframe, look for Shift + CISD + FVG lining up in the same leg or zone – that’s where the indicator is telling a strong, consistent story about structure, delivery, and imbalance.
________________________________________
Disclaimer
For educational and chart-marking purposes only. Not financial advice. Always forward-test and adapt parameters to your instrument, timeframe, and personal risk tolerance.

🟡 GOLD 4H HUD v8.9 — Loose ICT OB + Strong/Weak + FVG/HVN/LVNGOLD 4H HUD v8.9 is a clean, structured Smart Money Concepts (SMC)–based analysis tool designed exclusively for XAUUSD on the 4-hour timeframe.
It focuses on the three most important elements for institutional orderflow analysis:
✔ Loose ICT Order Blocks (Demand/Supply)
✔ Fair Value Gaps (FVG)
✔ Volume Profile Zones (HVN/LVN/POC)
The script builds a professional-style HUD that displays the key institutional regions and structural levels that matter most for gold traders.
📌 Key Features
1 — Market Structure Engine (HH/HL & BOS)
The indicator detects:
Minor swing Highs and Lows
Last confirmed HH / HL levels
Break of Structure (BOS) for directional bias
EMA-200 trend filter (UP / DOWN / NEUTRAL)
This gives traders a clean structural read without clutter or noise.
2 — Loose FVG Engine (Tolerance-Based ICT Gaps)
A soft-threshold FVG engine detects “loose” Fair Value Gaps using a 0.1% price tolerance.
This method ensures:
Fewer missed imbalances
Cleaner OB/FVG alignment
Higher accuracy on 4H gold displacement legs
FVGs automatically shift to the right side of the chart for clean visualization.
3 — Order Block Engine (Demand/Supply + Strong/Weak Classification)
A simplified ICT-style OB engine scans the past few candles whenever BOS is detected.
It identifies:
Demand OB during bullish BOS
Supply OB during bearish BOS
Strong OB if fully nested inside an active FVG
Weak OB otherwise
OB boxes include:
Clear color coding (strong vs. weak)
Price range labels inside each box
Automatic right-shift for visual clarity
4 — Volume Profile Engine (POC / HVN / LVN / VAH / VAL)
Based on a rolling window (default 120 bars), the script builds a lightweight volume distribution.
It displays:
POC (Point of Control)
HVN (High Volume Node)
LVN (Low Volume Node)
Value Area High / Low
HVN/LVN zones are shown as right-shifted colored boxes with price labels.
These zones help identify:
Institutional accumulation
Low-liquidity rejection points
Areas where price tends to react strongly
5 — Support / Resistance Mapping
The script automatically generates:
OB-based support/resistance
Swing-high/swing-low levels
HVN/LVN structural levels
These are displayed in the HUD for fast reference.
6 — Professional HUD Panel
A compact, easy-to-read HUD summarizes:
Trend direction
Latest HH/HL
OB ranges (Strong/Weak)
HVN/LVN price zones
POC
Multi-layer support & resistance
This turns the script into a fully functional analysis dashboard.
📌 What This Indicator Is NOT
To avoid misunderstanding:
It does not take entries or generate buy/sell signals
It does not auto-detect CHOCH, MSS, SMT, or sweeps
It is not a trading bot
This tool is designed as an institutional-style map and analysis HUD, not a strategy.
📌 Best Use Case
This indicator is ideal for traders who want to:
Read institutional structure on XAUUSD
Identify clean Demand/Supply zones
Visualize FVG/OB/HVN interactions
Track high-value liquidity levels
Build directional bias on 4H before dropping to execution timeframes
⚠ Important Note
This tool is designed exclusively for the 4H timeframe.
Using it on lower timeframes will display a warning.

Quantura - Fair Value GapIntroduction
“Quantura – Fair Value Gap” is a precision-engineered institutional concept indicator designed to automatically identify, visualize, and manage Fair Value Gaps (FVGs) across any market or timeframe. It enables traders to observe price inefficiencies, potential liquidity voids, and retracement areas that often act as magnets for price rebalancing.
Originality & Value
Unlike many public FVG scripts that only highlight candle gaps, this indicator integrates dynamic filters and adaptive logic to determine the strength and reliability of each gap. It merges overlapping zones intelligently and optionally extends valid imbalances forward for ongoing reference.
Its value lies in:
Dynamic statistical filtering based on gap standard deviation.
Optional volume confirmation for high-confidence FVGs.
Automatic merging of overlapping or adjacent gaps for clean visualization.
Support for both bullish and bearish imbalances.
Signal alerts when gaps are filled or rebalanced by price.
Functionality & Core Logic
Detects Fair Value Gaps by comparing candle-to-candle price displacement.
Applies a Gap Filter (standard deviation-based) to qualify valid gaps.
Optionally validates gaps formed under significant volume conditions.
Draws color-coded boxes to mark bullish (discount) and bearish (premium) inefficiencies.
Monitors each FVG until price fills the gap, at which point the box is visually closed.
Provides optional signal markers (“▲” or “▼”) when rebalancing occurs.
Parameters & Customization
Gap Filter: Sets the minimum statistical deviation required for a valid FVG. Higher values detect fewer, stronger gaps.
Volume Filter: Toggles additional validation using relative volume strength.
Volume Sensitivity: Adjusts how much above-average volume must be present to confirm a gap.
Bullish/Bearish Colors: Customize color schemes for imbalance zones.
Extend Gaps: Optionally extend open gaps forward for better confluence tracking.
Signals: Enables or disables gap-fill signal markers.
Visualization & Display
Bullish FVGs: Appear in blue-tinted boxes, indicating potential demand-side inefficiencies.
Bearish FVGs: Appear in red-tinted boxes, representing potential supply-side inefficiencies.
Overlapping zones are merged automatically to maintain clarity.
Filled gaps remain visible for historical context, allowing for post-event analysis.
Optional signal arrows display when price returns to rebalance an FVG.
Use Cases
Identify institutional inefficiencies and liquidity voids.
Detect premium and discount levels in trending markets.
Combine with market structure or order block indicators for confluence.
Track when price rebalances inefficiencies to refine entry/exit points.
Build FVG-based algorithmic strategies that rely on structural imbalance resolution.
Limitations & Recommendations
The indicator detects structural imbalances but does not predict future direction or guarantee profitability.
Volume filters may behave differently across brokers due to data-source differences.
Use alongside structure or liquidity tools for enhanced decision-making.
Extreme volatility or illiquid assets may generate temporary invalid gaps.
Markets & Timeframes
Compatible with all markets (crypto, forex, equities, indices, futures) and all timeframes. Recommended for multi-timeframe confluence analysis — e.g., detecting higher-timeframe FVGs and refining lower-timeframe entries.
Author & Access
Developed 100% by Quantura. Published as a Open-source script indicator. Access is free.
Compliance Note
This description adheres fully to TradingView’s House Rules and Script Publishing Requirements . It provides a detailed explanation of originality, core logic, limitations, and appropriate use — with no unrealistic or misleading performance claims.

True Opens (TDO/TWO/NYAM etc.)+ First FVG - Milana TradesThis indicator combines multiple "True Open" levels with the visualization of the first Fair Value Gap (FVG) following key market opens.
Key Features:
True Opens (TDO, TWO, TAO, TLO, NYAM, TNY):
TDO (True Day Open): Displays the start of the trading day (00:00 NY time) with customizable line style, color, and label.
TWO (True Weekly Open): Marks the start of the week (Monday 18:00 NY time) with visual lines and optional labels.
TAO (True Asian Open): Highlights the opening of the Asian session (19:30 NY time), allowing traders to track early Asian session activity.
TLO (True London Open): Marks London session open (01:30 NY time), providing insight into the first European market activity.
NYAM (New York AM Open): Marks 09:30 NY time, often a key liquidity spike period.
TNY (True New York Open): Highlights the full New York session open (07:30 NY time), useful for pre-market and early NY session trading.
All lines are fully customizable in color, style, width, and label visibility. Lines can also be extended to the right for better visual tracking.
First FVG After Open:
Automatically detects the first Fair Value Gap (FVG) following each session open.
Supports both bullish and bearish FVGs, displayed with distinct colors and transparency.
Mitigation detection highlights gaps that have already been touched or partially filled, using a softer color for clarity.
Why the first FVG matters:
The first gap after an open often indicates the initial imbalance of the session.
These gaps can act as high-probability zones for retracement or continuation trades, providing early-session trade opportunities.
Daily & Weekly Initial Range Boxes:
Visualize daily (00:00–01:00 NY) and weekly (Monday 18:00–19:00 NY) initial ranges.
Boxes update dynamically with price movement during the session.
Optional range info in pips to quantify volatility and potential targets.
Customizable Appearance:
Choose colors for bullish, bearish, and mitigated FVGs.
Adjust line styles (solid, dashed, dotted), widths, labels, and extensions for all opens.
Transparency settings for IB boxes allow clear chart readability without clutter.
Historical Options:
Enable prior day/week visualization to analyze session behavior and recurring patterns.
Why Traders Use This Indicator:
Early session clarity: Knowing the true session opens and first FVGs helps traders spot high-liquidity zones and potential reversals.
Structure-based trading: Combines session open levels with FVGs, aligning with professional market structure strategies.

Imbalance (FVG)Indicator Description
This script is designed to automatically identify and visualize Fair Value Gaps (FVGs), also known as Imbalances, on your chart. An FVG is a key price action concept that highlights areas where the price moved swiftly, leaving a gap behind. This indicator is simple to use and fully customizable, making it an excellent tool for both novice and experienced traders.
Key Features
Automatic Detection: The indicator scans the market in real-time, automatically drawing FVG zones for both Bullish and Bearish moves.
Mitigation Tracking: When the price returns to an FVG zone, the indicator automatically marks it as "mitigated" (filled) by changing its color and style. This provides a clear signal that the imbalance has been neutralized.
Extend Zones Into the Future: Unmitigated FVG zones are automatically extended into the future, allowing them to be used as potential future support or resistance levels.
Full Customization: The user has complete control over the indicator's appearance. You can change the colors for bullish, bearish, and mitigated zones, as well as toggle their visibility on and off.
Performance Optimization: A built-in limit for the number of drawn objects prevents chart clutter and avoids errors from TradingView's drawing limits, ensuring smooth performance.
How to Use?
FVG zones can be used in various ways, including:
Price Magnets: Markets often tend to revert to "fill" these gaps.
Potential Entry Points: Price entering an FVG zone can present an opportunity to open a position, especially if confirming signals appear.
Support/Resistance Zones: Unfilled gaps can act as strong, dynamic levels of support or resistance.

NQ FVG + MSS ChecklistThe NQ FVG + MSS Quick Checklist is a simple yet powerful visual tool for traders focusing on the Nasdaq 100 (NQ) futures. It provides a step-by-step checklist to assess trade setups based on key market concepts like Fair Value Gaps (FVG), Market Structure Shifts (MSS), session highs/lows, and previous day levels.
This indicator helps you quickly see which elements of your trading plan are met before entering a trade. Each checklist item can be manually toggled, and a cumulative Trade Score provides a quick visual guide to setup strength.
Key Features:
Step-by-step checklist for NQ trading setups
Track levels: Session highs/lows & Previous Day High/Low
Spot 5M FVG and Retests
Identify MSS on 1M and find 1M FVG inside MSS
Manual SL & TP guidance
Trade Score for quick setup strength assessment
Fully visible table overlay on top of the chart
How to Use:
Mark session & previous day levels
Observe reaction at key levels (Sweep or Continue)
Identify 5M FVG and any retests
Spot 1M MSS and 1M FVG inside MSS
Set SL/TP based on FVG extremes and next session levels
Check the cumulative Trade Score for setup confirmation
Note: This indicator is manual input-based, letting traders tick off items as they analyze the chart, making it a lightweight trading checklist HUD that stays on top of all chart elements.