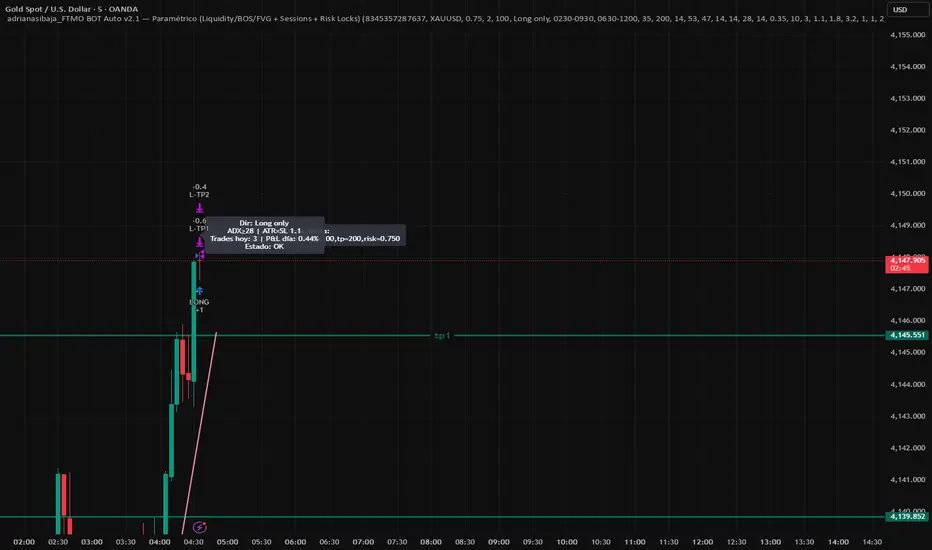
adrianasibaja_ ALGO (Liquidity/BOS/FVG + Sessions + Risk Locks)This strategy is an institutional-style automated trading system designed for XAU/USD and FTMO-funded accounts.
It combines liquidity sweeps, Break of Structure (BOS) and Fair Value Gap (FVG) confirmations with multi-filter confluences (RSI, ADX, ATR, EMA trend bias, and candle quality).
The algorithm automatically filters trades by session (London/New York), day of week, and volatility. It includes full FTMO risk management features such as daily loss lock, consecutive loss lock, and trade cooldowns.
Cerca negli script per "fvg"
Smart 9-15 EMA Cross + RSI + FVG Zones (Instant Signal)Smart 9-15 EMA Cross + RSI + FVG Zones (Instant Signal)

[Hosein] Support & Resistance Zones + FVGAdjustable FVG gap size and extension.
Option to ignore narrow gaps.
Option to ignore fully crossed gaps.
Show/hide FVGs.
Customizable colors with initial opacity.
Ideal for traders looking for supply/demand imbalance zones.

Smart Money Concepts Pro – OB, FVG, Liquidity + Trade SetupsThis script is a complete Smart Money Concepts (SMC) toolkit designed for traders who want clean and actionable charts without clutter.
It combines the most important institutional concepts into one indicator:
Order Blocks (OB): auto-detection of bullish and bearish order blocks with mitigation tracking, merging and TTL (time-to-live).
Fair Value Gaps (FVG): automatic gap recognition with size filters, mitigation tracking and lifetime control.
Liquidity Pools (EQH/EQL): equal highs and equal lows marked with tolerance (ATR-based or fixed).
Break of Structure (BOS): up/down structure shifts plotted directly on the chart.
Multi-Timeframe (HTF): option to use higher timeframe data (e.g. H4, Daily) for stronger zones.
Trend Filter: show zones only in the direction of market structure.
Trade Setups: automatic signals for OB Retest + Trend setups, with entry, stop-loss and take-profit levels (custom R-R).
Flexible Zone Extension: choose between extending zones to the live bar or fixed box width for a cleaner look when scrolling.
Features
Fully customizable (pivot length, ATR filters, box width, TTL, zone colors)
Separate presets for Scalping, Intraday, Swing trading styles
Visual trade planning with entry/SL/TP lines and optional labels
Works across all markets (crypto, forex, indices, stocks)
How to use
Bias: identify overall direction (BOS + HTF zones).
Wait: for price to return to an unmitigated OB or FVG.
Entry: take the setup signal (OB retest + trend filter).
Risk: stop-loss at opposite OB boundary.
Target: TP based on chosen R-R multiple (default 2R).
⚡ Whether you scalp short-term moves or swing trade HTF zones, this indicator gives you a clear institutional edge in spotting supply/demand imbalances and high-probability setups.

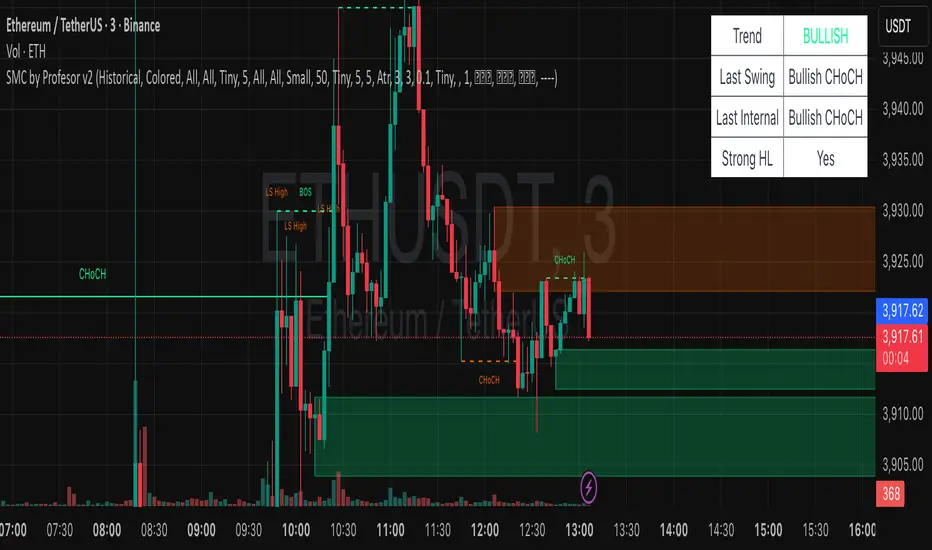
SMC by ProfesorSMC by Profesor
Discover market structure mastery with SMC by Profesor – your ultimate Smart Money Concepts toolkit for TradingView. Identify bullish/bearish BOS & CHoCH breaks, plot internal/swing order blocks, detect EQH/EQL levels, highlight FVGs, and zone premium/discount areas. Visualize swing points, PDH/PDL lines, and trend-colored candles. Receive instant alerts for breakouts, gaps, and more. Perfect for ICT traders seeking precision in any timeframe. Historical or real-time mode – elevate your edge today!
Multi-Timeframe FVG Detector v2 STEWNewest FVG with alerts and ability to show current TimeFrame Viewed

BND Trader (By Vahid.Jz) 🇮🇷🎉 The first Persian indicator on TradingView, released for free to celebrate my daughter's birthday. 🎉
**Trading Assistant (by Vahid.Jz)** is an all-in-one tool designed to simplify analysis and improve accuracy. It acts as an intelligent trading partner.
**Features:**
- Market Structure detection
- Multi-Timeframe “Third Eye” analysis
- Professional Order Blocks recognition
- Fair Value Gaps (FVGs) detection
- Customizable alerts
- Fully Persian interface
- Create Custom Alarm
Developed with love by **Vahid.Jz**, a trader and Pine Script enthusiast.
*“Trading is not a destination; it’s the journey — a path of learning, growth, and experience.”*

Liquidity + FVG + OB Markings (Fixed v6)This indicator is built for price-action traders.
It automatically finds and plots three key structures on your chart:
Liquidity Levels – swing highs & lows that often get targeted by price.
Fair-Value Gaps (FVG) – inefficient price gaps between candles.
Order-Blocks (OB) – zones created by strong, high-volume impulsive candles.
It also provides alerts and a small information table so you can quickly gauge the current market context.

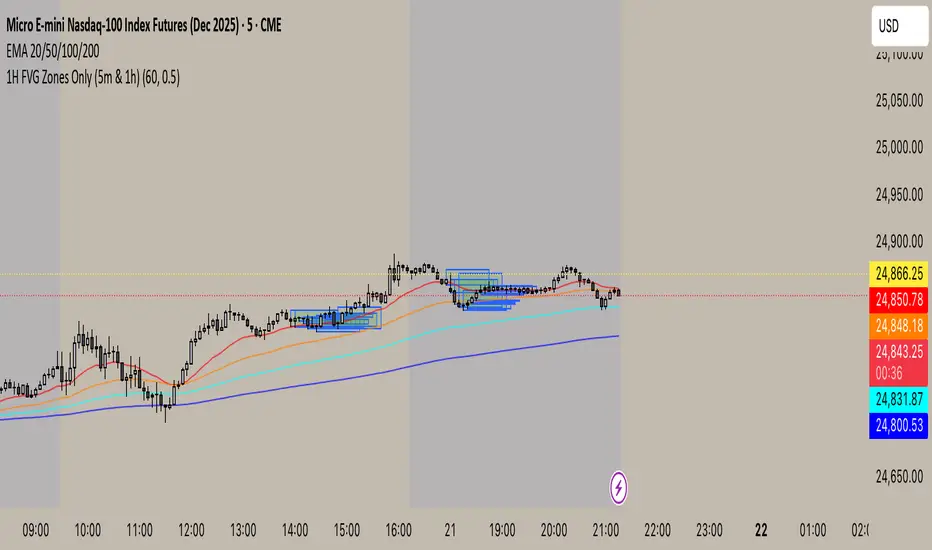
1H FVG Zones Only (5m & 1h)new uses trend anaylosis. takes 15 min chart and breaks into 1hr chart fvg gaps
BSL/SSL Sweep + FVG Strategy Jobin (c) The New York ATM Model is a structured intraday strategy designed to capture algorithmic stop-hunts and reversals during the New York session open. It focuses on liquidity sweeps—either Buy-Side or Sell-Side—followed by a confirmation using Fair Value Gaps (FVGs).

Precision Fair Value Gap (FVG)This indicator scans historical price action to automatically detect unmitigated Fair Value Gaps (FVGs) with precision.
It highlights bullish and bearish gaps that remain open until price fills them, helping traders spot key liquidity imbalances used in Smart Money Concepts (SMC).
🔹 Features
Detects both bullish and bearish FVGs.
Auto-removes mitigated gaps once price returns to fill them.
Configurable gap size, line weight, and colors.
Optimized for performance with capped lookback and line control.
Works on all timeframes and markets.
Perfect for traders who rely on price action and institutional order flow to refine entries, exits, and confluence zones.

ICT Largest Midnight–00:30 FVG (NY, 1 per day) — FIXEDmarks out the first and largest fvg on the 1 min chart from midnight open until 12:30 am est

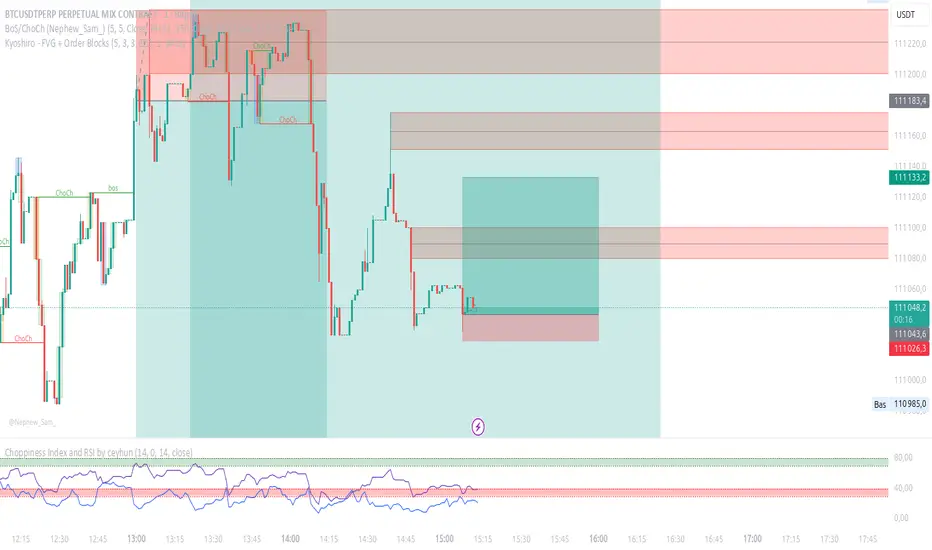
Kyoshiro - FVG + Order Blocks📌 Kyoshiro – FVG + Order Blocks
This indicator combines Order Block (OB) detection with an intelligent auto-management system and a clean visual display on the chart.
It is designed to help traders better identify institutional zones where price frequently reacts.
⚙️ Key Features:
✅ Real-time detection of bullish and bearish Order Blocks.
✅ Automatic cleanup: invalidated OBs are removed to keep the chart clean.
✅ Customizable display:
Maximum number of visible OBs (bullish / bearish).
Zone colors, outlines, and midlines.
Line styles (solid, dashed, dotted) and adjustable width.
✅ Choice of mitigation method:
Wick
Close
✅ Built-in alerts:
Formation of bullish or bearish OB.
Mitigation of an existing OB.
🔔 Available Alerts:
Bullish OB Formed → A bullish order block is detected.
Bearish OB Formed → A bearish order block is detected.
Bullish OB Mitigated → A bullish OB has been invalidated.
Bearish OB Mitigated → A bearish OB has been invalidated.
🎯 Use Cases:
Quickly identify key liquidity zones.
Track institutional activity in the market.
Improve entry and exit precision.
SMC + FVG + EMA + TrendlinesSMC + FVG + EMA + Trendlines legRange = math.abs(structureHigh - structureLow) // <-- เปลี่ยนชื่อจาก range -> legRange
if showCurrentStruct and not na(structureHigh) and not na(structureLow)
if na(curHighLine) == false
line.delete(curHighLine)
if na(curLowLine) == false
line.delete(curLowLine)
curHighLine := line.new(sHighIdx, structureHigh, bar_index, structureHigh, xloc.bar_index, color=currentStructColor, style=currentStructStyle, width=currentStructWidth)
curLowLine := line.new(sLowIdx, structureLow, bar_index, structureLow, xloc.bar_index, color=currentStructColor, style=currentStructStyle, width=currentStructWidth)
// ---------- Fibonacci on current leg ----------
if showFibo and legRange > 0
for k = 0 to array.size(fLevels) - 1
lvl = array.get(fLevels, k)
price = sDir == 1 ? structureHigh - (legRange - legRange * lvl)
: structureLow + (legRange - legRange * lvl)
l = line.new(sDir == 1 ? sHighIdx : sLowIdx, price, bar_index, price, xloc.bar_index, color=fiboColorMain, style=fiboStyle, width=fiboWidth)
label.new(bar_index + 10, price, str.tostring(lvl) + " (" + str.tostring(price) + ")", style=label.style_none, textcolor=fiboColorMain)

Order Blocks & FVG (Kostya)the indicator is the attempt to visualize the trading opportunities - price magnets and potential reversal zones for intraday and swing trading.

SMT Divergence in FVG (ES vs NQ)This indicator is designed to spot SMT Divergence inside of FVGs for ES and NQ

Molina Prob-Score + FVG + S/R (v1.2)it computes a weighted bull/bear score (0–100%), highlights ICT-style FVGs, marks pivot S/R, and gives simple entry flags. tune the weights to your style.

Smart Money Footprint & Cost Basis Engine [AlgoPoint]Smart Money Footprint & Cost Basis Engine
This indicator is a comprehensive market analysis tool designed to identify the "footprints" of Smart Money (institutions, whales) and pinpoint high-probability reaction zones. Instead of relying on lagging averages, this engine analyzes the very structure of the market to find where large players have shown their hand.
How It Works: The Core Logic
The indicator operates on a multi-stage confirmation process to identify and validate Smart Money zones:
Smart Money Detection (The Trigger): The engine first scans the chart for signs of intense, urgent buying or selling. It does this by identifying Fair Value Gaps (FVGs) created by large, high-volume Displacement Candles. This is our initial Point of Interest (POI).
Cost Basis Calculation (The Average Price): Once a potential Smart Money move is detected, the indicator calculates the Volume-Weighted Average Price (VWAP) for that specific move. This gives us a highly accurate estimate of the average price at which the large players entered their positions.
Historical Confirmation (The "Memory"): This is the indicator's most unique feature. It checks its historical database to see if a similar Smart Money move (in the same direction) has occurred in the same price area in the past. If a match is found, the zone's significance is confirmed.
Verified Cost Basis Zone (The Final Output): A zone that passes all the above checks is drawn on the chart as a high-probability Verified Cost Basis Zone. These are the "memory zones" where the market is likely to react upon a re-visit.
How to Use This Indicator
Cost Basis Zones (The Boxes):
Green Boxes: Bullish zones where Smart Money likely accumulated positions. When the price returns here, a BUY reaction is expected.
Red Boxes: Bearish zones where Smart Money likely distributed positions. When the price returns here, a SELL reaction is expected.
Zone Strength (★★★): Each zone is created with a star rating. More stars indicate a higher-confidence zone (based on factors like volume intensity and historical confirmation).
BUY/SELL Signals: A signal is only generated when the price enters a zone AND the confirmation filters (if enabled in the settings) are passed.
Zone Statuses:
Green/Red: Active and waiting to be tested.
Gray: The zone has been tested, and a signal was produced.
Dark Gray (Invalidated): The zone was broken decisively and is no longer considered valid support/resistance.
Key Settings
Signal Accuracy Filters: You can enable/disable three powerful filters to balance signal quantity and quality:
Momentum Confirmation (Stoch): Waits for momentum to align with the zone's direction.
Candlestick Confirmation (Engulfing): Waits for a strong reversal candle inside the zone.
Lower Timeframe MSS Confirmation: The most advanced filter; waits for a trend shift on a lower timeframe before giving a signal.
Historical Confirmation:
Require Historical Confirmation: Toggle the "Memory" feature on/off. Turn it off to see all potential SM zones.
Tolerance Calculation Method: Choose between a dynamic ATR Multiplier (recommended for all-around use) or a fixed Percentage to define the zone size.

OB/FVG Precision Overlap ZonesThis indicator highlights only the zones where Order Blocks (OBs) and Fair Value Gaps (FVGs) overlap, filtering out weaker signals. By focusing on these confluence areas, it helps identify higher-probability entries and cleaner risk to reward setups.

NQ Liquidity + Inverse FVG Strategy Alertsuses inversion FVG's and targets NQ liquidity
hhsajdhds
d
d
d
d
sa
s
a
s
dgasjjekkje
j
k

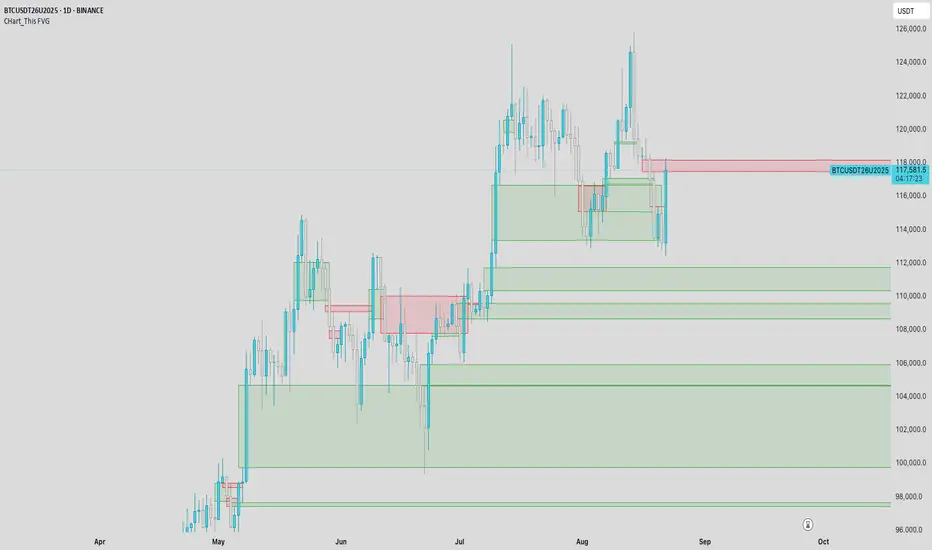
CHart_This FVGThis script will work on any time frame, and auto plots the classic ICT "fair value gaps", or imbalances, that result from a three candle formation wherein the middle candle body extends beyond the highs and lows of the end candles, leaving no overlap of the first and last candle wicks. Bullish imbalances are green, and bearish are red. Plotted zones will automatically close once a candle closure fully violates the imbalance zone with a close beyond its borders.