FVG LevelsFVG Levels Indicator Description
The FVG Levels indicator dynamically identifies and displays key price zones that may represent fair value gaps and order block areas, helping traders to visually pinpoint potential support and resistance levels directly on the chart.
Key Features
Order Block Identification:
The indicator detects bullish and bearish order blocks by analyzing specific candle patterns. For bullish zones, it checks if a candle two bars ago was bullish (close greater than open) coupled with a subsequent gap condition. Similarly, bearish zones are identified when bearish candle conditions are met with an appropriate gap.
Dynamic Zone Calculation:
It computes critical levels such as the highest highs, lowest lows, highest lows, and lowest highs over a series of recent bars. These levels define the boundaries of potential buy and sell zones and adjust dynamically as new price data comes in.
Visual Representation:
Buy zones are plotted in lime and sell zones in yellow, with the indicator filling the areas between the high and low lines to create clear, shaded bands. This visual aid helps in quickly recognizing zones of potential price reaction.
Chart Overlay:
Designed to work as an overlay, the indicator integrates directly onto your price chart, allowing for seamless correlation between price action and identified zones.
How It Works
Bullish Zones:
When a bullish candle (with the candle's close above its open) is detected along with a significant gap, the indicator marks the upper and lower boundaries of the bullish order block. It further refines these levels by tracking the lowest low and highest high over recent bars to enhance the zone's definition.
Bearish Zones:
In a similar manner, the indicator calculates bearish order blocks by confirming bearish candle conditions and corresponding gap criteria. It then updates the bearish zone levels and computes the highest high and lowest low to establish clear sell zone boundaries.
Usage
Traders can use the FVG Levels indicator to:
Identify potential entry and exit points by observing where price may reverse or consolidate.
Recognize fair value gaps or imbalances that often act as magnet points for price action.
Enhance risk management by using the dynamically calculated zones to set stop-losses or take-profits.
Cerca negli script per "fvg"

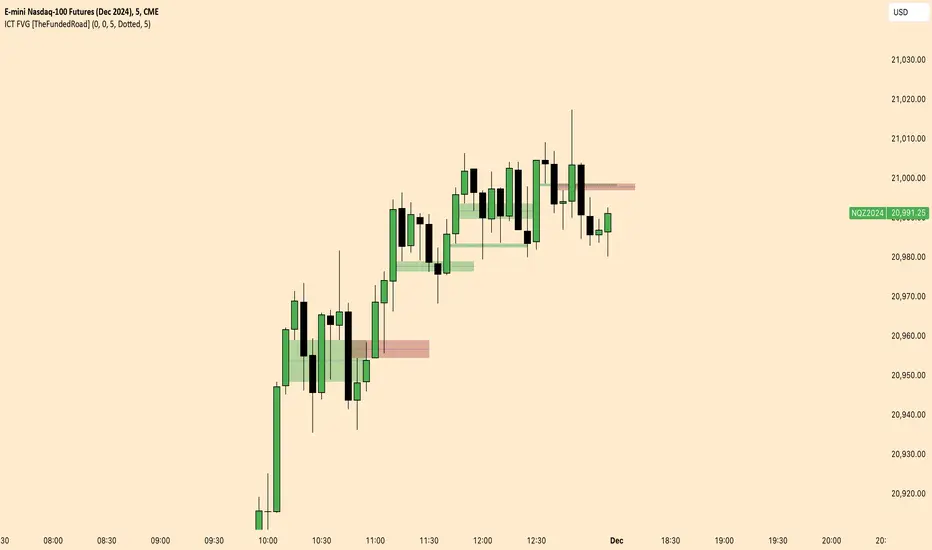
ICT FVG [TheFundedRoad]This indicator shows you all ICT Fair value gaps on chart with midpoint line
Fair value gap is a gap in a set of 3 candles, in a bullish FVG you have 1st candle high being lower than third candle low, and in a bearish FVG you have first candle low higher than third candle high, thats how this indicator finds these fair value gaps
It draws the fair value gap from the 2nd candle forward
You can customize the color and if you want to see the midpoint or not, midpoint is 50% of the gap
Implied Fair Value Gap (IFVG) ICT [TradingFinder] Hidden FVG OTE🔵 Introduction
The Implied Fair Value Gap (IFVG) is distinctive due to its unique three-candlestick formation, which differentiates it from conventional Fair Value Gaps.
Implied fair value represents an estimated worth of an asset—often a business or its goodwill—based on the price likely to be received in a structured transaction between market participants at a specific point in time.
In the ever-evolving world of technical analysis, pinpointing price reversal points and market anomalies can significantly enhance trading strategies and decision-making for traders and investors. Among the advanced concepts gaining traction in this field is the Implied Fair Value Gap (IFVG), introduced by the renowned analyst Inner Circle Trader (ICT).
This tool has proven to be an effective method for identifying hidden supply and demand zones in financial markets, offering a unique edge to traders looking for high-probability setups.
Unlike traditional gaps that are visible on price charts, IFVG is a hidden gap that doesn’t appear explicitly on the chart and thus requires specialized technical analysis tools for accurate identification.
This hidden gap can signal potential price reversals and offers traders insight into high-liquidity areas where price is likely to react. This article will guide you through using the ICT Implied Fair Value Gap Indicator effectively, covering its settings, usage strategies, and key features to help you make informed decisions in the market.
🟣 Bullish Implied FVG
🟣 Bearish Implied FVG
🔵 How to Use
The IFVG indicator is designed to assist traders in recognizing hidden support and resistance zones by identifying Bullish and Bearish IFVG patterns. With this tool, traders can make better-informed decisions about suitable entry and exit points for their trades based on these patterns.
🟣 Bullish Implied Fair Value Gap
This pattern occurs in an uptrend when a large bullish candlestick forms, with the wicks of the previous and following candles overlapping the body of the central candlestick.
This overlap creates a demand zone or a hidden support level, which can act as an ideal entry point for buy trades. Often, when the price returns to this area, it is likely to resume its upward trend, presenting a profitable buying opportunity.
🟣 Bearish Implied Fair Value Gap
This pattern is similar but forms in downtrends. Here, a large bearish candlestick appears on the chart, with the wicks of adjacent candles overlapping its body. This overlap defines a supply zone or a hidden resistance level and serves as a signal for potential sell trades.
When the price returns to this zone, it often continues its downward trend, providing an optimal point for entering sell trades.
The IFVG indicator also includes various filters that traders can use to refine their analysis based on market conditions. These filters, including Very Aggressive, Aggressive, Defensive, and Very Defensive, allow users to customize the IFVG zones' width, offering flexibility according to the trader’s risk tolerance and trading style.
🟣 Example Trading Scenarios
Suppose you’re in a strong uptrend and the IFVG indicator identifies a Bullish IFVG zone. In this scenario, you could consider entering a buy trade when the price retraces to this zone, expecting the uptrend to resume. Conversely, in a downtrend, a Bearish IFVG zone can signal a favorable entry point for short trades when the price revisits this area.
🔵 Settings
Implied Block Validity Period: This parameter specifies the validity period of each identified block, taking into account the number of bars that have passed since its formation. Proper adjustment of this period helps traders focus only on relevant zones, increasing the accuracy of the analysis.
Mitigation Level OB : This option defines the mitigation level for supply and demand blocks (Order Blocks), with settings including Proximal, 50% OB, and Distal.
Depending on the selected level, the indicator will focus on closer, mid-range, or farther points for block identification, allowing traders to adjust for the level of precision required.
Implied Filter : Activating this filter allows traders to apply conditions based on the width of the IFVG zones. With options like Very Aggressive and Very Defensive, traders can control the width of IFVG zones to suit their risk management strategy—whether they prefer high-risk setups or low-risk setups.
Display and Color Settings : This section enables users to customize the appearance of the IFVG zones on their charts. Traders can set different colors for Bullish and Bearish zones, allowing for easier distinction and improved visualization.
Alert Settings : One of the standout features of the IFVG indicator is the alert system. By setting up alerts, users can be notified whenever the price approaches a demand or supply zone.
Alerts can be customized to trigger Once Per Bar (one alert per bar) or Per Bar Close (alert at the close of each bar), ensuring that traders stay updated on critical price movements without needing to monitor the chart continuously.
🔵 Conclusion
The ICT Implied Fair Value Gap (IFVG) indicator is a powerful and sophisticated tool in technical analysis, allowing professional traders to identify hidden supply and demand zones and use them as entry and exit points for buy and sell trades.
This indicator’s automatic detection of IFVG zones helps traders uncover hidden trading opportunities that can enhance their analysis.
While the IFVG indicator offers numerous advantages, it is important to use it in conjunction with other technical analysis tools and sound risk management practices.
IFVG alone does not guarantee profitability in trading; it works best when combined with other indicators such as volume analysis and trend-following indicators for a comprehensive trading strategy.

Fair Value Gaps (FVG) [UAlgo]A fair value gap is especially popular among price action traders and occurs when there are inefficiencies or imbalances in the market, or when the buying and selling are not equal. Fair value gaps can become a magnet for the price before continuing in the same direction.
🔶 Key Features :
Fair Value Gap Identification:
Bullish fair value gaps occur when the current market price exceeds the previous high. The indicator identifies bullish gaps by comparing the low of the current candle with the high of the candle two candles ago . If the low of the current candle is higher than the high two candles ago and the closing price of the previous candle is also higher than the high two candles ago, a bullish fair value gap is detected.
Bearish fair value gaps occur when the current market price falls below the previous low. The indicator identifies bearish gaps by comparing the high of the current candle with the low of the candle two candles ago. If the high of the current candle is lower than the low two periods ago and the closing price of the previous candle is also lower than the low two candles ago, a bearish fair value gap is detected.
Fair Value Gap Filter :
ATR measures market volatility by analyzing the range of price movements over a specified period. It provides insights into the average price range that a security experiences within a given timeframe. After the ATR is calculated, a Simple Moving Average (SMA) is computed for the ATR values. This moving average smoothens out the ATR data, providing a clearer indication of the average volatility levels over time.
When the filter is active, fair value gaps are identified only if they occur during periods of relatively higher volatility, as indicated by the ATR being greater than the SMA. This helps in refining and obtaining the detection of stronger fair value gaps
An example with FVG filtering off:
An example with FVG filtering on:
Customizable Settings: Users have the flexibility to customize various parameters to suit their trading preferences. They can adjust settings such as the number of fair value gaps displayed, mitigation method (either based on closing prices or wicks), and apply filters based on Average True Range (ATR) to refine gap detection.
🔶 Disclaimer :
Use with Caution: Trading involves significant risk, and this indicator should be used with caution. While it can help identify potential trading opportunities, it does not guarantee profits and may sometimes provide false signals.
Not Financial Advice: The information provided by the Fair Value Gaps indicator is for educational and informational purposes only and should not be considered as financial advice. Traders should conduct their own research and consult with financial professionals before making any trading decisions.
Past Performance: Past performance is not indicative of future results. Historical price movements analyzed by the indicator may not accurately predict future market behavior.

HTF FVG and Wick Fill trackingImbalances in the charts are some of the clearest and most traded price areas. Two of the best and most used are fair value gaps FVGs and large candle wicks. In both of these price appears to move in such a way that most are left behind having 'missed' the move. But in reality price will often come back to these price points to re-balance and absorb the liquidity that was left behind.
This indicator takes these areas and makes viewing and tracking them clearer than ever. It does this, by first allowing the user to overlay a higher timeframe candle on the current chart. This in itself provides an in depth look at a higher timeframe candle both as it forms and in its final form.
Next the indicator identifies either the FVG or large wicks, on the chosen higher timeframe, all while the chart remains on a lower timeframe. As seen here the fair value gaps are clearly highlighted, taken from a 4 hour timeframe, while the actual chart is on 15 minutes. This allows the user even greater accuracy in identifying their key trading areas.
Utilizing the indicators unique feature, these areas can optionally be extended forward to the current timeframe and 'filled' in realtime. Areas that are filled to the users defined level, will be removed from the chart.
With supplementary settings for how much history to show, how large of a wick should be highlighted and complete control over the colour scheme, users will be able to track and understand the filling of imbalances like never before.

Displacement (Two FVGs)A simple indicator that attempts to identify displacement in price by alerting you when two simultaneous Fair Value Gaps (FVGs) occur.
When two fair value gaps occur, the indicator will print a green bar (if bullish) or a red bar (if bearish). If you right click on the indicator you can turn on alerts that will pop up every time a dual FVG occurs.
Fair Value Gaps are most commonly used amongst price action traders and are defined as instances in which there are inefficiencies, or imbalances, in the market.
The concept for this indicator is very simple. Apply it to your chart and enable alerts on the instruments and timeframe you trade. When you get an alert, it could indicate larger players getting involved.
This is NOT a trading strategy. Its intention is to save time by alerting you to large imbalances in price on the instruments you trade.

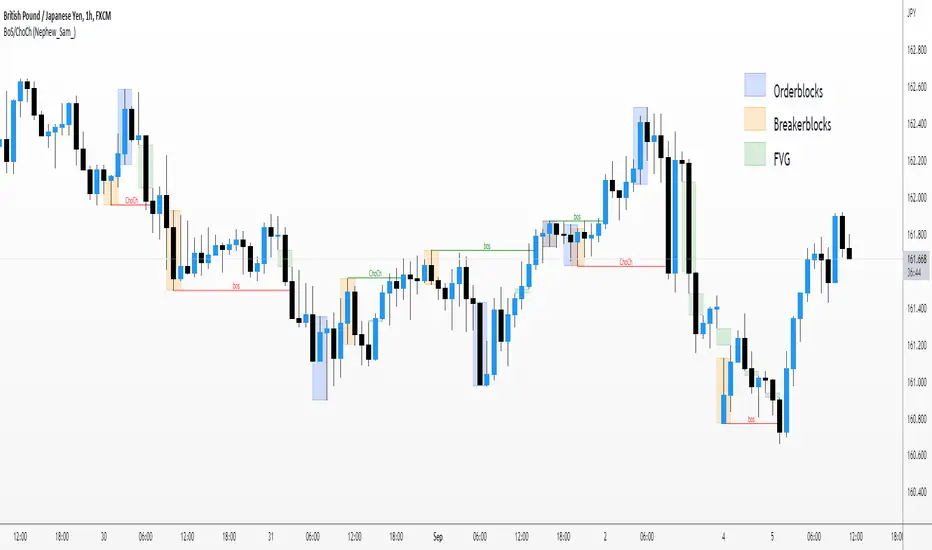
Market Structure BOS/CHOCH/MSB/FVG/OB/BB (Nephew_Sam_)This market structure indictor uses pivot points to find break of structure and change of character.
You can enable the options to find Fair Value Gaps, Breaker Blocks and Orderblocks too. The way this works is, once a bos/choch is found, it will loop back and find all fvg/ob/bb from that point until the previous pivot point.
Settings
Pivot strength - How many candles to the left/right requried to determine a swing high
Breakout Confitmation - The breakout candle should close under the previous pivot or the wick H/L should be under
Show xyz - show HH/LL, Break of structure and change of character
FVG/OB/BB - Show, bull/bear colors, extend boxes to the right, delete boxes once filled, fill type close or H/L
Sonarlab - MTF Imbalance/ FVGAn imbalance is created when the order block creates such impulsive volume in the market that it throws off the equilibrium between buyers and sellers, forming a gap. This is referred to as imbalance or FVG. These gaps act as a magnet for price to retrace to, in order to correct the disturbance in market equilibrium.
Imbalances = FVG
This image above shows you how an imbalance is created in the market using 3 candles. As we all know, candle sticks represent a specific time-range - for example: 1H. This means that inside 1 candle stick, there are 60 1 minute candle sticks resting. What I'm trying to say with this is that you get a totally different picture when you are on the lower timeframes. An imbalance can be overlooked, so it can be very helpful to have the multiple timeframe Imbalances on your screen, so you understand what is actually going on in the bigger picture.
Usage
Focused on combining with SMC:
When trading SMC, Imbalances can be great for POI's (point of interests) or using as targets in the market. Imbalances work like magnets in the market. When the market is imbalanced, it mostly wants to balance those gaps and can sometimes react perfectly from the area's. Besides that, it can really give you an idea who is in control at that moment.
Here you can see an example of an Imbalance when on the 1H timeframe - in the next picture below you can see the exact same imbalance, but then on the 3M. Now you understand why it can be overlooked?
So, imbalances/ FVG's:
- Increase probability of certain Point of Interests
- Can be a sign of strong interest in price areas
- Can be used as targets
- Can be used as POI's
What makes this Imbalance indicator different?
The Sonarlab MTF Imbalance indicator makes it possible to show up to 3 higher timeframes, which makes it easier to do your analysis and spot these areas when trading.
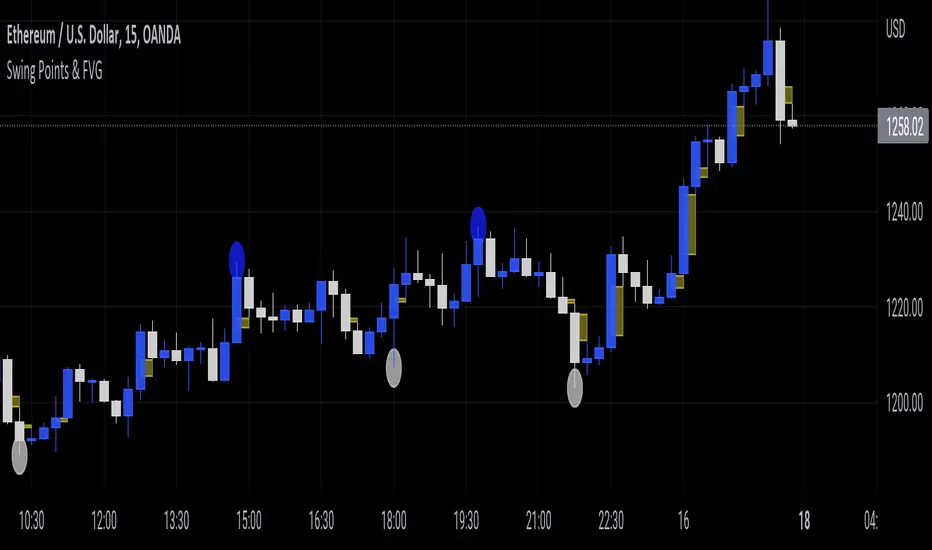
Swing Points & FVGClassic ITH/ITL
Intermediate Term High - High that has short term high on either of it's side.
Intermediate Term Low - Low that has short term low on either of it's side.
FVG
The indicator also marks Fair Value Gaps which is a very important concept in price action trading. FVGs are formed when there is ineffeciency,or imbalance, in the market.
Rebalanced ITH/ITL
Rebalanced ITH - A short term high that rebalanced the ineffeciency in price can be considered as an Intermediate Term High.
Rebalanced ITL - A short term low that rebalanced the ineffeciency in price can be considered as an Intermediate Term Low.
Use the ITH and ITL points marked by the indicator to determine the structure of the market.
Indicator repaints only when it tries to identify the latest ITH/ITL.
PT FVG ImbalancesVersion 1.0 of the PT FVG Gaps & Flat Opens was developed to visually identify any imbalances in price. This indicator can be used on all timeframes.
Fair Value Gaps are a key component when trading price action. They are derived from zones in liquidity where price moved quickly in a certain direction leaving gaps behind. These areas tend to act as magnets to price throughout the trading session of that timeframe.
PT FVG Features:
-Gaps that have been partially filled will shade darker to show price has already attempted to fill that gap before (Toggle Highlight Gap Fill).
-Gaps that have been partially filled will remove a portion of the background zone to indicate how much gap is left to fill in the full zone (Toggle Highlight Remaining Gap).
Flat Open Candles are derived from candles that open without a wick (wickless candles). Price more often than not tends to gravitate towards these areas in the near future to fill the wickless candle before continuing on with the trend. Can be used on all timeframes, but the higher the timeframe holds more weight.
PT Flat Open Features:
-Flat open sensitivity would recommend keeping it around 30-50. If scalping keep it sub 30. This feature determines how many flat opens you want on your chat at one time.
-Delete flat open line allows us to delete the line once price has filled the wickless candle.
Video with strategy will be uploaded shortly! It is included as part of the library. Just message us for access!

Fractal Break Imbalance / Fair Value Gap (FVG) / Liquidity VoidFractal Break Imbalance / Fair Value Gap (FVG) / Liquidity Void
Order imbalances in either direction, either excess buy or sell orders, reduce liquidity. The market will seek to fill gaps sooner or later. The script marks an imbalance / FVG after a fractal break. It also marks any other imbalance.
Default Colours:
Green - Imbalance after fractal break to the upside
Red - Imbalance after fractal break to the downside
Yellow - Other imbalances
How To Use:
Gaps can be used to determine possible entries and targets. Those familiar with liquidity raids, supply and demand, and ICT concepts may realise it's potential.
Indicator in use:

Super OrderBlock / FVG / BoS Tools by makuchaku & eFeThis super indicator is a Swiss army knife for Smart Money traders for OrderBlocks / FVG / BoS
It provides many options for drawing (non-repainting) boxes for OrderBlocks, Fair Value Gaps (FVG) and Break of Structures. The boxes are extended into the future, until the first retest/mitigation.
Some of the additional options (not explained in the diagrams above)
PPDD OB : An order block which is formed after interacting with Liquidity (old low/high, fractal low/high, etc). Since these OB's are in the most premium or most discount, they are Premium Premium Discount Discount OB's (PPDD OB)
HVB Bars : When the volume of any bar is higher than the average volume of last N bars, it could mean something important (in the right context). Hence, the indicator allows for coloring them differently.
This indicator was built as a collaboration between @makuchaku & eFe
Pro tip : This indicator is a simply a tool to visualize trading concepts on the candle stick chart. It is the job of the trader to sequence these effectively into a profitable trade.
If you come across any bug or have a question on how to effectively use the indicator, please don't hesitate to ask questions.
Good luck & good trading!

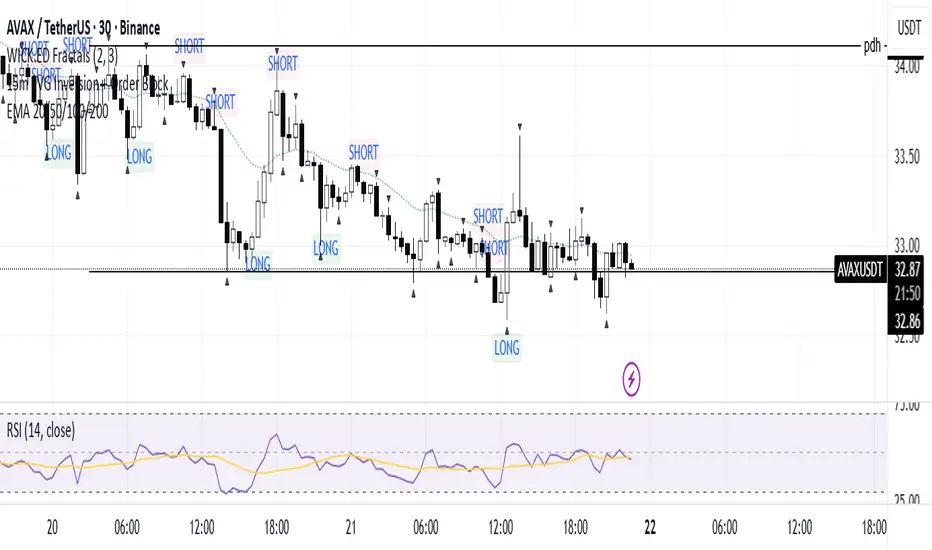
15m FVG Inversion + Order BlockThe indicator finds the inversion of the FVG 15 minutes and the order block, after which it gives an entry signal.
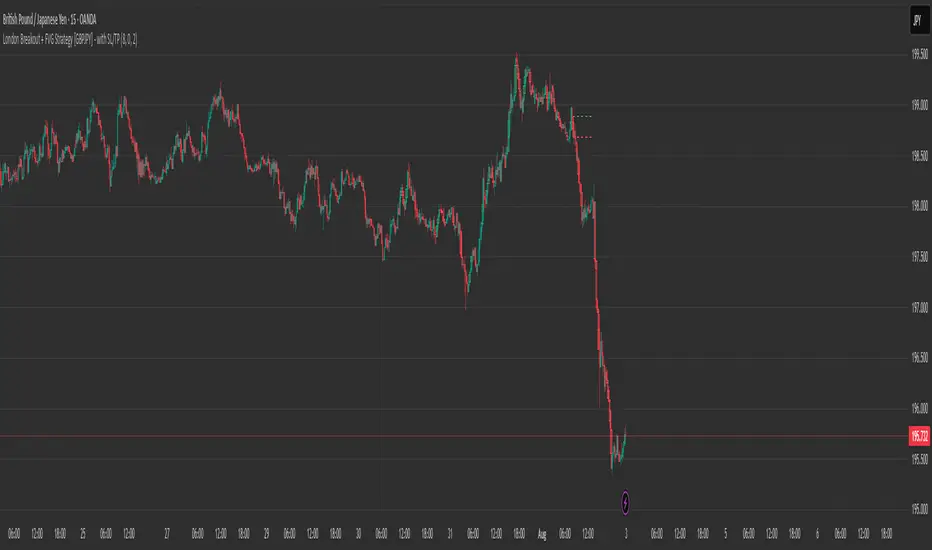
London Breakout + FVG Strategy [GBPJPY] - with SL/TPMarks the London open high and low on 15 min time frame, ads fvg on 5 min for orders
Liquidity Voids (FVG) [LuxAlgo]The Liquidity Voids (FVG) indicator is designed to detect liquidity voids/imbalances derived from the fair value gaps and highlight the distribution of the liquidity voids at specific price levels.
Fair value gaps and liquidity voids are both indicators of sell-side and buy-side imbalance in trading. The only difference is how they are represented in the trading chart. Liquidity voids occur when the price moves sharply in one direction forming long-range candles that have little trading activity, whilst a fair value is a gap in price.
🔶 USAGE
Liquidity can help you to determine where the price is likely to head next. In conjunction with higher timeframe market structure, and supply and demand, liquidity can give you insights into potential price movement. It's essential to practice using liquidity alongside trend analysis and supply and demand to read market conditions effectively.
The peculiar thing about liquidity voids is that they almost always fill up. And by “filling”, we mean the price returns to the origin of the gap. The reason for this is that during the gap, an imbalance is created in the asset that has to be made up for. The erasure of this gap is what we call the filling of the void. And while some voids waste no time in filling, some others take multiple periods before they get filled.
🔶 SETTINGS
The script takes into account user-defined parameters and detects the liquidity voids based on them, where detailed usage for each user-defined input parameter in indicator settings is provided with the related input's tooltip.
🔹 Liquidity Detection
Liquidity Voids Threshold: Act as a filter while detecting the Liquidity Voids. When set to 0 basically means no filtering is applied, increasing the value causes the script to check the width of the void compared to a fixed-length ATR value
Bullish: Color customization option for Bullish Liquidity Voids
Bearish: Color customization option for Bearish Liquidity Voids
Labels: Toggles the visibility of the Liquidity Void label
Filled Liquidity Voids: Toggles the visibility of the Filled Liquidity Voids
🔹 Display Options
Mode: Controls the lookback length of detection and visualization
# Bars: Lookback length customization, in case Mode is set to Present
🔶 RELATED SCRIPTS
Buyside-Sellside-Liquidity
Fair-Value-Gaps

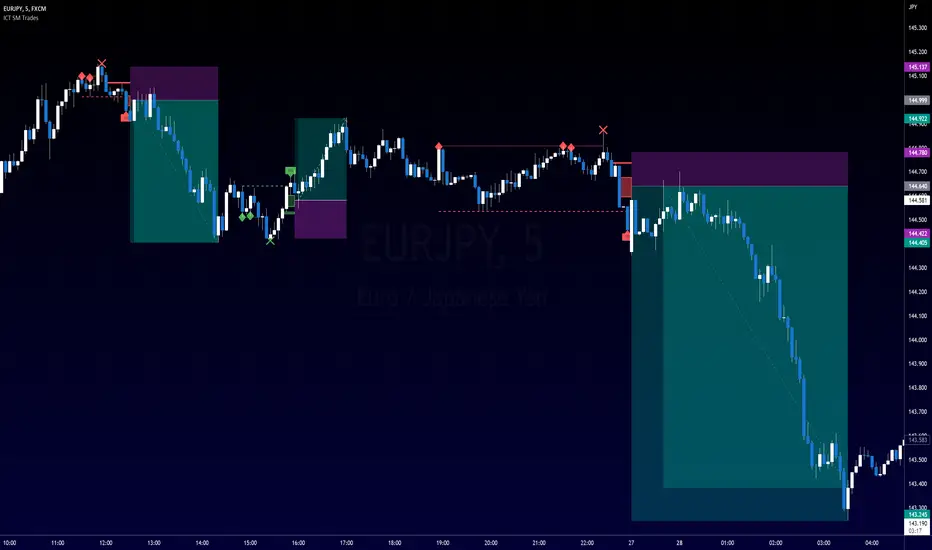
ICT SM Trades (liquidity find & grab, MSS, FVG, killzones)Indicator looks for ICT & Smart Money trades on any timeframe. These types of trades reveal how the big institutions, banks and hedge funds trade with big money. If they want their very big positions to be filled they need to find areas in chart where the majority of the money is sitting. Where is it? Where is the majority of orders placed? Right below supports or right above resistance, these orders are stoplosses or stop orders. So they need to push the price to these areas, take all the available stoplosses and trigger all the available stop orders in order to fill their positions and then push the price to the opposite side to make profit (and retail to lose).
Indicator looks for support or resistance (S/R) areas which are represented by dotted lines. This S/R areas are created by minimum of 2 pivot high/low (H/L). Every pivot H/L that creates the S/R area is marked with diamond label. This S/R area is called liquidity. After liquidity is created, indicator looks for liquidity grab (mostly represented by fast spike to this area - it is labeled with x-cross) and then price should go fast to the opposite side of the created structure. Indicator considers as a created structure everything that was created on the other side of the candles from the oldest pivot H/L which creates particular liquidity. For example, if liquidity is created with 3 pivot highs, indicator looks at the oldest pivot high and from there it is looking for the lowest low. Under this lowest low is dashed line which means that this level should be broken with closed candle. This action is called market structure shift (MSS), when the price shifted very fast from highs to lows. After MSS, when the price went fast to one direction, there were some imbalances in prices, in our example selling pressure was a lot bigger than buying pressure and there were created some long untested bearish candles. This untested areas in candles are called imbalances or gaps of fair value gaps (FVG). These are labeled with rectangles. It is expected that these gaps will be tested in near future to "balance the market".
We can put limit orders into these gaps and await some retracement after MSS to open our positions and after the positions are opened we can expect trend continuation in the direction where market structure shift was made (away from liquidity grab). So stoplosses can be placed above/below liquidity grab candle (marked with x-cross).
In settings of the indicator you can set whether only long or only short trades will be shown. Long trades are green and short trades are red. You can set if fair value gaps will be shown as well. The last thing in settings is session. You can set custom session which will be shown as background color on your chart.
FVG & SMA @danciFVG zones with 200 SMA & daily dividers for intraday analysis, customizable and clear.

FVG Tracker"FVG Tracker" plots three‑candle fair value gaps on the chart as semi‑transparent grey boxes. It automatically clears and redraws the current gap each bar and fires a single alert whenever a new imbalance zone is detected on any timeframe you need.

FVG Finder [PLLP]///////////////////////////
ENGLISH (Spanish follows)
///////////////////////////
It is an indicator that shows the FVG (Fair Value Gap) generated by prices in any type of market.
These gaps are important because price generally tends to go through these bounds again and fill in the gaps, which can be a predictor of price action.
As main and differentiating characteristics of this indicator we have that:
Provides key data on each FVG.
It is highly configurable at the behavior level
It is highly configurable on an aesthetic level.
Includes a statistics panel that allows a quick view of the behavior of the FVGs in the asset and work timing.
Basic operation of the indicator:
This indicator draws a box for each FVG it identifies. For each FVG we will have the input level, or 'IN Boundary', and the output level, or 'OUT Boundary'. The box corresponding to the FVG is limited by the 'IN Boundary' and 'OUT Boundary' levels.
Likewise, each FVG will be assigned an 'Entry Price' and an 'Exit Price'.
The entry price or 'Entry Price' is determined as the entry level of the FVG ('IN Boundary') increased according to the 'Entry Percentage'.
The exit price or 'Exit Price' is determined as the exit level of the FVG ('OUT Boundary') decreased according to the 'Exit Percentage'.
The 'Input Percentage' and 'Output Percentage' can vary from 0 to 50:
>>> When the 'Entry Percentage' is set to 0 it means that the 'Entry Price' coincides with the 'IN Boundary' and when it is set to 50 it means that it is set at the central level of the FVG.
>>> When the 'Exit Percentage' is set to 0 it means that the 'Exit Price' matches the 'Exit Limit' and when it is set to 50 it means that it is set at the central level of the FVG.
It will be considered that a FVG can have 3 states:
>>> 'Clean': when the price has never yet reached the 'Entry Price'.
>>> 'Touched': when the price has reached the 'Entry Price' but not the 'Exit Price'.
>>> 'Sunk': when the price has reached the 'Exit Price'.
Within each FVG the following information is displayed:
Icon that represents the state of the FVG.
Percentage of price variation between the 'Entry Price' and the 'Exit Price'.
Date and time the FVG is created.
Date and time when the FVG goes into 'Sunk' status.
Number of times a FVG has been 'touched'.
>>> An FVG is considered to have been 'touched' when a candle pierces the 'Entry Price', that is, when the 'high' of a candle is above the 'Entry Price' and the 'low' below, or vice versa.
>>> The first time a FVG is 'touched' its status changes from 'Clean' to 'Sunk'.
The statistics panel displays the following information for either bullish FVGs (second column), bearish FVGs (third column) or the total FVG set (fourth column) regardless of whether it is bullish or bearish:
Number of FVGs that are in the 'Clean' state, that is, that have never been 'touched'.
Number of FVGs that are in the 'Touched' state, that is, that have been 'touched' at some time but have not yet been drilled to 'Exit Price', that is, they have not yet evolved to the 'Sunk' state .
Number of FVGs that are in the 'Sunk' state.
Number of FVG that the first time you see that they have been 'touched' for the first time have also been 'pierced'. Therefore, it corresponds to the number of FVG in which the first 'touch' of the price manages to reach the 'Exit Price' and, therefore, the status changes directly from 'Clean' to 'Sunk' in that same candle.
Mean number of times a FVG is 'touched' before evolving to the 'Sunk' state. This average is only calculated on the FVG in the 'Sunk' state.
Percentage of FVG in 'Sunk' state with respect to the total FVG.
Percentage of FVG whose 'Exit Price' has been pierced on the same candle in which it has been 'touched' for the first time. In other words, it represents the percentage of FVG that have passed from the 'Clean' to 'Sunk' state in a single candle with respect to the total of FVG in 'Sunk' state.
At the behavioral level, the configuration options stand out for:
Possibility of establishing the percentage for the 'Entry Price' and for the 'Exit Price' of the FVG.
Possibility of establishing the minimum price range percentage between the 'Entry Price' and the 'Exit Price' of the FVG. This makes it possible to hide FVGs that have very small price variations.
Possibility of filtering between which start date and which end date you want to calculate the FVG.
On an aesthetic level, the configuration options stand out for:
Possibility of being able to configure the color of bullish and bearish FVGs depending on their status ('Clean', 'Touched' or 'Sunk').
Possibility of configuring the color and type of the bullish and bearish FVG price entry and exit lines depending on their status ('Clean', 'Touched' or 'Sunk').
Possibility of configuring the color of the candles that have 'touched' a FVG (they have pierced the 'Entry Price') and of those that have pierced the 'Exit Price' (they have made it evolve to the 'Sunk' state) .
Possibility of using a custom icon within the FVG text depending on its status.
Possibility of showing, or not, the FVGs in 'Sunk' state. This allows to have a vision only of the 'past of the FVG' or only of the 'future of the FVG' (those that have not yet been sunk).
Possibility of showing, or not, the FVGs in NO 'Sunk' state. This allows to have a vision only of the 'past of the FVG' or only of the 'future of the FVG' (those that have not yet been sunk).
Possibility to show, or not, the number of times a FVG has been 'touched'.
Possibility of showing, or not, when the FVG is created and when it goes to 'Sunk' status.
Possibility of showing, or not, the statistics panel as well as choosing its location, the colors of the cells and the font size.
WARNING:
1) Due to TradingView's limitations on the number of boxes and lines that can be added to a chart, it is advisable to always apply a value of no less than '0.1' for the 'Minimum FVG price travel' setting.
2) Due to the internal calculations that this indicator requires, the loading time can be long. In the event that the indicator does not load and a 'time out' error is obtained, the value of the 'Minimum FVG price travel' configuration parameter must be increased, thus reducing the number of FVGs that will be identified.
///////////////////////////
ESPAÑOL
///////////////////////////
Se trata de un indicador que muestra los FVG (Fair Value Gap) que generan los precios en cualquier tipo de mercado.
Estos gaps son importantes porque, en general, el precio tiende a pasar por estas cotas nuevamente y rellenar los gaps, lo cual puede constituir una manera de predecir la acción del precio.
Como características principales y diferenciadoras de este indicador tenemos que:
Aporta datos clave de cada FVG.
Es altamente configurable a nivel de comportamiento
Es altamente configurable a nivel estético.
Incorpora un panel de estadísticas que permite obtener de manera rápida una visión del comportamiento de los FVG en el activo y temporalidad de trabajo.
Funcionamiento básico del indicador:
Este indicador dibuja un recuadro para cada FVG que identifica. Para cada FVG tendremos el nivel de entrada, o 'IN Boundary', y el nivel de salida u 'OUT Boundary'. El recuadro que corresponde al FVG queda limitado por los niveles 'IN Boundary' y 'OUT Boundary'.
Asimismo, a cada FVG se le asignará un 'Entry Price' y un 'Exit Price'.
El precio de entrada o 'Entry Price' se determina como el nivel de entrada del FVG ('IN Boundary') incrementado según el 'Entry Percentage'.
El precio de salida o 'Exit Price' se determina como el nivel de salida del FVG ('OUT Boundary') decrementado según el 'Exit Percentage'.
El 'Entry Percentage' y 'Exit Percentage' pueden variar de 0 a 50:
>>> Cuando el 'Entry Percentage' se establece a 0 significa que el 'Entry Price' coincide con el 'IN Boundary' y cuando se establece a 50 significa que se establece al nivel central del FVG.
>>> Cuando el 'Exit Percentage' se establece a 0 significa que el 'Exit Price' coincide con el 'OUT Boundary' y cuando se establece a 50 significa que se establece al nivel central del FVG.
Se considerará que un FVG puede tener 3 estados:
>>> 'Clean': cuando el precio aun no ha alcanzado nunca el 'Entry Price'.
>>> 'Touched': cuando el precio ha alcanzado el 'Entry Price' pero no el 'Exit Price'.
>>> 'Sunk': cuando el precio ha alcanzado el 'Exit Price'.
Dentro de cada FVG se muestra la siguiente información:
Icono que representa el estado del FVG.
Porcentaje de variación del precio entre el 'Entry Price' y el 'Exit Price'.
Fecha y hora en que se crea el FVG.
Fecha y hora en que se el FVG pasa a estado 'Sunk'.
Número de veces en que un FVG ha sido 'tocado'.
>>> Se considera que un FVG ha sido 'tocado' cuando una vela perfora el 'Entry Price', es decir, cuando el 'high' de una vela está por encima del 'Entry Price' y el 'low' por debajo, o viceversa.
>>> La primera vez que un FVG es 'tocado' su estado pasa de 'Clean' a 'Sunk'.
El panel de estadísticas muestra las siguientes informaciones tanto para los FVG alcistas (segunda columna), los FVG bajistas (tercera columna) o el conjunto del total de FVG (cuarta columna) sin importar si es alcista o bajista:
Número de FVG que están en estado 'Clean', es decir, que nunca han sido 'tocados'.
Número de FVG que están en estado 'Touched', es decir, que alguna vez han sido 'tocados' pero aún no han sido perforados hasta el 'Exit Price', es decir, aún no han evolucionado al estado 'Sunk'.
Número de FVG que están en estado 'Sunk'.
Número de FVG que la primera vez que en la misma vea en que han sido 'tocados' por primera vez también han sido 'perforados'. Se corresponde, por lo tanto, el número de FVG en que el primer 'toque' el precio consigue alcanzar el 'Exit Price' y, por lo tanto, el estado pasa en esa misma vela de 'Clean' a 'Sunk' directamente.
Media del número de veces que un FVG es 'tocado' antes de evolucionar hasta el estado 'Sunk'. Esta media solo se calcula solamente sobre los FVG en estado 'Sunk'.
Porcentaje de FVG en estado 'Sunk' respecto el total de FVG.
Porcentaje de FVG cuyo 'Exit Price' ha sido perforado en la misma vela en que ha sigo 'tocado' por primera vez. Es decir, representa el porcentaje de FVG que han pasado del estado 'Clean' a 'Sunk' en una única vela respecto el total de FVG en estado 'Sunk'.
A nivel de comportamiento las opciones de configuración destacan por:
Posibilidad de establecer el porcentaje para el 'Entry Price' y para el el 'Exit Price' del FVG.
Posibilidad de establecer el porcentaje mínimo de recorrido del precio entre el 'Entry Price' y el 'Exit Price' del FVG. Esto permite ocultar los FVG que presenten variaciones muy pequeñas del precio.
Posibilidad de filtrar entre qué fecha inicio y qué fecha fin se desea calcular los FVG.
A nivel estético las opciones de configuración destacan por:
Posibilidad de poder configurar el color de los FVG alcistas y bajistas en función de su estado ('Clean', 'Touched' o 'Sunk').
Posibilidad de configurar el color y tipo de las líneas de entrada y salida del precio de los FVG alcistas y bajistas en función de su estado ('Clean', 'Touched' o 'Sunk').
Posibilidad de configurar el color de las velas que han 'tocado' un FVG (han perforado el 'Entry Price') y del de las que han perforado el 'Exit Price' (lo han hecho evolucionar al estado 'Sunk').
Posibilidad de utilizar un icono personalizado dentro del texto del FVG dependiendo del estado de éste.
Posibilidad de mostrar, o no, los FVG en estado 'Sunk'. Esto permite tener una visión únicamente del 'pasado de los FVG' o bien únicamente del 'futuro de los FVG' (los que aún no han sido hundidos).
Posibilidad de mostrar, o no, los FVG en estado NO 'Sunk'. Esto permite tener una visión únicamente del 'pasado de los FVG' o bien únicamente del 'futuro de los FVG' (los que aún no han sido hundidos).
Posibilidad de mostrar, o no, el número de veces que un FVG ha sido 'tocado'.
Posibilidad de mostrar, o no, cuándo se crea el FVG y cuándo pasa a estado 'Sunk'.
Posibilidad de mostrar, o no, el panel de estadísticas así como de elegir la ubicación de éste, los colores de las celdas y el tamaño de la fuente.
ADVERTENCIA:
1) Debido a las limitaciones de TradingView respecto el número de cajas y líneas que se pueden añadir a un gráfico, es aconsejable aplicar siempre un valor no inferior a '0.1' para el parámetro de configuración 'Minimum FVG price travel'.
2) Debido a los cálculos internos que requiere este indicador el tiempo de carga puede ser elevado. En el caso de que el indicador no se cargue y se obtenga un error de 'time out' debe incrementarse el valor del parámetro de configuración 'Minimum FVG price travel' reduciéndose así la cantidad de FVG que se identificarán.

FVG Range Filter0x278's FVG Range Filter
Overview
The FVG Range Filter is a TradingView indicator designed to identify and display Fair Value Gaps (FVGs) on your chart. FVGs are areas of price imbalance that often act as significant zones for potential price retracement or reversal. This indicator filters out irrelevant gaps, showing only those that are within a specified price range and time frame, making it easier to focus on high-probability trading opportunities.
This guide is crafted to help both novice and experienced traders understand how to use this indicator effectively, even if you're new to the concept of FVG trading. We'll cover what FVGs are, how the indicator works, how to interpret its visual elements, and how to apply it in various trading scenarios.
What are Fair Value Gaps (FVGs)?
Fair Value Gaps occur when the price of an asset moves so quickly in one direction that it leaves a 'gap' or 'void' on the chart where no trading activity occurred. These gaps represent areas of imbalance between supply and demand, often created by strong buying or selling pressure. Traders use FVGs to identify potential areas where price might return to 'fill' the gap, offering opportunities for entries or exits.
Bullish FVG : This happens when price jumps upward, leaving a gap below. It suggests strong buying pressure and often acts as a support zone when price retraces.
Bearish FVG : This occurs when price drops sharply, leaving a gap above. It indicates strong selling pressure and often acts as a resistance zone when price retraces.
How the FVG Range Filter Works
The FVG Range Filter indicator automatically detects these gaps based on a specific three-bar pattern that identifies significant price imbalances. It then applies filters to ensure only relevant FVGs are displayed:
Range Filter : Only shows FVGs whose midpoint is within a user-defined percentage of the current price. This keeps the focus on gaps that are close enough to be actionable.
Time Filter : Only displays FVGs that are younger than a specified number of bars, ensuring you're looking at recent and relevant price action.
Invalidation : Once the price trades through the midpoint of an FVG, the gap is considered 'filled' or invalidated, and it is removed from the chart.
This filtering mechanism declutters your chart, highlighting only the most pertinent FVGs for your trading decisions.
Indicator Settings
The FVG Range Filter offers customizable inputs to tailor its behavior to your trading style:
Display Range (%) : This sets the percentage range from the current price within which FVGs are shown. A lower value (e.g., 1.0%) shows only gaps very close to the current price, while a higher value (e.g., 5.0%) includes gaps further away. Default is 1.0%.
Look-back Bars : This determines how far back in time the indicator looks for FVGs. It also limits how long a gap remains visible if it hasn't been invalidated. Default is 1000 bars.
Show Bullish FVGs : Toggle to display bullish FVGs (green boxes by default). Default is enabled.
Show Bearish FVGs : Toggle to display bearish FVGs (red boxes by default). Default is enabled.
Box Opacity (0-100) : Adjusts the transparency of the FVG boxes on the chart. A value of 0 is fully transparent (invisible), while 100 is fully opaque. Default is 33 for a subtle appearance.
Visual Elements and Interpretation
The indicator draws rectangular boxes on your chart to represent FVGs. Understanding these visual elements is key to using the indicator effectively:
Green Boxes : Represent bullish FVGs. These are areas where price gapped upward, suggesting potential support zones. If price retraces to this area, it might bounce off as buyers step in to defend the level.
Red Boxes : Represent bearish FVGs. These are areas where price gapped downward, indicating potential resistance zones. If price retraces to this area, it might face selling pressure and reverse downward.
Box Position and Extension : Each box starts at the bar where the FVG was detected and extends to the right, updating dynamically as new bars form. This extension helps maintain visibility until the gap is either invalidated or falls out of the look-back period.
Disappearance of Boxes : A box disappears from the chart in two scenarios:
Price Moves Away : If the midpoint of the FVG moves outside the specified display range percentage from the current price, or if the FVG becomes older than the look-back bars limit, the box is removed (though the gap data persists in memory for potential re-display if conditions are met again).
Invalidation : If price trades through the midpoint of the FVG (i.e., the low of a candle goes below the midpoint for a bullish FVG, or the high goes above the midpoint for a bearish FVG), the gap is considered filled, and the box is permanently removed from the chart.
Trading Scenarios with FVG Range Filter
Below are detailed trading scenarios to help you understand how to use the FVG Range Filter in practical situations. These scenarios assume you're trading with the trend or looking for reversals at key levels.
Scenario 1: Bullish FVG as Support for Long Entry
Setup : You're trading a stock in an uptrend on a 15-minute chart. The FVG Range Filter displays a green box (bullish FVG) after a sharp upward move earlier in the day.
Interpretation : This green box indicates a zone of imbalance where price gapped up, likely due to strong buying interest. Since it's still within the display range and look-back period, it's a relevant support zone.
Action : Wait for price to retrace back to the top edge of the green box. Look for confirmation of support, such as a bullish candlestick pattern (e.g., hammer or engulfing) or increased volume, indicating buyers are stepping in.
Entry : Enter a long position near the top of the FVG box, setting a stop-loss just below the bottom of the box to protect against a breakdown.
Target : Aim for the next resistance level or a predefined risk-reward ratio (e.g., 1:2). If another bullish FVG forms above, consider that as a potential target.
Exit : Exit the trade if price breaks below the bottom of the FVG (invalidation), or if the box disappears due to price trading through the midpoint, signaling the gap is filled.
Scenario 2: Bearish FVG as Resistance for Short Entry
Setup : You're trading a cryptocurrency on a 1-hour chart during a downtrend. The indicator shows a red box (bearish FVG) after a sharp downward move a few hours ago.
Interpretation : The red box marks a zone where price gapped down, indicating strong selling pressure. As long as it's within the display range and look-back period, it remains a potential resistance zone.
Action : Wait for price to rally back to the bottom edge of the red box. Look for signs of rejection, such as a bearish candlestick pattern (e.g., shooting star or engulfing) or decreasing volume, suggesting sellers are defending this level.
Entry : Enter a short position near the bottom of the FVG box, placing a stop-loss just above the top of the box to guard against a breakout.
Target : Target the next support level or a favorable risk-reward ratio. If a new bearish FVG appears below, it could serve as a potential target.
Exit : Exit if price breaks above the top of the FVG (invalidation), or if the box disappears because price has traded through the midpoint, indicating the gap is no longer relevant.
Scenario 3: Filtering Out Irrelevant FVGs During Choppy Markets
Setup : You're trading forex on a 5-minute chart during a period of consolidation with no clear trend. The chart shows frequent small price jumps, but the FVG Range Filter displays very few boxes.
Interpretation : The indicator is filtering out FVGs that are either too far from the current price (outside the display range percentage) or too old (beyond the look-back bars). This helps avoid false signals in a non-trending market.
Action : Recognize that the absence of FVGs on the chart suggests no high-probability setups at the moment. Avoid forcing trades based on minor price movements that don't meet the filter criteria.
Entry : Wait for a clear trend to emerge and for new FVGs to appear within the filter parameters before considering any trades.
Target/Exit : Follow the trend direction once FVGs are displayed, using the edges of the boxes as potential entry or exit zones as described in the previous scenarios.
Scenario 4: Using FVGs for Risk Management
Setup : You're already in a long position on an index futures contract on a 30-minute chart, and the FVG Range Filter shows a green box below your entry point.
Interpretation : The green box represents a bullish FVG that could act as a support zone. Since price hasn't yet reached the midpoint (which would invalidate the FVG), it remains a valid reference point for managing risk.
Action : Adjust your stop-loss to just below the bottom of the green box. This placement uses the FVG as a logical invalidation level, assuming that a break below this support zone negates the bullish premise of your trade.
Entry : No new entry is needed since you're already in the trade.
Target/Exit : Keep your original target unless a new bearish FVG forms above, which might indicate resistance. Exit if price breaks below the FVG or if the box disappears due to invalidation.
Tips for Using the FVG Range Filter
Combine with Trend Analysis : FVGs are most effective when traded in the direction of the prevailing trend. Use higher timeframe analysis or other indicators to confirm the overall market direction before acting on FVGs.
Adjust Settings for Market Conditions : In volatile markets (like cryptocurrencies), you might increase the display range percentage to capture more FVGs. In less volatile markets (like certain stocks), a tighter range might be more appropriate.
Timeframe Selection : The indicator works on all timeframes, but lower timeframes (1-15 minutes) might show more frequent FVGs for scalping, while higher timeframes (1-4 hours) are better for swing trading with larger, more significant gaps.
Confirmation Tools : Don't rely solely on FVGs for entries. Use additional confirmation from price action (candlestick patterns), volume, or other indicators to increase the probability of success.
Monitor Invalidation : If an FVG box disappears from the chart due to price trading through its midpoint, consider it a signal that the gap is no longer relevant. Adjust your strategy accordingly.
Limitations
Not a Standalone System : The FVG Range Filter identifies potential zones of interest but does not provide entry signals, stop-loss, or take-profit levels on its own. It should be used as part of a broader trading strategy.
Market Conditions : FVGs may be less effective in strongly trending markets where price doesn't retrace to fill gaps, or in very choppy markets where too many small gaps are filtered out.
Lag in Detection : Since FVGs are based on a three-bar pattern, there is a slight delay in identifying them after the price movement has occurred.
Good Luck!
The FVG Range Filter is a powerful tool for traders looking to capitalize on price imbalances in the market. By focusing only on relevant Fair Value Gaps within a specified range and time frame, it helps declutter your chart and highlights high-probability zones for potential trades. Whether you're new to FVG trading or an experienced trader, this indicator can enhance your analysis by visually identifying key areas of support and resistance based on market inefficiencies.
Experiment with the settings to match your trading style and market conditions, and always combine the indicator's insights with other forms of analysis for the best results. Happy trading!

FVG Zones with Signals█ OVERVIEW
"FVG Zones with Signals" is a technical analysis tool that identifies Fair Value Gaps (FVG) on the chart and draws customizable zones in the form of boxes. It is ideal for traders using price action and market structure strategies, helping to identify potential imbalance zones and trading opportunities based on breakout and exit signals. With flexible size filter settings, box styles, and signal options, the indicator ensures clarity and precision on the chart.
█ CONCEPTS
The indicator is designed to identify potential entry points for trades based on FVG breakouts or retests. For chart clarity, a size filter for FVGs is included, based on a multiplier of the average candle size over a specified period.
Why are FVGs important? FVG zones represent areas of market imbalance, often attracting price back to "fill" the gap. Larger gaps (with a higher size multiplier) have a greater chance of being retested, as they indicate deeper imbalances—leaving more unexecuted orders in those zones, which attracts liquidity. Market makers and institutions often return to these levels to "refresh" liquidity before further moves. However, not every large FVG is retested quickly—in strong trends, smaller imbalances may be ignored, and the location (e.g., near swing highs/lows) is critical for retest probability.
█ FEATURES
- FVG Detection: Identifies bullish and bearish FVGs based on size filters (Candle Size Period and FVG Size Multiplier), with automatic initialization of historical gaps up to 500 candles back.
- Customizable Boxes: Draws FVG boxes with adjustable border colors, background gradients, border styles (solid, dashed, dotted), border widths, and transparency for both the background and the 50% FVG midline.
- Breakout and Exit Signals: Generates "Break" signals (green upward triangle for breakouts above bearish FVG, red downward triangle for breakouts below bullish FVG) and "Exit" signals (circles for exiting the zone), with options to select signal types (Break, Exit, or Both). A break signal causes the box to disappear, leaving a triangle as a trace of the breakout, which may serve as a signal to open a position. Exit signals (circles) may also indicate entry opportunities but require additional confirmation, such as alignment with the main trend.
- Midline: Automatically draws a dashed line at the 50% FVG level with adjustable transparency, aiding in assessing price reactions within the zone.
- Box Limitation: Automatically removes old or inactive FVGs after 500 candles to avoid chart clutter.
- Alerts: Built-in alerts for all signal types, including price and FVG type descriptions.
█ HOW TO USE
Add to Chart: Apply the indicator to your TradingView chart via the Pine Editor or Indicators menu.
Configure Settings:
- FVG Settings: Adjust Candle Size Period (default 20) and FVG Size Multiplier (default 1) to filter out small gaps—higher values generate fewer but more significant FVGs.
- Box Settings: Configure colors and styles for bullish (green) and bearish (red) boxes, including background transparency (default 80) and midline transparency.
- Signal Settings: Select signal types (Break, Exit, or Both) in Signal Type. Breakout signals appear after a candle closes outside the zone, while exit signals appear when exiting an FVG without a full breakout.
- Styling: Customize signal colors (green for buy/up, red for sell/down) and shape sizes.
Interpreting Signals:
- Break Up Signal: A green triangle below the bar indicates a breakout above a bearish FVG, suggesting potential continuation of an uptrend.
- Break Down Signal: A red triangle above the bar indicates a breakout below a bullish FVG, suggesting potential continuation of a downtrend.
- Exit Up/Down Signal: A green/red circle indicates an exit from an FVG without a full breakout, which may signal the end of a correction or preparation for a reversal.
- FVG Zones: If the price returns to an FVG and fills the gap, it may indicate equilibrium; an unfilled gap often leads to a retest.
- Use signals in conjunction with other technical analysis tools for confirmation, such as RSI (to identify overbought/oversold conditions) or MACD (to confirm momentum). Analyze FVGs from higher timeframes—these zones act as stronger imbalance levels and carry greater structural significance.
Exit signals (retests without breakouts) tend to be most effective when traded in line with the current trend.
█ APPLICATIONS
- Price Action Trading: Use FVG zones as dynamic support and resistance levels. In an uptrend, look for buying opportunities in bullish FVGs, where price often tests the gap before continuing. Combining with RSI, MACD, or Fibonacci levels enhances the significance of zones.
- Breakout Strategies: Trade based on breakout signals from FVGs. A buy signal after breaking a bearish FVG may indicate a strong upward impulse, especially when supported by a rising MACD or RSI exiting oversold conditions.
Larger FVG gaps (higher multiplier) have a greater chance of retest, as they indicate deeper imbalances.
█ NOTES
- Test the indicator across different timeframes and markets (stocks, forex, crypto) to optimize size filters for your trading style.
- The indicator initializes historical FVGs up to 500 candles back, which may slow loading on longer charts.
- For best results, use on high-liquidity markets where FVGs are more frequently retested.
- In consolidation zones, the indicator may generate more false signals, so additional confirmation is recommended.

FVG Reversal Sentinel🔵 FVG Reversal Sentinel – Multi-Timeframe Fair Value Gap Indicator
The FVG Reversal Sentinel is a powerful TradingView indicator designed to help traders identify and track Fair Value Gaps (FVGs) across multiple timeframes, all within a single chart.
This tool allows you to select up to five separate timeframes, ensuring you never miss key market shifts, whether you are scalping, day trading, or swing trading. You can use this indicator in any asset (Cryptos, Futures, Indices, Forex Pairs, etc.).
🔵 - Key Features -
Multi-Timeframe FVG Tracking – Select and display up to five different timeframes on one chart, providing a comprehensive view of market structure.
Customizable Colors – Adjust bullish and bearish FVG colors to match your chart theme for a seamless trading experience.
Enhanced Market Context – Quickly identify key liquidity zones and refine your entries and exits with precision.
Hide the lower timeframes FVGs to get a clear view in a custom timeframe.
Show or hide mitigated FVGs to declutter the chart.
FVGs boxes are going to be displayed only when the candle bar closes
FVGs are going to be mitigated only when the body of the candle closes above or below the FVG area.
No repainting
Whether you're looking to fine-tune your entries or gain a broader market perspective, the FVG Reversal Sentinel indicator ensures you have the tools to stay ahead of price action and capitalize on market inefficiencies.
🔵 - Customization-
You can change the indicator settings as you see fit to achieve the best results for your use case.
TIMEFRAMES
This indicator provides the ability to select up to 5 timeframes. These timeframes are based on the trader's timeframes including any custom timeframes.
Select the desired timeframe from the options list.
Add the label text you would like to show for the selected timeframe.
Check or uncheck the box to display or hide the timeframe from your chart.
FVG SETTINGS
Length of boxes: allows you to select the length of the box that is going to be displayed for the FVGs.
Delete boxes after fill?: allows you to show or hide mitigated FVGs on your chart.
Hide FVGs lower than enabled timeframes?: allows you to show or hide lower timeframe FVGs on your chart. Example - You are in a 15 minutes timeframe chart, if you choose to hide lower timeframe FVGs you will not be able to see 5 minutes FVG defined in your Timeframes Settings, only 15 minutes or higher timeframe FVGs will be displayed on your chart.
BOX VISUALS
Bullish FVG box color: the color and opacity of the box for the bullish FVGs.
Bearish FVG box color: the color and opacity of the box for the bearish FVGs.
LABELS VISUALS
Bullish FVG labels color: the color for bullish labels.
Bearish FVG labels color: the color for bearish labels.
Labels size: the size of the text displayed in the labels.
Labels position: the position of the label inside the FVGs boxes (right, left or center).
BORDER VISUALS
Border width: the width of the border (the thickness).
Bullish FVG border color: the color and the opacity of the bullish box border.
Bearish FVG border color: the color and the opacity of the bearish box border.
🔵 - How to use the indicator -
Just add the indicator in your chart and click in the settings option to customize it.
Make sure you select the desired timeframes and set the colors and opacity for the FVGs boxes.
This indicator can be used in many trading strategies, such as:
SILVER BULLET
iFVG
iFVG RETEST
These strategies are based on the use of FVGs, this tool can help you analyze the market and make the right decision.
🔵 - How was the indicator designed? -
I have spent a lot of time testing other open source indicators from the community. All of these indicators do a great job, but they have a problem, they not only mitigate FVGs when a candle closes above or below the FVG, they also mitigate FVGs when the candle closes exactly to the tick (not above or below the FVG). This is a problem for many strategies that rely on FVGs mitigation.
What makes this indicator different is that it focuses on just mitigating imbalances at the right time for these strategies.
I have taken ideas and some pieces of code from many community indicator developers, such as:
@twingall
@tflab
@marktools
@nacho-fx
@pmk07
... and many other people, to whom I thank for their valuable work and have allowed me to create this tool by making modifications to their source code.
🔵 - Disclaimer -
This tool is intended solely for informational and educational purposes and should not be regarded as financial, investment, or trading advice. It's not designed to predict market movements or offer specific recommendations. Users should be aware that past performance is not indicative of future results and should not rely on any indicator for financial decisions.

FVG Radar [Mr_Rakun]The FVG Radar indicator is designed to automatically detect Fair Value Gaps (FVG) on your TradingView chart. It visually highlights bullish and bearish gaps with colored boxes and provides alerts when specific conditions are met.
How It Works
Fair Value Gap (FVG) Detection:
The script identifies gaps based on previous price action. A bullish FVG is recognized when there is a gap below a higher low candle, and a bearish FVG when there is a gap above a lower high candle.
Radar Area:
A yellow “Radar Area” box is drawn on the chart using upper and lower bands defined as a percentage above and below the current price. This area helps you visualize where the price is relative to these bands.
Alerts:
Alerts are triggered based on user-defined conditions:
When price crosses half of the gap (if the "Clear FVG When Price Reaches Half" option is enabled).
When price fully fills the gap (if the option is disabled).
The alert will only be activated after waiting a specified number of bars post-gap formation (as set by the "Wait X Bars After FVG Formation" parameter).
Input Parameters
Radar Upper Band (%):
Sets the upper threshold percentage relative to the current price for the radar area.
Radar Lower Band (%):
Sets the lower threshold percentage relative to the current price for the radar area.
Minimum FVG Size (%):
Determines the minimum size (as a percentage) for a gap to be recognized as a valid FVG.
Clear FVG When Price Reaches Half:
If enabled, the FVG will be cleared when the price reaches the midpoint of the gap. If disabled, the entire gap must be filled before it is cleared.
Wait X Bars After FVG Formation:
Specifies the number of bars to wait after an FVG is detected before triggering an alert. This delay helps to avoid premature alerts.
Bullish and Bearish FVG Colors and Opacity:
Customize the appearance of the FVG boxes for bullish (green) and bearish (red) gaps, including the opacity of these visual elements.
How to Use
Add the Indicator:
Load the FVG Radar indicator on your TradingView chart.
Customize Settings:
Adjust the input parameters based on your trading style and the market’s volatility. The radar area settings help you set your own visual reference for price deviations.
Monitor the Chart:
Watch for the colored boxes that represent FVGs. The boxes will display the size of the gap as a percentage.
Respond to Alerts:
When an alert is triggered after the specified number of bars, it indicates that the price has interacted with the gap. Use this information to guide your trading decisions.
Türkçe --------------------------------------------
FVG Radar göstergesi, TradingView grafiğinizde Fair Value Gap (FVG) – yani adil değer boşluklarını – otomatik olarak tespit etmek için tasarlanmıştır. Bu boşluklar, yükseliş ve düşüş boşluklarını farklı renkli kutularla vurgular ve belirli koşullar sağlandığında uyarılar verir.
Nasıl Çalışır
Fair Value Gap (FVG) Tespiti:
Gösterge, önceki fiyat hareketlerine dayalı olarak boşlukları belirler. Yükseliş boşluğu, düşük seviyenin yukarıdaki mumun altındaki boşlukla oluştuğu durumlarda; düşüş boşluğu ise, yüksek seviyenin aşağıdaki mumun üstünde boşluk oluştuğunda tespit edilir.
Radar Alanı:
Grafikte, mevcut fiyata göre belirlenen üst ve alt yüzde bantlarına dayalı olarak sarı renkte “Radar Alanı” kutusu çizilir. Bu alan, fiyatın bu bantlara göre nerede olduğunu görsel olarak anlamanıza yardımcı olur.
Uyarılar:
Kullanıcının belirlediği koşullara göre uyarılar verilir:
Fiyat, boşluğun yarısına ulaştığında (eğer "FVG'nin yarısına ulaştığında temizle" seçeneği etkinse).
Fiyat boşluğu tamamen doldurduğunda (seçenek devre dışı bırakıldığında).
Uyarı, boşluk oluşumundan sonra belirlenen bar sayısı kadar bekledikten sonra tetiklenir ("FVG Oluşumundan Sonra X Bar Bekle" parametresi).
Giriş Parametreleri
Radar Upper Band (%):
Mevcut fiyata göre radar alanı için üst eşik yüzdesini ayarlar.
Radar Lower Band (%):
Mevcut fiyata göre radar alanı için alt eşik yüzdesini ayarlar.
Minimum FVG Size (%):
Bir boşluğun geçerli bir FVG olarak tanınabilmesi için gereken minimum boyutu (yüzde olarak) belirler.
FVG'nin yarısına ulaştığında temizle:
Etkinse, fiyat boşluğun orta noktasına ulaştığında boşluk temizlenir. Devre dışı bırakılırsa, boşluğun tamamen doldurulması gerekir.
FVG Oluşumundan Sonra X Bar Bekle:
Bir FVG tespit edildikten sonra uyarı tetiklenmeden önce beklenmesi gereken bar sayısını belirler. Bu gecikme, erken uyarıların önüne geçmeyi amaçlar.
Yükseliş ve Düşüş FVG Renkleri ve Opaklık:
Yükseliş boşlukları (yeşil) ve düşüş boşlukları (kırmızı) için kutuların görünümünü ve opaklığını özelleştirmenize olanak tanır.
Nasıl Kullanılır
Göstergeyi Ekleyin:
FVG Radar göstergesini TradingView grafiğinize ekleyin.
Ayarları Özelleştirin:
Ticaret tarzınıza ve piyasanın oynaklığına göre giriş parametrelerini ayarlayın. Radar alanı ayarları, fiyat sapmalarını kendi görsel referansınızla tanımlamanıza yardımcı olur.
Grafiği İzleyin:
FVG’leri temsil eden renkli kutuları takip edin. Kutular, boşluğun yüzdelik büyüklüğünü gösterecektir.
Uyarılara Tepki Verin:
Belirlenen bar sayısı sonrasında tetiklenen uyarı, fiyatın boşluk ile etkileşime girdiğini gösterir. Bu bilgiyi, ticaret kararlarınızı yönlendirmek için kullanın.
