ICT Directional FVG Indicator (Buffered SL)This is the first indicator I have ever made, and I am very new to Pine Script. I’ve tried my best to create this as a strategy, but I’m still learning, so please be kind and constructive with your feedback!
ICT Directional FVG Indicator (Buffered SL)
This indicator is designed for traders who follow ICT (Inner Circle Trader) concepts, focusing on Fair Value Gaps (FVGs), liquidity sweeps, and session-based trading. It automatically detects bullish and bearish FVGs, highlights them on the chart, and identifies liquidity sweep events. The indicator features three customizable Kill Zones (London, New York, and Asia sessions), each with independent toggles and color-coded backgrounds for clear visual separation.
Key features:
Fair Value Gap Detection: Highlights bullish and bearish FVGs in real time.
Liquidity Sweep Alerts: Marks potential liquidity sweep events for both highs and lows.
Session Kill Zones: Toggle each Kill Zone (London, New York, Asia) independently; background color changes only in enabled zones.
Trade Signal Visualization: Plots entry, stop loss, and take profit levels based on FVG and sweep logic, with a user-defined stop loss buffer.
Customizable Display: Easily enable or disable FVGs, sweeps, trade levels, and each Kill Zone to suit your strategy.
This tool is ideal for ICT-based traders who want a clear, automated view of FVGs, sweeps, and session activity, with full control over which sessions and signals are displayed.
Cerca negli script per "fvg"

(ICT)Liquidity Grab + FVG + MSS/BOSThis script is a comprehensive educational indicator that combines and enhances several well-known trading concepts:
Liquidity Grabs (Swing Failure Patterns)
Fair Value Gaps (FVG)
Market Structure Shifts / Break of Structure (MSS/BOS)
Alerts
It identifies potential bullish and bearish liquidity grabs, confirms them optionally using volume validation on a lower timeframe, and tracks subsequent price structure changes. The indicator visually marks key swing highs/lows, FVG zones, and BOS/MSS levels—allowing traders to observe how price reacts to liquidity and imbalance zones.
🔍 Features:
Swing Failure Patterns (SFP):
Highlights possible liquidity grabs based on recent highs/lows and candle structure.
Volume Validation (Optional):
Filter signals using relative volume outside the swing on a lower timeframe. Adjustable threshold.
Fair Value Gaps (FVG):
Detects imbalance gaps and extends them for easy visualization.
Market Structure (MSS/BOS):
Displays Break of Structure (BOS) and Market Structure Shift (MSS) based on pivot highs/lows and closing conditions.
Dashboard:
A compact info panel displaying lower timeframe settings and validation status.
Custom Styling:
Adjustable colors, line styles, and label visibility for clean charting.
🧠 Ideal For:
Traders studying ICT concepts, smart money theories, and price-action-based strategies who want a visual tool for analysis and backtesting.
How to Use:
Wait for a Liquidity Grab (SFP) to form
The first condition for a potential entry is the formation of a Stop Hunt / Swing Failure Pattern (SFP).
This indicates that liquidity has been taken above or below a key level (e.g., previous high/low), and the market may be ready to reverse.
Confirmation with Fair Value Gap (FVG) and Market Structure Shift (MSS)
After the SFP, do not enter immediately. Wait for confirmation:
FVG : A Fair Value Gap (an imbalance in price action) must appear, signaling potential institutional activity.
MSS : A Market Structure Shift (break in the current trend) confirms a possible trend reversal or strong corrective move.
Enter the trade
Once both the FVG and MSS are confirmed after the SFP, you can safely enter a trade in the direction of the shift.
Alert Feature
The indicator includes an alert system to notify you when all conditions are met (SFP + FVG + MSS), so you can react quickly without constantly watching the chart.
Higher Timeframe Candles (Dynamic Display)Key Features:
1. Higher Timeframe Candles Visualization:
Displays up to 5 candles from a user-selected higher timeframe (e.g., 15-minute, hourly).
Each candle includes:
Body (open-close range) and wicks (high-low range).
Customizable appearance settings for width, colors, and transparency.
2. Horizontal Price Levels:
Calculates and plots important levels based on the higher timeframe candles:
Max High: Highest price among the displayed candles.
Min Low: Lowest price among the displayed candles.
Midpoint: The midpoint between Max High and Min Low.
Quarter Points: 25% and 75% levels within the Max-Min range.
Each level's line appearance (color, width, style) can be customized, and price labels can be displayed.
3. Fair Value Gaps (FVG):
Detects bullish and bearish fair value gaps (FVGs) based on three consecutive candles:
Bullish FVG: Middle candle's low is higher than the previous candle's high.
Bearish FVG: Middle candle's high is lower than the previous candle's low.
Highlights FVGs with colored boxes and optional labels showing gap height.
4. Inside/Outside Bar Detection:
Identifies inside bars (current candle is entirely within the previous candle) and outside bars (current candle exceeds the previous candle's range).
Labels these patterns above the candles for easy identification.
5. Alerts for Key Levels:
Alerts are triggered when the current price crosses:
Max High
Min Low
Midpoint
Alerts help traders act without monitoring the chart constantly.
6. Customization Options:
Fully customizable input options for candles, levels, FVGs, and labels:
Appearance settings: Colors, widths, styles, transparency.
Toggle visibility for specific features (e.g., FVGs, labels, quarter points).
Label precision and positioning.

2:30 [LuciTech]this is a technical analysis tool designed to highlight key price levels and patterns during a specific trading window, based on UK time (Europe/London). It overlays visual elements on the chart, including a 12 PM reference line, Buy Side Liquidity (BSL) and Sell Side Liquidity (SSL) levels, a highlighted 2:30 PM candle, and Engulfing Fair Value Gaps (FVGs). This indicator is intended for traders who focus on intraday price action and liquidity zones.
Features
The 12 PM Line displays a vertical line at 12:00 PM (UK time) to mark the start of the session. It’s customizable, allowing you to enable or disable it and adjust its color.
BSL/SSL Lines track the highest high (BSL) and lowest low (SSL) from 12:00 PM to 2:00 PM (UK time). These lines extend horizontally until 3:30 PM, after which they remain static at their last recorded levels. You can customize them by enabling or disabling visibility, adjusting colors, choosing a line style (solid, dashed, or dotted), and setting the width.
The 2:30 PM Candle highlights the candle at 2:30 PM (UK time) with a distinct color. It’s customizable, with options to enable or disable it and change its color.
Engulfing FVG (Fair Value Gap) identifies bullish and bearish engulfing patterns with a gap from the prior candle’s range. It draws a shaded box over the FVG area, and you can customize it by enabling or disabling it and adjusting the box color.
How It Works
The indicator operates within a session starting at 12:00 PM (UK time). BSL/SSL levels update between 12:00 PM and 2:00 PM, with lines extending until 3:30 PM. After 3:30 PM, these lines freeze.
BSL/SSL lines show the highest price (BSL) and lowest price (SSL) reached during the 12:00 PM to 2:00 PM window. After 3:30 PM, they remain static, marking the final range boundaries.
The 2:30 PM candle emphasizes a key timestamp, often of interest to intraday traders.
Engulfing FVGs detect significant price gaps created by engulfing candles, which may indicate potential reversal or continuation zones.
Settings
12 PM Line Settings let you toggle visibility and set the line color.
BSL/SSL Line Settings allow you to toggle visibility, set BSL and SSL colors, choose a line style (Solid, Dashed, Dotted), and adjust width (1-4).
2:30 Candle Settings let you toggle visibility and set the candle color.
Engulfing FVG Settings allow you to toggle visibility and set the box color.
Interpretation
The 12 PM Line serves as a reference for the session start.
BSL/SSL Lines may act as potential support or resistance zones or highlight liquidity areas. After 3:30 PM, they remain static, showing the session’s final range.
The 2:30 PM Candle can be monitored for price action signals, such as reversals or breakouts.
Engulfing FVGs shaded areas may indicate imbalances in supply and demand, useful for identifying trade opportunities or stop-loss placement.
Notes
The timezone is set to Europe/London (UK time). Ensure your chart’s timezone aligns for accurate results.
This indicator is best used on intraday timeframes, such as 1-minute or 5-minute charts.
It provides visual aids for analysis and does not generate buy or sell signals on its own.

ICT Balanced Price Range - Double FVG with VolumeThis is an FVG indicator combined with volume to identify moments when a sudden volume spike creates a price gap.
Additionally, I've added the ICT Balanced Price Range, which occurs when two opposing FVGs form a connected gap. This gap has a high probability of reversal and is one of the key signs of liquidity sweeps.
Unlike other FVG indicators that filter FVGs based on ATR, average price, or range, I believe such methods lead to overfitting and may not work across multiple pairs with a single setting. Instead, I only filter FVGs when there are consecutive overlapping FVGs.
The indicator includes full functionality:
Candle color customization
FVG line color customization
FVG fill color customization
BPR color customization
Adjustable average volume and volume threshold
Highlighting candles with abnormal volume
Enjoy and make sure to backtest thoroughly before using!

ICT Judas Swing | Flux Charts💎 GENERAL OVERVIEW
Introducing our new ICT Judas Swing Indicator! This indicator is built around the ICT's "Judas Swing" strategy. The strategy looks for a liquidity grab around NY 9:30 session and a Fair Value Gap for entry confirmation. For more information about the process, check the "HOW DOES IT WORK" section.
Features of the new ICT Judas Swing :
Implementation of ICT's Judas Swing Strategy
2 Different TP / SL Methods
Customizable Execution Settings
Customizable Backtesting Dashboard
Alerts for Buy, Sell, TP & SL Signals
📌 HOW DOES IT WORK ?
The strategy begins by identifying the New York session from 9:30 to 9:45 and marking recent liquidity zones. These liquidity zones are determined by locating high and low pivot points: buyside liquidity zones are identified using high pivots that haven't been invalidated, while sellside liquidity zones are found using low pivots. A break of either buyside or sellside liquidity must occur during the 9:30-9:45 session, which is interpreted as a liquidity grab by smart money. The strategy assumes that after this liquidity grab, the price will reverse and move in the opposite direction. For entry confirmation, a fair value gap (FVG) in the opposite direction of the liquidity grab is required. A buyside liquidity grab calls for a bearish FVG, while a sellside grab requires a bullish FVG. Based on the type of FVG—bullish for buys and bearish for sells—the indicator will then generate a Buy or Sell signal.
After the Buy or Sell signal, the indicator immediately draws the take-profit (TP) and stop-loss (SL) targets. The indicator has three different TP & SL modes, explained in the "Settings" section of this write-up.
You can set up alerts for entry and TP & SL signals, and also check the current performance of the indicator and adjust the settings accordingly to the current ticker using the backtesting dashboard.
🚩 UNIQUENESS
This indicator is an all-in-one suit for the ICT's Judas Swing concept. It's capable of plotting the strategy, giving signals, a backtesting dashboard and alerts feature. Different and customizable algorithm modes will help the trader fine-tune the indicator for the asset they are currently trading. Three different TP / SL modes are available to suit your needs. The backtesting dashboard allows you to see how your settings perform in the current ticker. You can also set up alerts to get informed when the strategy is executable for different tickers.
⚙️ SETTINGS
1. General Configuration
Swing Length -> The swing length for pivot detection. Higher settings will result in
FVG Detection Sensitivity -> You may select between Low, Normal, High or Extreme FVG detection sensitivity. This will essentially determine the size of the spotted FVGs, with lower sensitivies resulting in spotting bigger FVGs, and higher sensitivies resulting in spotting all sizes of FVGs.
2. TP / SL
TP / SL Method ->
a) Dynamic: The TP / SL zones will be auto-determined by the algorithm based on the Average True Range (ATR) of the current ticker.
b) Fixed : You can adjust the exact TP / SL ratios from the settings below.
Dynamic Risk -> The risk you're willing to take if "Dynamic" TP / SL Method is selected. Higher risk usually means a better winrate at the cost of losing more if the strategy fails. This setting is has a crucial effect on the performance of the indicator, as different tickers may have different volatility so the indicator may have increased performance when this setting is correctly adjusted.

Gaps Trend [ChartPrime]The Gaps Trend - ChartPrime indicator is designed to detect Fair Value Gaps (FVGs) in the market and apply a trailing stop mechanism based on those gaps. It identifies both bullish and bearish gaps and provides traders with a way to manage trades dynamically as gaps appear. The indicator visually highlights gaps and uses the detected momentum to assess trend direction, helping traders identify price imbalances caused by strong buy or sell pressure.
⯁ KEY FEATURES & HOW TO USE
⯌ Fair Value Gap (FVG) Detection :
The indicator automatically detects both bullish and bearish FVGs, identifying gaps between candle highs and lows. Bullish gaps are shown in green, and bearish gaps in purple. These gaps indicate price imbalances driven by strong momentum, such as when there is significant buying or selling pressure.
Use : Traders can use FVG detection to identify periods of high price momentum, offering insight into potential continuation or exhaustion of trends.
⯌ Trailing Stop Feature Based on FVGs :
A core feature of this indicator is the trailing stop mechanism, which adjusts dynamically based on the identified FVGs. When a bullish gap is detected, the trailing stop is placed below the price to capture upward momentum, while bearish gaps result in a trailing stop placed above the price. This feature helps traders stay in trends while protecting profits as the price moves.
Use : The trailing stop follows the momentum of the price, ensuring that traders can stay in profitable trades during strong trends and exit when the momentum shifts.
bullish set up
bearish set up
⯌ Trend Direction Indication :
The indicator colors the chart according to the current trend direction based on the position of the price relative to the trailing stop. Green indicates an uptrend (bullish gap), while purple shows a downtrend (bearish gap). This provides traders with a quick visual assessment of trend direction based on the presence of gaps.
Use : Traders can monitor the chart's color to stay aligned with the market’s trend, staying long during green phases and short during purple ones.
⯌ Gap Size Filtering :
Each detected gap is assigned a numerical ranking based on its size, with larger gaps having higher rankings. The gap size filter allows traders to only display gaps that meet a minimum size threshold, focusing on the most impactful gaps in terms of price movement.
Use : Traders can use the filter to focus on gaps of a certain size, filtering out smaller, less significant gaps. The numerical ranking helps identify the largest and most influential gaps for decision-making.
⯌ FVG Level Visualization :
The indicator can display dashed lines marking the levels of previously filled FVGs. These levels represent areas where price once experienced a gap and later filled it. Monitoring these levels can provide traders with key reference points for potential reactions in price.
Use : Traders can use these gap levels to track where price has filled gaps and potentially use these levels as zones for entry, exit, or assessing market behavior.
⯁ USER INPUTS
Filter Gaps : Adjust the size threshold to filter gaps by their size ranking.
Show Gap Levels : Toggle the display of dashed lines at filled FVG levels.
Enable Trailing Stop : Activate or deactivate the trailing stop feature based on FVGs.
Trailing Stop Length : Set the number of bars used to calculate the trailing stop.
Bullish/Bearish Colors : Customize the colors representing bullish and bearish gaps.
⯁ CONCLUSION
The Gaps Trend indicator combines Fair Value Gap detection with a dynamic trailing stop feature to help traders manage trades during periods of high price momentum. By detecting gaps caused by strong buy or sell pressure and applying adaptive stops, the indicator provides a powerful tool for riding trends and managing risk. The additional ability to filter gaps by size and visualize previously filled gaps enhances its utility for both trend-following and risk management strategies.

Precise Gap FinderPrecise Gap Finder
This indicator identifies Fair Value Gaps (FVGs) in price action and it is perfect for traders looking to exploit price imbalances and capitalize on trading opportunities.
How It Works:
The Precise Gap Finder detects Fair Value Gaps by analyzing three consecutive candles. A gap is identified when the middle candle’s price range (open to close) is not overlapped by the high and low prices of the surrounding candles. This indicates a price imbalance, which can be a strong signal for potential market moves.
How to Use for Trading:
Identify Entry Points: Use the highlighted Fair Value Gaps to spot potential entry points. An upward FVG can indicate a potential buying opportunity, while a downward FVG can signal a potential selling opportunity.
Confirm Trends: Combine the FVG signals with other technical indicators to confirm trends and enhance the accuracy of your trades.
Risk Management: Use FVGs to identify potential stop-loss and take-profit levels. Gaps can serve as natural support and resistance levels.
Backtesting: Analyze historical data to understand how FVGs have impacted price movements in the past, helping you refine your trading strategy

Session Sweeps [LuxAlgo]The Session Sweeps indicator combines ICT-based features for a complete trading methodology involving market sessions, market structure, and fair value gaps to find optimal entry conditions for trading price action.
Traders frequently tend to place stop/limit orders at the high and low points of major trading sessions such as Asian (Tokyo), European (London), and North American (New York), resulting in the establishment of liquidity pools at those particular levels. The Session Sweeps indicator is crafted to recognize and underscore occurrences of session sweeps or liquidity sweeps during these major trading sessions.
🔶 USAGE
Default settings utilize major forex trading sessions, yet users can select their preferred opening and closing times, rename the sessions, or adjust the colors. It's important to note that the specified times for each session align with the respective local timezones: Asian (Tokyo) UTC+9, European (London) UTC, and North American (New York) UTC-5.
If the price briefly crosses either the highest or lowest point of a market session. These movements, aiming at triggering stop losses, suggest potential shifts in the market direction. Detecting such movements is the fundamental purpose and core functionality of the script.
🔹Market Structure Shifts
A Market Structure Shift refers to a change in market direction, either from an uptrend to a downtrend or vice versa. A part of a common entry model when using session sweeps is waiting for the formation of a CHoCH after a session sweep.
🔹Fair Value Gaps
A Fair Value Gap (FVG) holds particular appeal for price action traders, emerging when there are inefficiencies or imbalances in the market, often a result of uneven buying and selling activity. The underlying concept of FVGs is that the market tends to revisit these inefficiencies before resuming its trajectory in alignment with the initial impulsive move.
After the formation of a CHoCH traders can enter a position when the price enters the area of a Fair Value Gap (FVG).
🔹Setup Examples
This entry setup is commonly used by ICT traders and is shared for informational & educational purposes only.
Long Positions (5-Minute Timeframe):
Wait for the previous session's low to be swept.
Look for a Bullish Choch.
Find a Bullish FVG formed by or before the Choch.
Entry Point: At the FVG.
Take Profit (TP): At the session high or aim for a 1:2 Risk-Reward Ratio.
Stop Loss (SL): At the session low or nearest Swing Low.
Take partial profits at intermediate swings, but don’t shift SL prematurely.
Short Positions (5-Minute Timeframe):
Wait for the previous session's high to be swept.
Look for a Bearish Choch.
Find a FVG formed by or before the Choch.
Entry Point: At the FVG.
Take Profit (TP): At the previous session's low or aim for a 1:2 RR.
Stop Loss (SL): At the session high or nearest Swing High.
Take partial profits at intermediate swings, but don’t shift SL prematurely.
🔶 SETTINGS
🔹Session Sweeps
Buyside Sweep Zones, Color, and Margin: toggles the visibility of bullside sweep zones, customizes the associated color, and sets the margin value defining the range of a bullside sweep zone.
Sellside Sweep Zones, Color, and Margin: toggles the visibility of sell-side sweep zones, customizes the associated color, and sets the margin value defining the range of a sell-side sweep zone.
Sweep Margin Length: specifies the maximum allowed length of a sweep zone invalidation, the length over which the price slightly invalidated the margin range.
Detect Sweeps Once per Session: if enabled will detect only once a sweep zone within a session.
Hide Fake Sweep Zones, and Color: controls the visibility and color of the fake sweep zones.
🔹Sessions
Session (Asia, London, New York AM, and New York PM), Start Time, and End Time: enables or disables the visibility of the named market session range, and customization of the session hours.
Color: color customization option of the named session.
Extend Max/Min: extends the highest and lowest price levels of the named session until the end of the next enabled session. This option is recommended to be enabled when sweep zone detection is activated to observe the relationship between the sweep zone and previous session extreme levels.
Extend Mid: extends the mean price levels of the named session until the end of the next enabled session. The extended line may serve as potential support and resistance levels.
Fill: enables/disables background coloring of the named session.
New York DST | London DST: enabling this option initiates Daylight Saving Time (DST) for New York or London. Note: Daylight Saving Time is not applied to the Asian (Tokyo) session.
Sessions Extreme Lines | Sessions Names: toggles the visibility of the highest and lowest price levels, as well as the names, for all market sessions.
Session Lines Width: sets the width of the lines for all sessions.
Session Fill Transparency: sets the background color transparency of the range for all sessions.
🔹Market Structure Shifts
Market Structure Shifts: toggles the visibility of market structure shifts, also known as change of character (CHoCH).
Detection Length: specifies the detection length.
Market Structure Shifts; Bull & Bear: color customization options.
🔹Fair Value Gaps
Fair Value Gaps: toggles the visibility of the fair value gaps.
Fair Value Gap Width Filter: specifies the filtering multiplier; additional details can be found in the tooltip of the respective input option.
Bullish & Bearish Imbalance: color customization options.
🔹Sessions Tabular View
Sessions Tabular View: toggles the visibility of the tabular view of the sessions, displaying date &time, status, and countdown counter.
Hide if not Forex Market Instrument: checks the market and automatically enables/disables the option based on the market instrument.
Table Text Size & Position: size and placement customization options
🔶 LIMITATIONS
Please be aware that fair value gap filtering cannot be applied to the initial 144 candles (with a fixed-length ATR) as the ATR value necessary for filtering won't be available during this period.
🔶 RELATED SCRIPTS
Buyside-Sellside-Liquidity
Sessions
Liquidity-Voids-FVG
Thank you to our community for the recommendation of this script. To explore additional conceptual scripts and related content, we invite you to visit >>> LuxAlgo-Scripts .

ICT Session Opening FVG / Silver Bullet [MK]Students of ICT concepts will know that the first FVG found within particular session periods can identify an important price level for intraday traders.
"Find the first FVG at the start of the session and drag a box from it to the right"....ICT
The script finds the first FVG (either bull or bear) within the following periods:
London Killzone (0200 - 0500) EST
02:00 - 0259
03:00 - 0359
0400 - 0459
Dead Zone (05-00 - 0600) EST
05-00 - 0559
0600 - 0659
NY AM Killzone (0700 - 1100) EST
0700 - 0759
0830 - 0929
0929 - 0959
1000 - 1100 (Silver Bullet)
A chart higher timeframe can be chosen to detect the FVGs and they will be displayed on lower timeframe. Default is 5min for detection. I like to then following price reacting to 5mi FVGs on a 1 min chart.
FVG boxes can be extended to the end of the session, or to any time within the current days trading hours. Colors/Labels/ Session Periods can all be edited. A maximum timeframe for display is available and
timezone can be adjusted.
FVGs are only shown for the current days trading hours.

ICT 2022 Mentorship Model [TFO]An attempt at programming the logic from the Inner Circle Trader (ICT) 2022 Mentorship Model. It's not perfect by any means, and NOT intended as a substitute for learning the model itself. I just wanted to share what I’ve been able to make thus far. PLEASE read this description thoroughly before reaching out with questions.
How it works, as of the initial release (bullish example):
When major Sell Side Liquidity (SSL) is taken, this script will start looking for displacement through a recent swing high, marking a potential Market Structure Shift (MSS)
From the bar that created the MSS, displacement is deemed valid if the range of that bar is greater than the standard deviation of recent price history, multiplied by the “Displacement Strength” parameter. Valid displacement also requires that a Fair Value Gap (FVG) was created
Once the above conditions are met, the script will assume we are now seeking Buy Side Liquidity (BSL), and will continue to look for long entries in an FVG after subsequent displacement through swing highs. *This script will keep looking for long entries until price takes out BSL*
Similarly, if price took out BSL and displaced through a swing low, the script will only look for short entries in an FVG until an SSL pivot is reached (alerts can be configured to show these potential entries)
Settings:
Show Structure Breaks: show breaks of structure on the current timeframe
Show Liquidity Taken: show when major liquidity has been traded through
Show Liquidity Pivots: show all pivots that are being considered as liquidity
Structure Pivot Strength: determines how strong a local high/low must be for structural pivots on the current timeframe
Liquidity Multiplier: this number, multiplied by Structure Pivot Strength, will determine the pivot strength used to find valid liquidity, which should always be greater than the Structure Pivot Strength
BOS Type: “Close” will only count structure breaks when price closes through a prior pivot, whereas “Wick” will include structure breaks even if price only wicks through the prior pivot
Show Displacement: show bar coloring for valid displacement through a swing high/low
Show Displacement FVG: show FVGs that results from valid displacement
Displacement Type: use “Open to Close” to look for displacement using only the body of a candle, or “High to Low” to use the candle’s entire price range
Displacement Strength: higher values will look for more significant displacement candles, and vice versa
Max Bars to Extend FVG: if an FVG has not been overwritten or invalidated, it will extend to the right for a maximum of this many bars
I recommend lowering the values for Structure Pivot Strength and Liquidity Multiplier for larger chart timeframes, and increasing the values for smaller timeframes. I prefer keeping the displacement strength to >= 3, which would be 3 times the standard deviation of recent price history.

Smart Money Concepts(v0.01) - SoldiSmart Money Concepts
We are very pleased to be releasing our latest addition to the Soldi tools, called Smart Money Concepts. What this indicator was built to be is a guideline and tool to help a trader develop the mental mind state of a Smart Money Trader. Picking up on the digital footprints that they might have missed! This is our first iteration of this tool but we have so so much more coming to bring to this tool! So much that we might need to release 2 scripts to be able to efficiently fit it all in. As always Soldi/MMCFX always try to raise the bar on what is possible with PineScript and what advanced concepts we can bring to the retail market with ease, this project was insanely fun trying to get together and we spent a lot of months talking with and doing sessions with very well versed traders who only specialize and solely trade live with Smart Money/ICT Concepts. After many months of talking with and working with these traders we believe we have put together a very unique tool that any SMC trader would love to have in their tool belt.
What is Smart Money Concepts?
Smart Money Concepts (SMC) is the practice of trying to track the digital footprints left by Market Makers and large money traders like Institutional bodies and brokers. I believe this concept was originally developed by Inner Circle Trading (ICT), who has some great great content for free on YouTube. To my knowledge he was the father of the concepts being taken mainstream to retail individuals. Since then, there has been many other who have released content on these theories. For the sake of congruency we have only developed these tools based off the knowledge and practices taught by ICT.
What is Included within this tool?
What is currently Included with this tool are the following.
Market Structure - This includes Break of Structures (BOS) and Change of Characters (CHoCH), It was really important for us to define the different shifts that SMC traders track and follow so we built a unique customizable system that allows the traders to track these Market Structure shifts in real-time. Part of this module includes the option to plot the High/Low labels, by putting this settings on you will mark out the swing points as their respective Higher High(HH), High Low(HL), Lower Low(LL) and Lower High(LH) . This feature is a great way to help familiarize yourself with spotting these instances, there is a slight lag due to the nature of the calculations for tracking the Swing Points. By default we track 4 left bars and 4 right bars, on the 5th bar if the swing point returns true you will see the label plot itself. If you have a higher bar count you will need to wait till x+1 to see the label be plotted. eg. 7 bar count on the left and right, you will need to wait till the 8th bar to see the label be plotted.
By changing the bar counts you also change how the Market Structure module picks up the Market shifts (BOS/CHoCH)
4 bar left, 4 bar right example:
7 bar left, 7 bar right example:
Liquidity Sweep - This part of the Market Structure module is still being worked on and built out, this feature is meant to help a trader identify potential liquidity sweeps that have taken place past or present by switching the bar color to the user defined color (default yellow). There are many different types of liquidity sweeps that can take place and we are still working on the different profiles of these! More profiles will be added to the the updates in the future to help identify these potential trade areas
Liquidity Sweep example:
Trend Bars - This part of the Market Structure module helps traders identify structure trends based on the breaks of existing structure. Again this will shift as you play with the bar count settings, low bar count will identify faster swing points and shifts where as higher bar counts will identify longer term structures. By having this setting on it will change the bar colors to Red(Bearish) or Blue(Bullish) by default, we recommend to change your candles border settings to make this more visible.
7 bar left, 7 bar right. With High Low Labels and Trend Bars
Fair Value Gaps - This module will track the Fair Value Gaps and Imbalances that will take place in real-time. Once the final candle closes it will plot the FVG. Unlike other FVG indicators on TradingView we hold and store ALL the FVG's that take place, other indicators will only hold on to x amount of the FVG's and as new ones enter the list the old ones get bumped out. We didn't like this idea, so what we did was instead store all of the FVG's but create a threshold to where they would be plotted, eg. if you set the threshold to 4% it will only show you the FVG's within a 4% range from the current price. This way you still have access to all the data with out compromising but it helps you focus on the current data at hand.
Fair Value Gap/Imbalance - 3% threshold example
Fair Value Gap/Imbalance - 8% threshold example
Order Blocks - This was an especially interesting module to build, just like the FVG's we found that a lot if not all the authors on TradingView haven't actually been coming close to tracking and plotting true ICT style Order blocks. We set out to change that though, again through a unique approach we have built this Order Block indicator. To also comment on the other scripts out there that claim to track Order Blocks, not a SINGLE script mentions anything about Validated Order Blocks , which was especially important to all the SMC traders I have talked to and had help from building this indicator. Just like the FVG piece this also has a 'threshold' plot, but not only that it gives you the option to look at "No Validation" and "Validated" Order Blocks. With soon another style of Validation to choose from. If you choose the "Validated" option the script will actively seek Order Blocks that have a POI/liquidity sitting above it. I also want to make it clear that based on your bar count settings the order blocks will differ, as they are also based from structure breaks!
Order Blocks with "No Validation" example
Order Blocks with "Validation" example
Advanced Session Tracking - We always seek to out do what has been done and what we have already done, that being said we built our Advanced Session Tracking module to follow each user define Session's Open, High, Low, Close, Liquidity threshold and extend that into the next session . As per our last KillZone indicator we also included the Forward Plotting feature which will plot the defined sessions 24 hours in advance vs only showing you real time. Many if not all Session tracking tools on TradingView only show you real-time and in the past when the define sessions are but we find that to be a very silly practice because as SMC traders you know how important it is the relation between time and price. Instead of reacting to the sessions you and prepare for the sessions ahead of time anticipating when price might react to time.
note: There is a small bug with tracking the crypto based sessions, this is working to be fixed for the next update, check the release notes to see when the fix occurs
Session Background plots with forward plotting example
Session Backgrounds with High/Lows and Liquidity range example
What is to come with the updates?
We are always looking to improve anything, even if it is just a fraction better. That is why we are continuing to work with our SMC traders to refine the concepts, profiles, coding as well as the logic behind the calculations.
Here is a list of what we are planning and working on to be released in the updates to come!
Intra-Day Profiling - Each day has a profile, what we want to achieve is to track and predict these profiles
Liquidity Scanner - There are different types of liquidity that form and we want to be able to find and track these
Smart Trend Alerts - We want to combine quant methods into SMC to provide high probability trade ideas
User Suggestions - We are always open to work with the community to bring features they want
If it's not Soldi, it isn't money

C2 Closure Alert From Key Level (FVG & Swings)This indicator is designed based on the C2 Closure Trader, specifically focusing on identifying high-probability C2 Candle Closures and Key Level Sweeps. It automates the detection of "Candle 2" setups where price sweeps a key level (Swing High/Low or FVG) and closes back inside, signaling a potential reversal or continuation.
Key Features :
Advanced C2 Detection:
Detects when the current candle (C2) sweeps the previous candle (C1).
Deep Context Check: It validates the setup by checking if C1 was interacting with a Key Level (Swing High/Low or FVG) OR if C1 just created a Fresh FVG.
Logic: Ensures no valid setup is missed, even if the sweep happens instantly after FVG creation.
Straight Sweep Lines (Visuals):
Draws a clean, straight horizontal line from the C1 High/Low to the C2 candle.
Helps you visualize exactly which level was swept.
Customization: You can change the line color and width from settings.
Smart FVG & Swing Levels:
Automatically plots Active Bullish/Bearish FVGs and Swing Highs/Lows.
Mitigation Logic: Levels remain active until a valid signal is generated or price invalidates them. Once used, they turn gray (mitigated) to keep the chart clean.
Mechanical Settings Menu:
Fully customizable inputs organized into clean groups (Algorithm, Signal, Visuals, Limits).
Label Size Control: Adjust the signal label size (Tiny to Huge) to fit your screen.
Transparent Labels: Clean "C2" text without background boxes for a professional look.
Robust Alert System:
Three specific alert options added for automation:
Bullish C2 Closure: Fires only on valid Long setups.
Bearish C2 Closure: Fires only on valid Short setups.
Any C2 Close: Fires on any valid setup.
Note: Alerts are strictly set to trigger Once Per Bar Close to avoid false signals during running candles.
How to Use:
Add to Chart: Apply the indicator to your timeframe (Recommended: 15m, 1H, 4H for narrative).
Identify Signals: Look for the "C2" text label.
Green C2: Bullish Setup (Sweep of Low + Close Up).
Red C2: Bearish Setup (Sweep of High + Close Down).
Validation: The indicator automatically checks if the sweep occurred at a valid Swing Point or FVG. If you see the signal, the context is valid.
Entry: Use the close of the C2 candle as your confirmation to frame a trade or look for lower timeframe entries.
Settings Guide:
Algorithm Sensitivity: Adjust Pivot Left/Right Bars to define how strict the Swing Highs/Lows should be.
Signal Appearance: Change the text (e.g., "Entry") or adjust the Label Size.
Active/History Limits: Control how many active or old (mitigated) lines/boxes stay on the chart to manage clutter.
Visuals: Customize colors for Bull/Bear FVGs, Highs/Lows, and Sweep Lines to match your chart theme.
Disclaimer: This tool is for educational and analytical purposes only. Always manage your risk properly.

Liquidity Sweep + FVG Entry Model//@version=5
indicator("Liquidity Sweep + FVG Entry Model", overlay = true, max_labels_count = 500, max_lines_count = 500)
// Just to confirm indicator is loaded, always plot close:
plot(close, color = color.new(color.white, 0))
// ─────────────────────────────────────────────
// PARAMETERS
// ─────────────────────────────────────────────
len = input.int(5, "Liquidity Lookback")
tpMultiplier = input.float(2.0, "TP Distance Multiplier")
// ─────────────────────────────────────────────
// LIQUIDITY SWEEP DETECTION
// ─────────────────────────────────────────────
lowestPrev = ta.lowest(low, len)
highestPrev = ta.highest(high, len)
sweepLow = low < lowestPrev and close > lowestPrev
sweepHigh = high > highestPrev and close < highestPrev
// Plot liquidity levels
plot(lowestPrev, "Liquidity Low", color = color.new(color.blue, 40), style = plot.style_line)
plot(highestPrev, "Liquidity High", color = color.new(color.red, 40), style = plot.style_line)
// ─────────────────────────────────────────────
// DISPLACEMENT DETECTION
// ─────────────────────────────────────────────
bullDisp = sweepLow and close > open and close > close
bearDisp = sweepHigh and close < open and close < close
// ─────────────────────────────────────────────
// FAIR VALUE GAP (FVG)
// ─────────────────────────────────────────────
bullFVG = low > high
bearFVG = high < low
// we’ll store the last FVG lines
var line fvgTop = na
var line fvgBottom = na
// clear old FVG lines when new one appears
if bullFVG or bearFVG
if not na(fvgTop)
line.delete(fvgTop)
if not na(fvgBottom)
line.delete(fvgBottom)
// Bullish FVG box
if bullFVG
fvgTop := line.new(bar_index , high , bar_index, high , extend = extend.right, color = color.new(color.green, 60))
fvgBottom := line.new(bar_index , low, bar_index, low, extend = extend.right, color = color.new(color.green, 60))
// Bearish FVG box
if bearFVG
fvgTop := line.new(bar_index , low , bar_index, low , extend = extend.right, color = color.new(color.red, 60))
fvgBottom := line.new(bar_index , high, bar_index, high, extend = extend.right, color = color.new(color.red, 60))
// ─────────────────────────────────────────────
// ENTRY, SL, TP CONDITIONS
// ─────────────────────────────────────────────
var line slLine = na
var line tp1Line = na
var line tp2Line = na
f_deleteLineIfExists(line_id) =>
if not na(line_id)
line.delete(line_id)
if bullDisp and bullFVG
sl = low
tp1 = close + (close - sl) * tpMultiplier
tp2 = close + (close - sl) * (tpMultiplier * 1.5)
f_deleteLineIfExists(slLine)
f_deleteLineIfExists(tp1Line)
f_deleteLineIfExists(tp2Line)
slLine := line.new(bar_index, sl, bar_index + 1, sl, extend = extend.right, color = color.red)
tp1Line := line.new(bar_index, tp1, bar_index + 1, tp1, extend = extend.right, color = color.green)
tp2Line := line.new(bar_index, tp2, bar_index + 1, tp2, extend = extend.right, color = color.green)
label.new(bar_index, close, "BUY Entry\nFVG Retest\nSL Below Sweep",
style = label.style_label_up, color = color.new(color.green, 0), textcolor = color.white)
if bearDisp and bearFVG
sl = high
tp1 = close - (sl - close) * tpMultiplier
tp2 = close - (sl - close) * (tpMultiplier * 1.5)
f_deleteLineIfExists(slLine)
f_deleteLineIfExists(tp1Line)
f_deleteLineIfExists(tp2Line)
slLine := line.new(bar_index, sl, bar_index + 1, sl, extend = extend.right, color = color.red)
tp1Line := line.new(bar_index, tp1, bar_index + 1, tp1, extend = extend.right, color = color.green)
tp2Line := line.new(bar_index, tp2, bar_index + 1, tp2, extend = extend.right, color = color.green)
label.new(bar_index, close, "SELL Entry\nFVG Retest\nSL Above Sweep",
style = label.style_label_down, color = color.new(color.red, 0), textcolor = color.white)

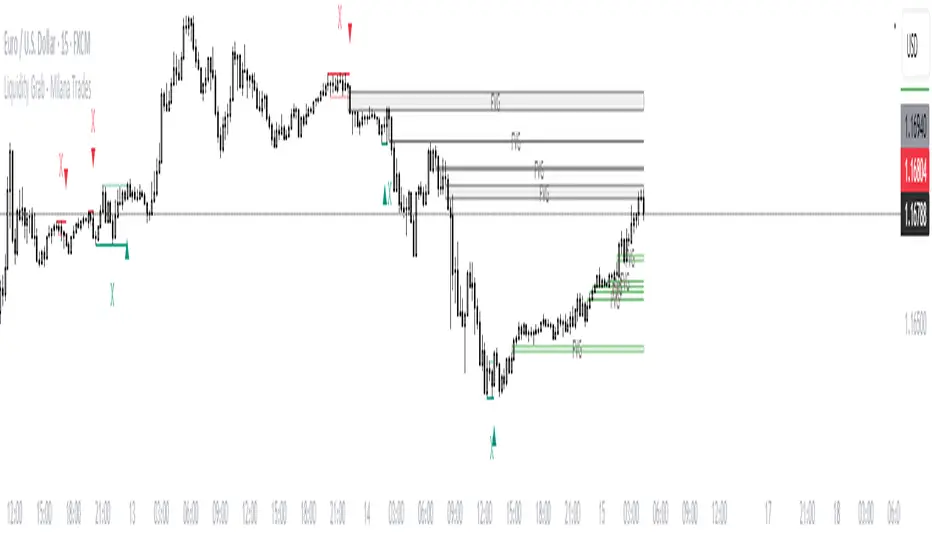
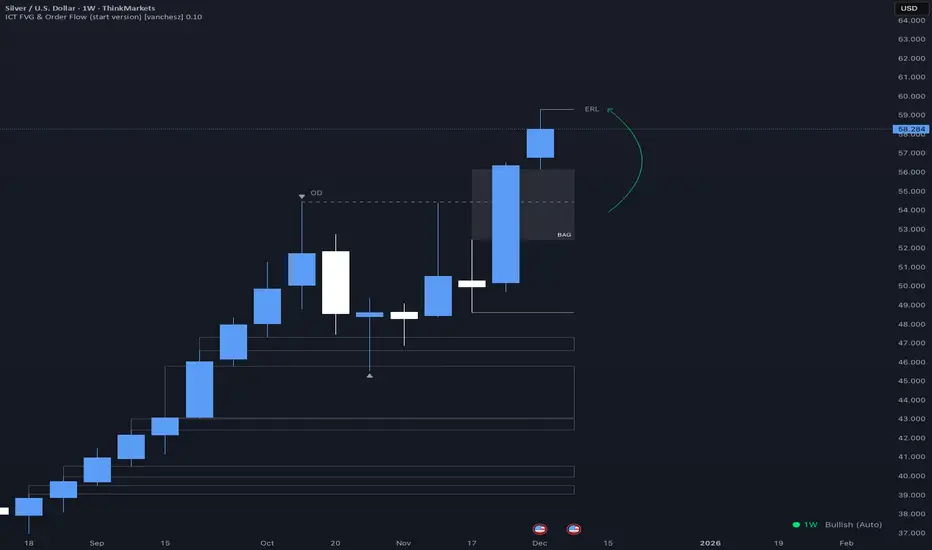
ICT FVG & Order Flow (start version) [vanchesz]Overview
Master liquidity with precision. This indicator brings the iCT trading concept to life by automatically detecting liquidity pools, fair value gaps, and key swing points. It shows you exactly where price is likely to move next — from Internal Range Liquidity (IRL) to External Range Liquidity (ERL). With built-in multi-timeframe validation, it helps you stay one step ahead of the market.
Concept
Markets move where liquidity is. According to iCT theory, price usually sweeps internal liquidity (IRL) first and then hunts for external liquidity (ERL). By mapping this process in real time, the indicator provides a clear framework for understanding market structure, liquidity grabs, and directional bias.
High Probability Leg
Context States
Key Features
Detects the High-Probability Leg (HPL) — the leg containing a fair value gap (FVG)
Highlights unmitigated FVGs within the current context.
Marks swing points (SP), IRL levels, and ERL targets automatically.
Identifies IRL rejections when liquidity is taken inside the leg
Multi-timeframe sweep check – if a single candle takes both IRL and ERL, the indicator zooms into a lower timeframe to confirm which liquidity was swept first
Flexible settings for swing points, look back bar count, depth, colors, and style
How to use
Start from the monthly chart to define the macro trend.
Analyze the latest order flow leg:
Bullish FVG = bullish context, Bearish FVG = bearish context
Step down to the daily timeframe and repeat the analysis.
Wait for price to reject from IRL (the indicator highlights it automatically).
Drop to a lower timeframe for entries — use timeframe alignment to select the right LTF.
Enter with the FVG model, targeting liquidity within the leg.
Place take profit inside the context — e.g., never above ERL(in a bullish setup).
Pro version gives you
Alerts for all context events (New context, New FVG, IRL rejection, Context failing by 2CR, ERL/SP sweep
Check of context failing by 2CR (two candle rejection)
Suggestions for every context state
This indicator is provided solely for educational and informational purposes.
It does not constitute financial advice, trading signals, or a recommendation to buy or sell any instrument.
HTF FVG + SessionsThis indicator combines multi-timeframe FVG A–C detection with intraday session boxes on a single chart.
It automatically finds bullish and bearish Fair Value Gaps on 15m, 30m, 1H, 4H, 1D and 1W timeframes.
Fresh FVGs are drawn in a transparent gold color, then dynamically shrink as price trades back into the gap.
Once price fully fills the gap, the FVG box and its label are automatically removed from the chart.
After the first touch, each FVG changes to a per-timeframe gray shade, making overlapping HTF gaps easy to see.
You can toggle each timeframe on/off and also globally enable/disable all FVGs from the settings panel.
Session boxes highlight Asia, London, NY AM, NY Lunch and NY PM using soft colored rectangles.
Each session box is plotted from the high to the low of that session and labeled with its name in white text.
A global “Show all session boxes” switch allows you to quickly hide or display the session structure.
This tool is designed for traders who want to combine FVG liquidity maps with clear intraday session context.

30s Model IndicatorThe Model
The 30s model is a NASDAQ (NQ) scalping strategy based on entries within 30-second fair-value gaps (FVGs), formed after liquidity is taken on a higher timeframe.
What the Indicator Does
The indicator identifies liquidity sweeps: swing highs/lows with at least "Left Pivot" bars to the left, capturing at least one prior swing high/low.
It then detects if a 30s FVG formed within "FVG Distance from Swing" bars of the latest liquidity-taking swing high/low.
If found, it verifies the FVG meets the "Minimum FVG Size" and that forming candles didn't hit the take-profit level.
When conditions match, the FVG is highlighted with entry, take-profit, and stop-loss lines, plus optional price labels. The appearance of all the elements can be customized in the indicator settings.
You can also setup alerts on the indicator that will trigger whenever a valid 30s is formed.
Error Conditions
Not running on 30s time-frame
Not using NQ, or MNQ

Fibonacci Cluster Zones + OB + FVG (AR34)Detailed Description – Fibonacci Cluster Zones + OB + FVG (AR34)
This script is an advanced multi-layer confluence system developed under the AR34 Trading Framework, designed to identify high-accuracy reversal zones, liquidity imbalances, institutional footprints, and trend direction using a unified analytic engine.
It combines Fibonacci mathematics, Smart Money Concepts, market structure, and smart trend signals to produce precise, reliable trading zones.
⸻
🔶 1 — Fibonacci Retracement Zones + Custom Smart Levels
The script calculates the highest and lowest prices over a selected lookback period to generate key Fibonacci retracement levels:
• 0.236
• 0.382
• 0.500
• 0.618
• 0.786
• 1.000
You can also add up to three custom Fibonacci levels (0.66, 0.707, 0.88 or any value you want).
✔ Each level is drawn as a horizontal line
✔ Optional label display for every level
✔ Color and activation fully customizable
These levels help identify pullback zones and potential turning points.
⸻
🔶 2 — True Fibonacci Cluster Detection
The script automatically identifies Cluster Zones, which occur when:
1. A Fibonacci level
2. An Order Block
3. A Fair Value Gap
all overlap in the same price range.
When all three conditions align, the script prints a CLUSTER marker in yellow.
These zones represent:
• High-probability reversal areas
• Strong institutional footprints
• Highly reactive price levels
⸻
🔶 3 — Automatic Order Block (OB) Detection
The indicator detects Order Blocks based on structural candle behavior:
• Bearish candle → followed by bullish
• Price interacts with a Fibonacci level
• Area aligns with institutional order flow
When detected, the OB is marked for easy visualization.
⸻
🔶 4 — Fair Value Gap (FVG) Mapping
The script scans for liquidity imbalances using the classic FVG logic:
• low > high
When an FVG exists, it draws a green liquidity box.
This highlights:
• Gaps left by institutional moves
• High-value return zones
• Efficient price retracement levels
⸻
🔶 5 — Fibonacci Extension Projections
The script calculates extension targets using:
• 1.272
• 1.618
• 2.000
These are drawn as dashed teal lines and help forecast:
• Breakout continuation targets
• Wave extension objectives
• Take-profit areas
⸻
🔶 6 — Smart Trend Signal (EMA-200 Engine)
Trend direction is determined using the EMA 200:
• Price above EMA → uptrend
• Price below EMA → downtrend
A green or red signal icon appears only when the trend flips, reducing noise and improving clarity.
This helps detect:
• Trend shifts early
• Cleaner entries and exits
• Trend-based filtering
⸻
🔶 7 — Four-EMA Multi-Trend System
The indicator includes optional visualization of four moving averages:
• EMA 20 → Short-term
• EMA 50 → Medium-term
• EMA 100 → Long-term
• EMA 200 → Major trend
All are fully customizable (length + color + visibility).
⸻
🔶 8 — Dynamic Negative Fibonacci Levels (Green Only)
When enabled, the script calculates deep retracement zones using:
• –0.23
• –0.75
• –1.20
These negative Fibonacci levels are drawn in green and help identify:
• Deep liquidity capture points
• Hidden structural supports
• Potential reversal bottoms
⸻
🔶 9 — Complete User Control
Users maintain full control over:
✔ Enabling/disabling OB detection
✔ Enabling/disabling FVG detection
✔ Activating custom Fibonacci levels
✔ Showing or hiding labels
✔ Selecting timeframe for Fib calculations
✔ Adjusting moving average parameters
✔ Activating dynamic Fibonacci
The script is designed to be flexible, scalable, and suitable for any trading style.
⸻
🎯 Summary
This indicator is a powerful all-in-one analytical system that merges:
✔ Fibonacci Mathematics
✔ Smart Money Concepts (OB + FVG)
✔ Trend-based filtering
✔ Institutional cluster detection
✔ Dynamic extensions + retracements
✔ Multi-EMA trend mapping
It is ideal for:
• Professional traders
• SMC / ICT analysts
• Day traders and swing traders
• Anyone using confluence-based strategies
The script provides high-precision reversal zones, trend confirmation, and institutional liquidity mapping — all within a clean and smart visual layout.

ORB w/ FVG Retest and Engulfing v001Opening Range Breakout with FVG Retest and Engulfing Indicator v001
Visual indicator implementing the "First Candle Rule" - shows entry signals for opening range breakouts with Fair Value Gap confirmation.
HOW IT WORKS:
1. Identifies first 5-minute candle at exchange open and marks high/low as key levels
2. Displays opening range lines (green high, red low)
3. Shows Fair Value Gap boxes when price breaks through levels
4. Displays entry labels when FVG retest and engulfing confirmation occur
FEATURES:
✓ Exchange-specific opening times (NYSE, NASDAQ, AMEX, TSX, LSE, ASX, Custom)
✓ Automatic opening range calculation
✓ FVG detection with visual boxes
✓ Entry signal labels at confirmation points
✓ Customizable FVG display options
✓ Toggle entry label visibility
Best used on 1-minute chart. Green FVG boxes = long opportunities, Red FVG boxes = short opportunities. Wait for entry labels to appear before considering trades.

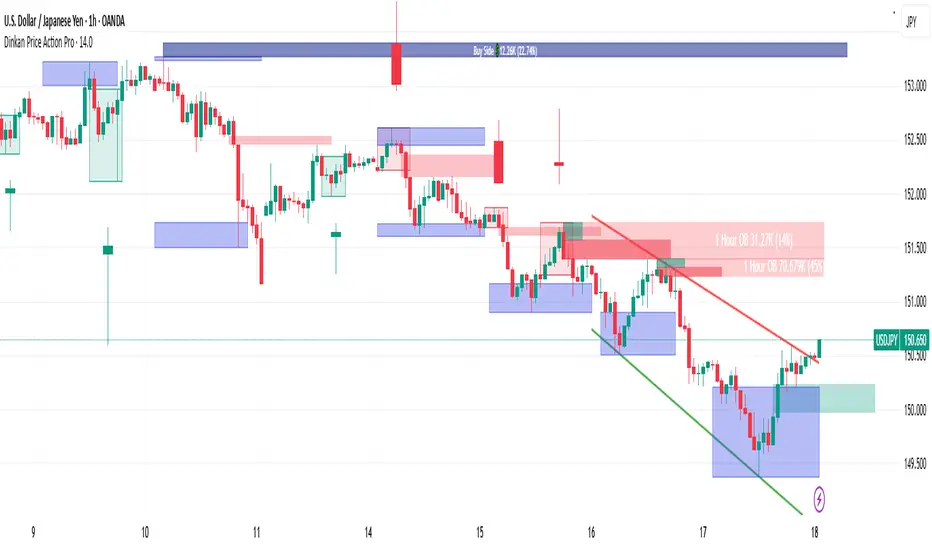
Dinkan Price Action Pro | Pure Price Action Toolkit🔸 Overview
Dinkan Price Action Pro is a pure price-action research toolkit that automatically detects and visualizes Order Blocks (OB), Fair Value Gaps (FVG), merged-candle hidden structures, liquidity zones (including HTF bias liquidity), and trendline & chart-pattern liquidity.
This indicator helps traders align with the Higher Time Frame (HTF) bias — the direction of the dominant institutional wave — and uncover hidden candlestick structures that normal timeframe charts never show.
⚙️ Core Features
✅ Automatic Order Block detection (bullish & bearish)
✅ Fair Value Gaps with real-time fill tracking
✅ Merged-Candle Engine — reveals hidden structures between standard timeframes
✅ Liquidity Zones — equal highs/lows, trendline liquidity & HTF liquidity pools
✅ HTF Bias Engine — detect directional bias across multiple timeframes
✅ Auto Trendlines & Chart Pattern Liquidity
🔍 How It Works (Step by Step)
🕯️ A. Merged Candle Engine (Hidden Structure)
1️⃣ Choose how many candles to merge (e.g., 3–5).
2️⃣ The script groups candles backward from the current bar in continuous sets.
3️⃣ Each merged candle forms using:
• Open = first candle’s open • Close = last candle’s close
• High = highest high • Low = lowest low
4️⃣ These new candles expose “hidden” structures between fixed timeframes — revealing true base-impulse patterns missed by normal charts.
🟩 B. Order Block Detection
Detects consolidation (base) followed by strong impulse.
Marks demand (green) and supply (red) zones automatically.
Strength calculated using impulse range (and volume, if available).
Older, mitigated OBs can be hidden for clarity.
🟦 C. Fair Value Gaps (FVG)
Automatically detects imbalances between consecutive candles.
Unfilled FVGs are highlighted; once filled, zones fade or gray out.
Works dynamically across merged and standard candles.
🟧 D. Liquidity Zones
Finds equal highs/lows, wick clusters, and structural liquidity.
Trendline liquidity and chart-pattern liquidity detected in real time.
Projects HTF liquidity zones from higher charts down to current timeframe.
🔺 E. HTF Bias Engine
Analyzes higher and medium timeframes (HTF/MTF) using CISD-style confirmation.
Bias auto-adjusts or can be manually selected.
🧭 Purpose: Identify the dominant institutional flow and trade in its direction.
⏰ Timeframe Alignment
Recommended structure:
HTF: 4H or 1D
MTF: 1H or 30M
LTF: 15M or 5M
Users may let the script auto-adjust or manually configure each timeframe combination.
📘 Inputs & Settings
🔹 OB sensitivity (Low / Medium / High)
🔹 Volume weighting toggle
🔹 HTF & MTF selection (Auto / Manual)
🔹 Multi-symbol mode
🔹 Visual toggles (OB, FVG, trendlines, merged candles, bias labels)
🔹 Alert toggles (zone touch, bias flip, hidden structure detection)
📊 How to Use — Workflow Example
1️⃣ Load the indicator on your chart.
2️⃣ Check the HTF Bias direction — trade only in that direction.
3️⃣ Identify nearby Order Blocks or FVGs inside HTF liquidity areas.
4️⃣ Watch the Merged Candle View to confirm hidden structures (base + impulse).
5️⃣ Wait for LTF confirmation (e.g., small structure break, wick rejection).
6️⃣ Place stop beyond the opposite OB edge; target next liquidity cluster.
🎯 This workflow aligns your lower-timeframe trades with the dominant higher-timeframe flow.
🧱 Repainting & Stability
Completed OBs and FVGs remain static — they do not repaint.
Real-time zones during candle formation can update until candle closes (standard behavior).
Merged candles are recalculated each bar; once a group closes, it remains fixed historically.
⚠️ Limitations
This is not a buy/sell signal generator.
Volume-weighted features require volume data.
Use responsible risk management and independent confirmation methods.
🔒 Invite-Only / Locked Code
The script is published as invite-only to protect proprietary implementations of:
The merged-candle engine
Liquidity and bias-detection heuristics
Invite-only publishing complies with TradingView rules.
All logic, purpose, and usage are fully described here for transparency.
🧩 Originality & Usefulness
This script is an original integrated system, not a simple mashup.
Each module is interconnected to provide a unified analytical process:
The Merged Candle Engine creates hybrid bars that expose hidden base–impulse patterns.
These merged bars feed into the Order Block and Fair Value Gap logic, refining zone accuracy.
The Liquidity Detector references those zones and merged bars to locate valid structural pools.
Finally, the HTF Bias Engine confirms directional context across multiple pairs and timeframes.
Together, these elements form a dynamic framework that interprets institutional footprints and structure flow — something no single indicator can achieve individually.
The combination produces new analytical value: a precise, adaptive HTF bias alignment and structure-based liquidity map in one visual system.
📜 Disclaimer
This tool is for educational and analytical use only.
It does not constitute financial advice.
Trading involves risk — always perform independent analysis and practice sound risk management.
Past performance does not guarantee future results.
Fair Value Gap / iVFG / Imbalance / MTF SuiteDescription
This indicator detects Fair Value Gaps (FVGs) and Imbalances across up to 10 user-selected timeframes and manages them with precise retest handling and clean visualization options.
What’s unique
3-candle FVG detection per timeframe (no lookahead).
Retest handling: on the first touch the touched edge snaps to the retest wick and the zone recolors (fresh → retested).
Right-side projection limits to avoid endless extensions.
Deterministic multi-TF overlay: HTF zones are computed independently (lookahead off) and drawn in a stable, priority-based order.
iFVG / parked zones: optionally convert a filled gap into an iFVG (parked/blue) instead of deleting/greying it.
Optional Imbalance Add-on (3-candle), with split halves + 50% midline.
How it works (technical)
FVG logic (3 candles):
Bullish when low > high (gap up); Bearish when high < low (gap down).
The created box spans the untraded range of candle B and starts at time .
Retest behavior:
On the first wick-touch, the nearest boundary adapts to the wick extreme. If enabled, the box recolors to a “retested” palette.
Projection:
Boxes extend to the right; optional bar limit constrains length.
Display limits:
FIFO pruning per direction keeps only the newest N boxes; iFVG/grey pools can share or use separate limits.
Imbalance Add-on (optional):
Classic 3-candle imbalance; draws upper/lower halves and an optional 50% midline.
No lookahead / confirmation:
Calculations run with barmerge.lookahead_off; detection finalizes on bar close (repaint-free on close).
How to use
Treat fresh gaps as potential reaction zones or confluence with liquidity / structure.
Use retested gaps for continuation or rejection logic.
Limit right-projection and visible count to keep charts readable on lower TFs.
Combine with your own execution rules (entries, stops, partials).
Key settings
General: adjust/recolor on retest, right-side limit (bars).
Display Limits: max visible per direction; separate iFVG cap if desired.
Visuals: filled vs. outline, transparency, TF labels (auto or custom), label alignment.
Theme: presets (Pegasus Classic, Icefire, Solarized, Heatmap, Pastel, Monochrome) or Custom colors.
Timeframes: enable up to 10 TF slots (e.g., M1/M5/M15/H1/H4/D1…).
Add-on — Imbalance: enable/disable, midline on/off, filled/outline, colors.
Alerts
New Bullish FVG
New Bearish FVG
Add-on: New Bullish Imbalance
Add-on: New Bearish Imbalance
Notes & limitations
FVG detection is confirmed on bar close; intrabar retest recolor can occur as price interacts.
Historical rendering depends on chart history & session settings.
Many TFs + large box counts can be heavy; use projection limits and display caps for performance.
This tool does not generate trade signals; it visualizes inefficiencies for discretionary or rules-based workflows.
Disclaimer
For educational and informational purposes only. Not financial advice.
Access / Support: Invite-only. For access or assistance, please DM.

Greer Gap# Greer Gap Indicator (No mitigation: i.e. removing false signals)
## Summary
The **Greer Gap Indicator** identifies **Fair Value Gaps (FVGs)** and introduces specialized **Greer Bull Gaps (Blue)** and **Greer Bear Gaps (Orange)** to highlight high-probability trading opportunities. Unlike traditional FVG indicators, it avoids hindsight bias by not removing historical gaps based on future price action, ensuring transparency in signal accuracy. Built upon LuxAlgo’s FVG logic, it adds unique filtering: only the first Greer Gap after an opposite gap is plotted if its level (min for Bull, max for Bear) is not higher/lower than the previous Greer Gap of the same type, while all valid gaps are recorded for comparison. Traders can use these gaps as support/resistance or entry signals, customizable via timeframe, look back, and display options.
## Description
This indicator detects and displays **Fair Value Gaps (FVGs)** on the chart, with a focus on specialized **Greer Gaps**:
- **Bullish Gaps (Green)**: Areas where the low of the current candle is above the high of a previous candle (look back period), indicating potential upward momentum.
- **Bearish Gaps (Red)**: Areas where the high of the current candle is below the low of a previous candle, indicating potential downward momentum.
- **Greer Bull Gaps (Blue)**: A bullish gap that is above the latest bearish gap's max. Only the first such gap after a bearish gap is plotted if it meets criteria (not higher than the previous Greer Bull Gap's min), but all valid ones are recorded for comparison.
- **Greer Bear Gaps (Orange)**: A bearish gap that is below the latest bullish gap's min. Only the first such gap after a bullish gap is plotted if it meets criteria (not lower than the previous Greer Bear Gap's max), but all valid ones are recorded.
## How It Works
The script uses a dynamic look back period to detect FVGs. It maintains a record of all detected gaps and applies additional logic for Greer Gaps:
- **Greer Bull Gaps**: Checks if the new bullish gap's min is above the latest bearish gap's max. Plots only if it's the first since the last bearish gap and its min is <= previous Greer Bull min (or first one).
- **Greer Bear Gaps**: Checks if the new bearish gap's max is below the latest bullish gap's min. Plots only if it's the first since the last bullish gap and its max is >= previous Greer Bear max (or first one).
- **Resets**: A new bearish gap resets the Greer Bull Gap flag, and a new bullish gap resets the Greer Bear Gap flag.
## How to Use
- **Timeframe**: Set a higher timeframe (e.g., 'D' for daily) to detect gaps from that timeframe on the current chart.
- **Look back Period**: Adjust to change gap detection sensitivity (default: 34). Use 2 if you want to compare to LuxAlgo
- **Extend**: Controls how far right the gap boxes extend.
- **Show Options**: Toggle visibility of all bullish/bearish gaps or Greer Gaps.
- **Colors**: Customize colors for each gap type.
- **Application**: Use Greer Gaps as potential support/resistance levels or entry signals, but combine with other analysis for confirmation.
## Originality and Credits
This script is inspired by and builds upon the **"Fair Value Gap "** indicator by LuxAlgo (available on TradingView: ()).
**Credits**: Thanks to LuxAlgo for the core FVG detection logic.
**Significant Changes**:
- Added **Greer Bull and Bear Gap** logic for filtered, directional gaps with reset mechanisms.
- Introduced recording of all valid Greer Gaps without plotting all, to compare levels without hindsight bias.
- **No mitigation/removal of gaps**: Unlike LuxAlgo's approach, which mitigates (removes or alters) gaps based on future price action (e.g., when filled), this can create a hindsight bias where incorrect signals disappear over time. If a signal is used for a trade and later removed due to new data, it doesn't reflect real-time performance accurately. The Greer Gap avoids this by using gap comparisons to validate signals without altering historical boxes, ensuring transparency in when signals were right or wrong.

True Order Block (OB) True Order Block (OB)
This script automatically detects and plots Order Blocks (OBs) based on the presence of Fair Value Gaps (FVGs).
Only Order Blocks are displayed on the chart.
🔎 How it works
The script looks for Fair Value Gaps (FVGs) according to a relaxed 3-candle definition.
Once an FVG is detected:
For a Bullish FVG → the last bearish candle before the gap is marked as the Bullish Order Block.
For a Bearish FVG → the last bullish candle before the gap is marked as the Bearish Order Block.
OBs are extended into the future until price either:
mitigates the zone (optional auto-removal), or
the number of live OBs exceeds the user’s maximum (FIFO cleanup).
⚙️ User settings
Draw Order Blocks (enable/disable plotting)
Minimum OB length (how far each zone extends initially)
Remove OB after violation (auto delete invalidated zones)
Max active OBs (limit on displayed zones for clarity)
Bullish/Bearish OB colors
✅ Key features
Fully automated OB detection
No clutter – only OBs are plotted (FVG logic hidden in the background)
Smart cleanup: mitigated zones are removed automatically
Customizable colors & limits
⚠️ Notes
This tool is designed for educational and analytical purposes only.
It does not generate trade signals.
Always combine with your own strategy, market context, and risk management.
