HD Trades📊 ICT Confluence Toolkit (FVG, OB, SMT)
This All-in-One indicator is designed for Smart Money Concepts (SMC) traders, providing visual confirmation and signaling for three critical Inner Circle Trader (ICT) tools directly on your chart: Fair Value Gaps (FVG), Order Blocks (OB), and Smart Money Technique (SMT) Divergence.
It eliminates the need to load multiple indicators, streamlining your analysis for high-probability setups.
🔑 Key Features
1. Fair Value Gaps (FVG)
Automatic Detection: Instantly highlights bullish (buy-side) and bearish (sell-side) imbalances using the standard three-candle pattern.
Real-Time Mitigation: Gaps are drawn until price trades into the FVG zone, at which point the indicator automatically "mitigates" and removes the box, ensuring your chart stays clean.
2. Order Blocks (OB)
Impulse-Based Logic: Identifies valid Order Blocks (the last opposing candle) confirmed by a strong, structure-breaking impulse move, quantified using an Average True Range (ATR) multiplier for dynamic sensitivity.
Mitigation Tracking: Bullish OBs are tracked until broken below the low, and Bearish OBs until broken above the high, distinguishing between active supply/demand zones.
3. SMT Divergence (Smart Money Technique)
Multi-Asset Comparison: Utilizes the Pine Script request.security() function to compare the swing structure of the current chart against a correlated asset (e.g., EURUSD vs. GBPUSD, or ES vs. NQ).
Signal Labels: Plots clear 🐂 SMT (Bullish) or 🐻 SMT (Bearish) labels directly on the chart when a divergence in market extremes is detected, signaling a potential reversal or continuation based on internal market weakness.
⚙️ Customization
All three components are toggleable and feature customizable colors and lookback periods, allowing you to fine-tune the indicator to your specific trading strategy and preferred timeframes.
Crucial Setup: For SMT Divergence to function, you must enter a correlated symbol (e.g., NQ1!, ES1!, or a related Forex pair) in the indicator settings.
Cerca negli script per "fvg"

The 'Qualified' POI Scorer [PhenLabs]📊 The “Qualified” POI Scorer (Q-POI)
Version: PineScript™ v6
📌 Description
The “Qualified” POI Scorer helps intermediate traders overcome "analysis paralysis" by filtering Smart Money Concepts (SMC) structures based on their probability. Instead of flooding your chart with every possible Order Block, this script assigns a proprietary “Quality Score” (0-100) to each zone. It analyzes the strength of the displacement, the presence of imbalances (FVG), and liquidity mechanics to determine which zones are worth your attention. It is designed to clean up your charts and enforce discipline by visually fading out low-quality setups.
🚀 Points of Innovation
Dynamic “Glass UI” Transparency that automatically fades weak zones based on their score.
Proprietary Scoring Algorithm (0-100) based on three distinct institutional factors.
Visual Icon System that prints analytical context (💧— 🚀/🐌—🧱) directly on the chart.
Automated Mitigation Tracking that changes the visual state of zones after they are tested.
Displacement Velocity calculation using ATR to verify institutional intent.
🔧 Core Components
Liquidity Sweep Engine: Detects if a pivot point grabbed liquidity from the previous X bars before reversing.
FVG Validator: Checks if the move away from the zone created a valid Fair Value Gap.
Momentum Scorer: Calculates the size of the displacement candle relative to the Average True Range (ATR).
🔥 Key Features
Quality Filtering: Automatically hides or dims zones that score below 50 (user configurable).
State Management: Zones turn grey when mitigated and delete themselves when invalidated.
Visual Scorecard: Displays the exact numeric score on the zone for quick decision-making.
Time-Decay Logic: Keeps the chart clean by managing the lifespan of old zones.
🎨 Visualization
High Score Zones (80-100): Display as bright, semi-solid boxes indicating high probability.
Medium Score Zones (50-79): Display as translucent “glass” boxes.
Low Score Zones (<50): Display as faint “ghost” boxes or are completely hidden.
Rocket Icon (🚀): Indicates high momentum displacement.
Snail Icon (🐌): Indicates low momentum displacement.
Drop Icon (💧): Indicates the zone swept liquidity.
Brick Icon (🧱): Indicates the zone is supported by an FVG.
📖 Usage Guidelines
Swing Structure Length (Default: 5): Controls the sensitivity of the pivot detection; lower numbers create more zones, higher numbers find major swing points.
ATR Length (Default: 14): Determines the lookback period for calculating relative momentum.
Minimum Quality Score (Default: 50): The threshold for which zones are considered “valid” enough to be fully visible.
Bullish/Bearish Colors: Fully customizable colors that adapt their own transparency based on the score.
Show Weak Zones (Default: False): Toggles the visibility of zones that failed the quality check.
✅ Best Use Cases
Filtering noise during high-volatility sessions by focusing only on Score 80+ zones.
Confirming trend continuation entries by looking for the Rocket (🚀) momentum icon.
Avoiding “stale” zones by ignoring any box that has turned grey (Mitigated).
⚠️ Limitations
The indicator is reactive to closed candles and cannot predict news-driven spikes.
Scoring is based on technical structure and does not account for fundamental drivers.
In extremely choppy markets, the ATR filter may produce lower scores due to lack of displacement.
💡 What Makes This Unique
It transforms subjective SMC analysis into an objective, quantifiable score.
The visual hierarchy allows traders to assess chart quality in milliseconds without reading data.
It integrates three separate SMC concepts (Liquidity, Imbalance, Structure) into a single tool.
🔬 How It Works
Step 1: The script identifies a Swing High or Low based on your length input.
Step 2: It looks backward to see if that swing swept liquidity, and looks forward to check for an FVG and displacement.
Step 3: It calculates a weighted score (30pts for Sweep, 30pts for FVG, 40pts for Momentum).
Step 4: It draws the zone with a transparency level designated by the score and appends the relevant icons.
💡 Note:
For the best results, use this indicator on the timeframe you execute trades on (e.g., 15m or 1h). Do not use it to find entries on the 1m chart if your analysis is based on the 4h chart.

ILM & IFVG StrategyPlease feel free to adjust in any way possible. Let me know if you can create something better from this initial coding.
//═══════════════════════════════════════════════════════════════════════
// Inverted Liquidity Model (ILM) – Strategy
//═══════════════════════════════════════════════════════════════════════
//
// The **Inverted Liquidity Model (ILM)** is a liquidity-based algorithm
// built to capture high-probability reversals after:
//
// • A liquidity sweep (SSL/BSL taken)
// • Rejection back inside the range
// • A Fair Value Gap (FVG) forms
// • That FVG becomes invalidated → becomes an IFVG entry zone
//
// ILM combines:
// • LTF BOS / CHOCH structure confirmation
// • HTF structure (expansion) filtering
// • Premium / Discount filter (17:00 CST session midline)
// • Optional ATR volatility filter
// • Optional trading session restrictions
// • Optional partial profit-taking + runners
//
// When all conditions align, the strategy enters:
// ✔ Long after sweep of SSL + valid long IFVG + trend confirmation
// ✔ Short after sweep of BSL + valid short IFVG + trend confirmation
//
// Stops are placed at the sweep wick.
// Full target is set at the next structural high/low.
// Optional partial TP sends a runner to full target.
//
// Visual tools (labels, sweep lines, IFVG boxes, midline) assist
// with review and forward testing.
//
//───────────────────────────────────────────────────────────────────────
// USER CONFIGURABLE FEATURES
//───────────────────────────────────────────────────────────────────────
//
// • **Liquidity & Structure**
// - pivotLen → swing length for pivots / liquidity
// - htfOn → toggle higher-timeframe pivots
// - htfTF → timeframe for HTF structure/liquidity
// - useStructureFilter → enforce LTF BOS/CHOCH trend
// - useHtfExpansionFilter → enforce HTF trend
// - showStructureLabels → show BOS/CHOCH labels
// - showHtfStructureLabels → show HTF BOS/CHOCH labels
//
// • **Premium / Discount Midline**
// - usePremiumDiscountFilter → only long in discount / short in premium
// - pdSession → session used for midline (default 17:00 CST)
// - showPdMidLine → show 50% midline
//
// • **FVG / IFVG Detection**
// - useBodyGapFVG → FVG uses candle bodies instead of wicks
// - useDisplacementFVG → require displacement bar
// - dispAtrMult → minimum ATR threshold for displacement
// - showIFVG → draw IFVG boxes
//
// • **ATR / Volatility / Sessions**
// - useRangeFilter → require minimum ATR%
// - atrLen → ATR period
// - minAtrPerc → minimum ATR% of price
// - useSessionFilter → restrict trading hours
// - sessionTimes → allowed trading session
//
// • **Sweep Visualization**
// - showSweepLines → draw sweep lines at SSL/BSL sweeps
// - sweepLineWidth → thickness of sweep lines
//
// • **Exits: Partial Targets & Runners**
// - usePartialTargets → enable partial TP logic
// - tp1QtyPercent → percent closed at TP1
// - tp1FractionOfPath → TP1 relative to path to full target
//
// • **Formatting / Visibility**
// - labelFontSizeInput → tiny / small / normal / large / huge
// - showEntries → entry markers
// - showTargets → target lines
//
//═══════════════════════════════════════════════════════════════════════
// END OF STRATEGY DESCRIPTION
//═══════════════════════════════════════════════════════════════════════

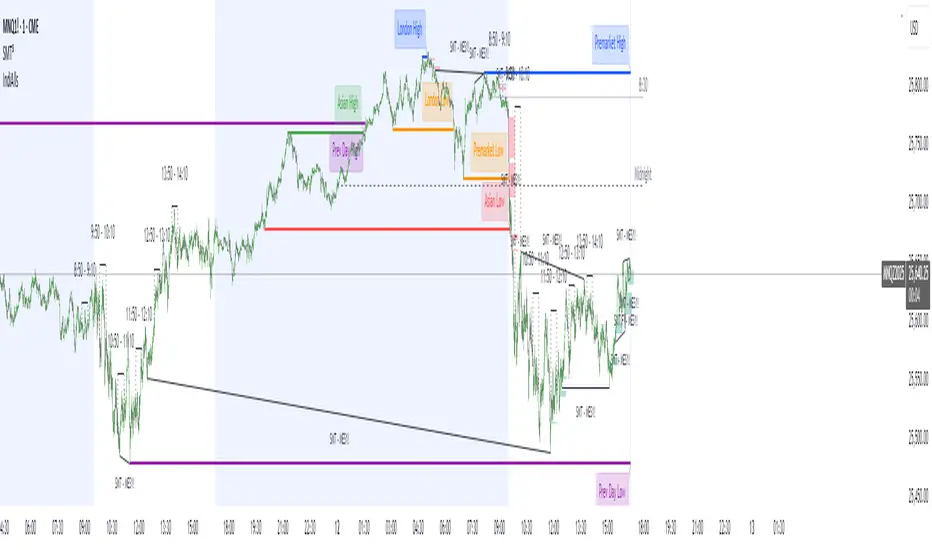
IndiAllsIndiAlls is a versatile overlay indicator designed for traders analyzing market structure, sessions, and key level. It combines several popular tools into one script, including session highs/lows, fair value gaps (FVG), macro time trackers, RSI dashboards, displacement detection, engulfing candles, and various line drawings (e.g., midnight opens, vertical lines). This indicator is intended for educational and analytical purposes, helping users visualize potential support/resistance levels, gaps, and momentum across timeframes.
Key Features
Session Highs/Lows: Tracks and draws lines for Asian and London sessions, previous day/week, and pre-market highs/lows. Lines extend until mitigated by price, with optional labels.
Midnight and 8:30 Open Lines: Plots customizable lines at midnight and 8:30 AM (America/New_York time) with styles (solid, dotted, dashed) and history options.
Fair Value Gaps (FVG): Detects bullish/bearish gaps based on a threshold percentage, draws extendable boxes, and removes them when filled (mitigated).
Macro Time Tracker: Highlights specific 20-minute "macro" windows (e.g., 8:50-9:10 AM) with lines and labels, optimized for 15-minute charts, including Friday adjustments.
Vertical Lines: Draws time-based vertical lines (e.g., every 15/30/60 minutes) within user-defined hours.
RSI Dashboard: A table displaying RSI values across multiple timeframes (1m, 2m, 3m, 5m, 15m, 1h) with color-coded overbought/oversold highlights.
Displacement Detection: Colors bars where candle range exceeds a standard deviation threshold, optionally requiring an FVG.
Engulfing Candles: Highlights bullish/bearish engulfing patterns based on size and body ratios.
How to Use
Add the indicator to your chart (works best on intraday timeframes like 1m-15m for stocks/futures).
Adjust inputs in the settings panel to enable/disable features and customize colors, widths, and thresholds.
Interpret visuals:
- Lines and boxes indicate potential key levels or gaps—watch for price interactions (e.g., bounces or breaks).
- Bar colors highlight displacement or engulfing patterns for momentum insights.
- The RSI table provides multi-timeframe overbought/oversold context.
Combine with other tools (e.g., volume, moving averages) for comprehensive analysis. Test on historical data to understand behavior.
This indicator is overlay-based and does not plot traditional series but uses lines, boxes, labels, and tables for visualization.
Input Settings
Session High/Low Settings: Toggle Asian/London/Prev Day/Week displays, colors, widths, and label sizes.
Midnight/True Day Open and 8:30 Open: Enable lines, styles (solid/dotted/dashed), colors, and history.
Pre-Market Data High/Low: Toggle pre-market (7-9 AM) highs/lows, colors, widths, and labels.
Macro Time: Enable specific macro windows (e.g., 8:50-9:10) with text options.
Fair Value Gap Settings: Toggle FVG, threshold %, extend length, colors, and timeframe.
Vertical Lines Settings: Toggle lines, timeframe (15m/30m/1h), style, color, and hour range.
RSI Dashboard Settings: Toggle dashboard, position, size, transparency, and overbought/oversold levels.
Displacement Settings: Toggle detection, require FVG, type (open-close/high-low), strength, and color.
Engulfing Candle Settings: Toggle highlighting, bar ratio threshold, body/tail ratio, and color.
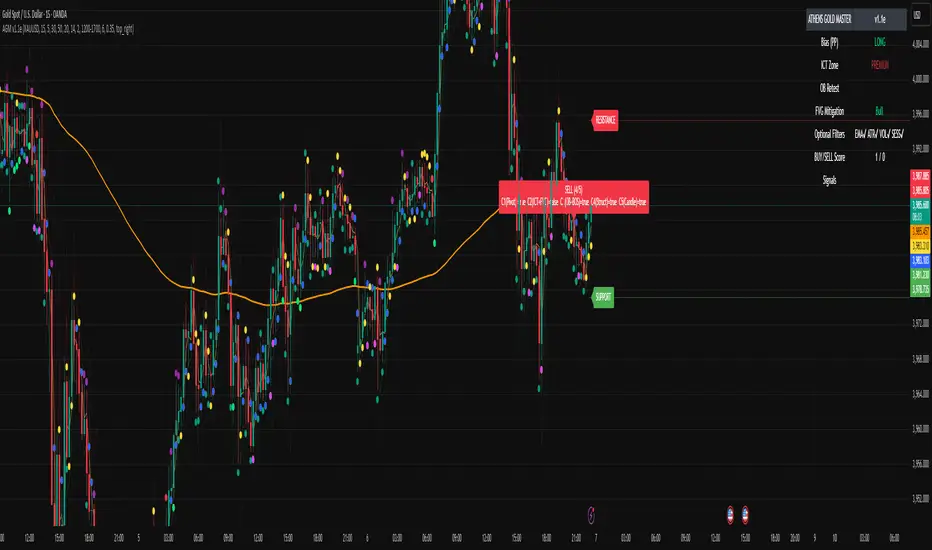
ATHENS GOLD MASTER v1.1e — by ATHENSATHENS GOLD MASTER v1.1e — by ATHENS
Professional Smart-Money-Based Gold Trading System
Built with institutional precision and ICT logic for XAUUSD traders.
⚙️ Core Strategy Components
✅ ICT Premium/Discount Model
✅ Daily Pivot Points & Price Bias
✅ Order Block & Break of Structure Detection
✅ Fair Value Gap (FVG) Mitigation Logic
✅ Dynamic Support & Resistance Recognition
✅ Candlestick + Chart Pattern Confirmation
✅ Multi-Timeframe Structure Alignment
💡 How It Works
The indicator scans real-time GOLD price action and generates Buy / Sell signals only when 3 or more confirmations align across smart money and technical confluence.
Each signal is visually marked on the chart with labels showing:
Confirmation count (1–5)
Key structure notes (Pivot, OB, FVG, etc.)
Support/Resistance zone tags
🧠 Optional Filters for Accuracy (90%+)
EMA-200 Trend Filter
ATR Volatility Filter
Volume Strength Filter
Session-Time Restriction (London–New York Overlap)
🟩 Buy Signal Example
Price above Pivot & in Discount Zone
Bullish Order Block Retest
FVG Mitigation Confirmed
Bullish Engulfing / Pin-Bar Confirmation
🟥 Sell Signal Example
Price below Pivot & in Premium Zone
Bearish Order Block Retest
FVG Mitigation Confirmed
Bearish Engulfing / Pin-Bar Confirmation
📊 Extra Features
Live Bias Table (Panel)
Selective Smart S/R Zones
Auto Session Filter
Alerts for Buy, Sell, and Strong Confluences
Best for: Gold Traders, ICT Students, Smart-Money Concepts Enthusiasts, and Professional Price-Action Analysts.
⚜️ Developed by ATHENS | Sahan Akalanka
📈 “Trade Smart. Think Institutional.”
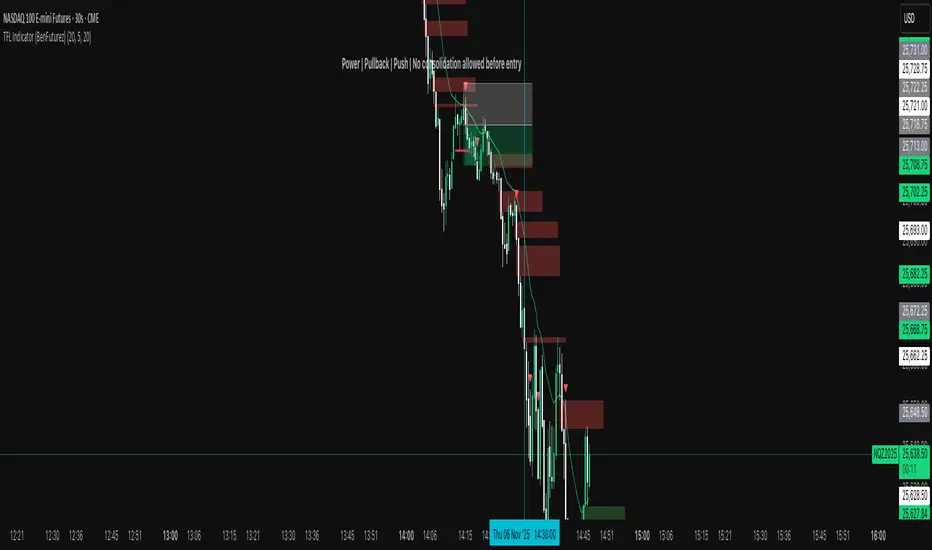
TFL Indicator (BenFuturez)Smart Fair Value Gap Trading Tool
This indicator identifies high-probability trading opportunities by combining Fair Value Gaps (FVGs) with confirmation signals and trend filtering.
KEY FEATURES:
• Automatically detects bullish and bearish Fair Value Gaps on your chart
• Generates precise entry signals based on price action confirmation
• Includes built-in trend filter using 20 EMA for higher quality setups
• Visual FVG boxes with customizable colors and extension length
• Configurable signal sensitivity with adjustable timeframe parameters
HOW IT WORKS:
The indicator marks FVG zones on your chart and monitors price behavior when these zones are tested. Entry signals appear only when multiple conditions align, including proper price structure, gap interaction, and trend direction. This multi-layered approach helps filter out low-probability trades.
SETTINGS:
• Toggle bullish/bearish FVG boxes on/off
• Adjust box colors and extension length
• Configure signal timing sensitivity
• Show/hide the 20 EMA trend filter
• Customize EMA length and color
SIGNALS:
• Green triangle = Buy signal (bullish setup confirmed)
• Red triangle = Sell signal (bearish setup confirmed)
• Built-in alerts available for all signal types
BEST PRACTICES:
• Use on lower timeframes for more signals
• Combine with proper risk management and position sizing
• Signals work best when aligned with overall market structure
• Consider multiple timeframe confirmation for best results
• Use this as a confluence to your strategy, don't just blindly follow signals!
This indicator is designed for traders who understand market structure and want a systematic approach to identifying quality entry points based on institutional order flow concepts.
TD signalsThe iFVG Smart Inversion System is a precision-based price action tool designed for traders who understand the power of liquidity and displacement. This indicator identifies Inverted Fair Value Gaps (iFVGs) — moments when price fully disrespects an existing imbalance — signaling a potential shift in market intent.
Unlike typical FVG indicators that flood the chart with zones, this system focuses on the signal behind the imbalance, not the imbalance itself.
✅ Core Logic
A signal is generated only when:
1️⃣ Price taps the 50 EMA
2️⃣ Within the next 10 bars, a previously-formed FVG is completely closed through
3️⃣ Trend is confirmed:
Buy only if price is above the 50 EMA
Sell only if price is below the 50 EMA
4️⃣ The most recent FVG is the only valid one
5️⃣ One signal per EMA tap — no clutter
6️⃣ System fully resets only after a new, clean EMA touch
7️⃣ Signal filter: Blocked when 50 EMA & 100 EMA are crossing to avoid indecision zones
This creates a highly selective, institutional-style confirmation tool with strong directional bias.
🎯 What It’s Built For
Intraday trading (5m optimal, but works on other TFs)
Liquidity grabs & displacement recognition
Trend-aligned continuation entries
Clean and minimal charting
Perfect for traders who want clarity over chaos — less noise, more conviction.
🔔 Alerts Included
TD Buy Signal
TD Sell Signal
Optional FVG disrespect notifications
Use with your preferred execution model (Breaker, iFVG continuation, BOS confirmation, etc.)
⚠️ Risk Disclosure
No indicator is 100% accurate. Always complement signals with:
Structure analysis
Liquidity context
Risk management

Lord Mathew ATSThe Smart Money Structure & Pattern Analyzer is a complete, all-in-one visual trading system that brings together every essential element of Smart Money Concepts (SMC), ICT methodology, and candlestick psychology into one powerful indicator.
It is designed to help traders instantly understand the market’s structure, liquidity flow, and potential turning points without switching tools or manually marking charts. Whether you trade forex, indices, crypto, or commodities, this indicator automatically identifies where institutional activity, imbalances, and price inefficiencies occur in real time.
With its advanced algorithm, it plots market structure shifts, equal highs and lows, liquidity zones, order blocks, fair value gaps (FVGs), and previous week and day levels (PWO, PWH, PWL, PWC, PDO, PDH, PDL, PDO). It also integrates a deep candlestick recognition engine that detects over ten classic and advanced candle formations including engulfing patterns, dojis, hammers, shooting stars, morning/evening stars, and spinning tops to provide precise confirmation at critical points of interest.
This indicator isn’t just a tool it’s a complete market map that helps traders visualize how institutional order flow and candlestick sentiment interact.
Core Features
📊 Market Structure Detection:
Automatically marks swing highs/lows, Break of Structure (BOS), and Change of Character (CHOCH) in real time.
💧 Liquidity Mapping:
Highlights equal highs/lows and liquidity grabs, showing where price is likely to target before a reversal or continuation.
🧱 Order Block Visualization:
Displays the last bullish or bearish candle before an impulsive displacement, acting as a potential institutional entry zone.
⚡ Fair Value Gap (FVG) Scanner:
Detects and highlights imbalances where price moved too fast, helping you identify high-probability retracement areas.
🕯️ Candlestick Pattern Recognition:
Recognizes key reversal and continuation patterns (engulfing, hammer, shooting star, doji, morning/evening star, etc.) in real time.
📅 Institutional Reference Points:
Plots previous week & day open (PWO, PDO), previous week & day high (PWH, PWH), previous week & day low (PWL, PDL), previous week & day close (PWC, PDC) and optionally previous day levels to help frame bias.
🎨 Customizable Design:
Toggle any feature, change colors, and set alerts when multiple Smart Money signals align for cleaner, faster decision-making.
How It Works
Add the indicator to your chart on any timeframe or market.
The algorithm automatically detects structure, liquidity, and imbalance zones.
Candlestick patterns are highlighted when they form near high-probability areas (like OBs or FVGs).
When confluence occurs such as a liquidity grab, FVG fill, and bullish engulfing candle—the indicator provides a visual signal zone for your confirmation-based entries.
You can refine your trades using higher-timeframe bias (HTF order flow) and lower-timeframe execution (LTF confirmation).
Best For
Traders using ICT, Smart Money Concepts, or price-action systems.
Intraday and swing traders looking for clear, data-driven chart structure.
Traders who want to simplify confluence analysis and focus on precision execution.
Why It Stands Out
Unlike standard candlestick or pattern scanners, this indicator merges institutional market logic with technical candle behavior, allowing traders to see where smart money might be entering or exiting positions.
It’s not about random signals it’s about context, structure, and confirmation.
Every feature in this indicator is built around the principle of liquidity engineering:
price creates liquidity, grabs it, and moves toward imbalance or order flow efficiency.
By merging that institutional logic with candlestick patterns, this tool gives traders an edge in recognizing not only where to trade but why price is reacting in that exact area.
Disclaimer
This indicator is intended for educational and analytical use. It does not provide financial advice or guaranteed trading results. Always backtest and manage your risk responsibly.

AG_STRATEGY📈 AG_STRATEGY — Smart Money System + Sessions + PDH/PDL
AG_STRATEGY is an advanced Smart Money Concepts (SMC) toolkit built for traders who follow market structure, liquidity and institutional timing.
It combines real-time market structure, session ranges, liquidity levels, and daily institutional levels — all in one clean, professional interface.
✅ Key Features
🧠 Smart Money Concepts Engine
Automatic detection of:
BOS (Break of Structure)
CHoCH (Change of Character)
Dual structure system: Swing & Internal
Historical / Present display modes
Optional structural candle coloring
🎯 Liquidity & Market Structure
Equal Highs (EQH) and Equal Lows (EQL)
Marks strong/weak highs & lows
Real-time swing confirmation
Clear visual labels + smart positioning
⚡ Fair Value Gaps (FVG)
Automatic bullish & bearish FVGs
Higher-timeframe compatible
Extendable boxes
Auto-filtering to remove noise
🕓 Institutional Sessions
Asia
London
New York
Includes:
High/Low of each session
Automatic range plotting
Session background shading
London & NY Open markers
📌 PDH/PDL + Higher-Timeframe Levels
PDH / PDL (Previous Day High/Low)
Dynamic confirmation ✓ when liquidity is swept
Multi-timeframe level support:
Daily
Weekly
Monthly
Line style options: solid / dashed / dotted
🔔 Built-in Alerts
Internal & swing BOS / CHoCH
Equal Highs / Equal Lows
Bullish / Bearish FVG detected
🎛 Fully Adjustable Interface
Colored or Monochrome visual mode
Custom label sizes
Extend levels automatically
Session timezone settings
Clean, modular toggles for each component
🎯 Designed For Traders Who
Follow institutional order flow
Enter on BOS/CHoCH + FVG + Liquidity sweeps
Trade London & New York sessions
Want structure and liquidity clearly mapped
Prefer clean charts with full control
💡 Why AG_STRATEGY Stands Out
✔ Professional SMC engine
✔ Real-time swing & internal structure
✔ Session-based liquidity tracking
✔ Non-cluttered chart — high clarity
✔ Supports institutional trading workflows

M2025Overview
We Provide you a custom made model called M2025
M2025 works based on some well-known fundamentals of trading, here are the filters/checks we used in this script:
MTF Support/Resistance (Based on RSI)
Liquidity Levels
Displacement/FVG
Support/Resistance (Based on RSI)
support and resistance are key concepts used to identify potential turning points in the market.
Support is a price level where demand is strong enough to prevent the price from falling further — it acts as a “floor.”
Resistance is a level where selling pressure tends to stop the price from rising — it acts as a “ceiling.”
Support and resistance help traders identify entry points, exit targets, and stop-loss areas, and are essential tools for understanding market structure and trend strength.
In M2025 , Support and Resistance are identified based on pivot high and pivot low found with RSI values.
Liquidity Levels
liquidity levels are price areas where a large number of buy or sell orders are clustered. These zones often form around swing highs, swing lows, support, and resistance levels, where many traders place stop-loss or pending orders.
Fair Value Gap
an FVG (Fair Value Gap) refers to an imbalance or “gap” in price action that occurs when the market moves too quickly in one direction, leaving little to no trading activity between certain price levels. This gap represents an area where buy and sell orders were not efficiently matched, creating an inefficiency in the market.
Traders often expect price to return to these zones later to “fill” the gap, restoring balance and are used to identify potential retracement zones.
How it works
This Model 2025 mainly works in 4 steps using all the techniques mentioned above.
Bullish Setup
Step 1 : Market is in Bullish Zone
Step 2 : Market Breaks the Buy Side Liquidity
Step 3 : Market Makes FVG while moving up before breaking the SSL
Step 4 : Market Breaks the Sell Side Liquidity within the Window Range
Bearish Setup
Step 1 : Market is in Bearish Zone
Step 2 : Market Breaks the Sell Side Liquidity
Step 3 : Market Makes FVG while moving down before breaking the BSL
Step 4 : Market Breaks the Buy Side Liquidity within the Window Range
Conclusion
M2025 works using well known trading techniques but the innovation in that is using them as steps and triggers which stimulate the real trading methods of many trades around the world. This is just an idea which we wanted to share with this great community of ours, thus this indicator is a tool for technical analysis and it should not be the sole basis for trading decisions for anyone out there. No indicator is perfect hence depending on one is not recommended.

Forex FX V2.1💠 Forex FX — Smart Liquidity & FVG Engine
Forex FX is an advanced indicator designed for the forex market, combining multi-timeframe analysis, liquidity zones, and Fair Value Gaps (FVG) to highlight high-probability trading areas.
It automatically detects the market bias (Bull/Bear/Flat), current session activity, and H4–M5 FVG confluence, generating contextual Buy/Sell signals filtered by quality conditions.
🔹 Key Features
• Automatic detection of Bullish & Bearish Fair Value Gaps (FVG) across multiple timeframes
• Identification of Buy/Sell liquidity zones and exhaustion levels
• Real-time market state detection (trend, correction, or idle)
• Session filters optimized for EURUSD (15:00–22:00) and XAUUSD (Full-time)
• Contextual signal states (“Wait”, “Buy”, “Sell”) displayed in a clean on-chart panel
• Automatic LIMIT order expiration to avoid outdated setups
🎯 Purpose:
To provide traders with a visual map of liquidity and fair-value imbalance zones, enabling precise entries only when technical structure, bias, and timing align.

ScalpDaddy V3ScalpDaddy bundles eight battle‑tested tools into a single, toggleable overlay for fast confluence and clean charts. It’s designed for intraday scalpers and swing traders who want a lightweight dashboard plus precision levels and volatility context—without juggling multiple indicators.
What’s Inside (all can be turned on/off)
SD: Trend Sniper (MTF RSI/ADX table)
8‑TF heatmap with emoji glyphs (momentum/strength/chop).
Weighted bias meter, HTF dominance and adjacency bonus to reward agreement.
Tiny Entry‑Qualifier dashboard (Trend, Throttle, Quality, Boost) for quick “go/no‑go”.
SD: Squeeze (BB/KC)
Bollinger Bands + Keltner Channel with squeeze fill for compression/expansion reads.
SD: Fibonacci Levels
Swing‑aware fib grid with instant flip option, reject band, extension gates, target‑zone shading, and labels.
SD: PM/AH/RTH Levels
Prior extended‑hours and prior RTH high/low, with dynamic/previous‑only modes.
SD: Pivot Points (Structure)
Clean, confirmed pivot markers to visualize HH/HL/LH/LL, BOS/MSS turns.
SD: Liquidity Sweeper
Buyside/Sellside liquidity pools with live maintenance and optional invalidation highlighting.
SD: FVG Finder
Present/Full‑history scan with budget controls, configurable fill logic and coloring.
SD: Fourier ATR
Smoothed ATR “center line” with envelope; optional labels when price exits/re‑enters the band.
Quick Start
Open inputs. In “SD: Modules,” enable only what you need for the session.
For Trend Sniper:
Pick “Table TF Preset” (e.g., fibs day trade, scalp, short/long swing) or enable “Custom TFs” and set each TF.
Choose Update Mode: “Live” for intrabar responsiveness or “On Close” for confirmed, non‑flickering signals.
Table and mini dashboard positions are configurable.
Optional confluence:
Turn on Squeeze to spot compression before Trend Sniper shifts.
Add Sessions + Liquidity + FVG to map targets/voids and where price is likely to react.
Use ATR Envelope to gauge when price is stretching outside normal travel.
How To Read The Trend Sniper Table
Emojis:
🚀/🔥 = bullish pressure; ⚓️/🩸 = bearish pressure; 🪓 = chop; ⚠️ = caution (e.g., OB/OS with strong ADX).
Bias:
A normalized, weighted read of the 8 TFs. The default thresholds used for alerts: +0.30 (bullish) / −0.30 (bearish).
HTF dominance:
When enabled, strong alignment on the slowest TFs dampens opposite LTF noise.
Entry‑Qualifier mini dash:
“Trend” (ADX), “Throttle” (RSI), “Quality” (Chop), “Boost” (relative volume). Green/steady reads support continuation; yellow/red flags warn of choppiness/whipsaw.
Module Notes
Squeeze (BB/KC): Look for squeeze fill changes—breakouts often follow compression.
Fibonacci: “Zigzag Period” sets swing sensitivity; “Instant flip” optionally flips the active leg when price breaks a chosen threshold (wick/close). Target‑zone shading highlights extension ranges; labels can be limited to extensions only.
PM/AH/RTH: “RTH Mode” = Dynamic (today’s running levels during RTH) or Previous Session Only. Optional volume filter for PM/AH to show only significant sessions.
Pivot Points: Uses confirmed pivots; simple circular markers show HH/HL/LH/LL and shifts (BOS/MSS) without clutter.
Liquidity: “margin” adjusts pool thickness sensitivity; enable “Show Broken” to keep invalidated pools visible with different fill.
FVG Finder: Choose Present or Full History and set a bar budget to control performance. “Fill Mode” supports touch/close/percent thresholds.
Fourier ATR: Envelope defines typical travel. Optional labels:
⚠️ when price exits the band
⬇️ when price re‑enters
Built‑in Alerts
Open the Alerts dialog and choose this indicator; you’ll see named alerts you can attach to any symbol/interval:
Bull Combo (🚀/🔥 no ⚠️)
Table: RSI/ADX Bull Majority
Table: RSI/ADX Bear Majority
Bias turns Bullish (≥ +0.30)
Bias turns Bearish (≤ −0.30)
EQ Bull Align
EQ Bear Align
ATR: ⚠️ Price exited envelope
ATR: ⬇️ Price re‑entered envelope
Performance Tips
Start with only the modules you need. Turn others off in “SD: Modules.”
For FVG, use Present mode with a reasonable “Present Mode Bars” budget on lower timeframes.
Set Trend Sniper to “On Close” for steadier updates during fast markets.
Heavy drawings (many labels/lines/fills) can be reduced by lowering visible counts or disabling labels.
Best Practices & Disclaimers
Educational tool, not financial advice. Past performance does not guarantee future results.
Signals are contextual—use with sound risk management and higher‑timeframe bias.
Some elements can update intrabar when “Live” or “allow repaint” is on (ATR emojis); prefer confirmed/close‑based modes if you want steadier behavior.
Works on most symbols and timeframes; intended primarily for intraday to swing trading.

Smart Structure Pro - Market Structure & Smart Money Concepts═══════════════════════════════════════════════════════════════════════════════
SMART STRUCTURE PRO
═══════════════════════════════════════════════════════════════════════════════
A comprehensive market structure analysis tool that identifies institutional trading
patterns and smart money concepts for improved trade timing and decision-making.
═══════════════════════════════════════════════════════════════════════════════
📊 WHAT IT DOES
═══════════════════════════════════════════════════════════════════════════════
This indicator automatically detects and visualizes key market structure elements:
🔹 BOS (Break of Structure)
- Identifies trend continuation patterns
- Marks when price breaks above previous highs (bullish) or below previous lows (bearish)
- Confirms trend strength and momentum
🔹 CHoCH (Change of Character)
- Detects potential trend reversals
- Alerts when market structure shifts from bullish to bearish or vice versa
- Helps identify early reversal opportunities
🔹 Order Blocks
- Highlights institutional entry zones
- Identifies the last opposite candle before a structure break
- Shows areas where smart money likely entered positions
🔹 Fair Value Gaps (FVG)
- Detects price imbalances and inefficiencies
- Shows areas where price moved rapidly leaving gaps
- Often act as support/resistance when retested
🔹 Liquidity Zones
- Marks swing high and low levels
- Identifies areas where stop losses likely cluster
- Shows potential stop hunt and liquidity grab zones
═══════════════════════════════════════════════════════════════════════════════
🎯 HOW TO USE
═══════════════════════════════════════════════════════════════════════════════
BULLISH SETUP:
1. Wait for Bullish CHoCH (trend reversal signal) or BOS ↑ (continuation)
2. Look for price to pull back into an Order Block or Fair Value Gap
3. Enter long when price bounces from these zones
4. Place stop loss below the Order Block
5. Target the next liquidity zone or resistance level
BEARISH SETUP:
1. Wait for Bearish CHoCH (trend reversal signal) or BOS ↓ (continuation)
2. Look for price to retrace into an Order Block or Fair Value Gap
3. Enter short when price rejects from these zones
4. Place stop loss above the Order Block
5. Target the next liquidity zone or support level
DASHBOARD INTERPRETATION:
• Trend: Current market direction (Bullish/Bearish)
• Volume: Confirmation strength (High volume = stronger signals)
• Signal: Latest structure break detected
• Key High/Low: Critical levels for the current trend
• Position: Price location (Premium = expensive, Discount = cheap)
═══════════════════════════════════════════════════════════════════════════════
⚙️ SETTINGS GUIDE
═══════════════════════════════════════════════════════════════════════════════
STRUCTURE DETECTION:
• Pivot Length (Default: 10)
- Lower values = More signals but potentially weaker
- Higher values = Fewer signals but stronger/more reliable
- Recommended: 8-12 for intraday, 10-15 for higher timeframes
• Structure Line Extension
- Visual preference for how far lines extend
- Does not affect signal detection
SMART MONEY CONCEPTS:
• Order Block Extension: How long OB boxes remain visible
• FVG Extension: How long gap boxes remain visible
• Min FVG Size: Filter out small gaps (0 = show all)
- Set to 10-20% to reduce noise
- Set to 0 to see all gaps
VOLUME FILTER:
• Volume Confirmation (Recommended: ON)
- Filters weak signals without volume support
- Reduces false breakouts
• Volume Multiplier (Default: 1.5)
- Higher = Stricter filtering (fewer but stronger signals)
- Lower = More signals (but may include weak ones)
DISPLAY:
• Dashboard: Toggle information panel
• Trend Background: Subtle color tint showing current trend
• Dashboard Position: Choose corner placement
═══════════════════════════════════════════════════════════════════════════════
🔔 ALERTS
═══════════════════════════════════════════════════════════════════════════════
Available alert conditions:
✓ Bullish BOS - Uptrend continuation confirmed
✓ Bearish BOS - Downtrend continuation confirmed
✓ Bullish CHoCH - Reversal to uptrend detected
✓ Bearish CHoCH - Reversal to downtrend detected
✓ Structure Break - Any significant market structure change
To set up alerts:
1. Click the "⏰" alert icon
2. Select "Smart Structure Pro"
3. Choose your desired condition
4. Configure notification method
5. Click "Create"
═══════════════════════════════════════════════════════════════════════════════
⚠️ IMPORTANT DISCLOSURES
═══════════════════════════════════════════════════════════════════════════════
REPAINTING BEHAVIOR:
• Pivot points WILL repaint until confirmed (this is by design and unavoidable)
• Structure breaks (BOS/CHoCH) use CLOSED candles and do NOT repaint after confirmation
• Order Blocks and FVGs are drawn on confirmed signals and do NOT repaint
• All signals wait for candle close before triggering
BEST PRACTICES:
• Use on higher timeframes (15min+) for more reliable signals
• Combine with other analysis (support/resistance, volume profile, etc.)
• Wait for candle close confirmation before acting on signals
• Use proper risk management - this is not a standalone trading system
• Backtest on your preferred instrument and timeframe
PERFORMANCE:
• Limited to 100 boxes, 100 lines, 100 labels for optimal performance
• Older objects automatically removed as new ones appear
• Works on all markets (Forex, Crypto, Stocks, Indices, Commodities)
═══════════════════════════════════════════════════════════════════════════════
📚 CONCEPTS EXPLAINED
═══════════════════════════════════════════════════════════════════════════════
MARKET STRUCTURE:
Market structure refers to the pattern of price movements creating swing highs
and lows. Understanding structure helps identify trend direction and potential
reversal points.
SMART MONEY CONCEPTS:
These are trading techniques based on tracking institutional order flow and
understanding where large players (banks, funds, institutions) enter and exit
positions.
ORDER BLOCKS:
The last opposing candle before a strong directional move. Institutions often
leave unfilled orders in these zones, which can act as support/resistance when
price returns.
FAIR VALUE GAPS:
Areas where price moved so quickly that it left an imbalance. These gaps often
get "filled" as price returns to find equilibrium, creating trading opportunities.
═══════════════════════════════════════════════════════════════════════════════
🎓 EDUCATIONAL VALUE
═══════════════════════════════════════════════════════════════════════════════
This indicator helps traders:
✓ Understand market structure mechanics
✓ Identify institutional trading patterns
✓ Improve trade timing and entry precision
✓ Recognize trend continuation vs reversal
✓ Learn smart money concepts through visualization
═══════════════════════════════════════════════════════════════════════════════
📋 TECHNICAL DETAILS
═══════════════════════════════════════════════════════════════════════════════
• Version: 1.0.0
• Pine Script Version: 5
• Indicator Type: Overlay
• No Repainting: Structure breaks use confirmed candles
• Performance Optimized: Limited drawing objects
• Works On: All markets and timeframes
• Alerts: Yes, fully customizable
═══════════════════════════════════════════════════════════════════════════════
👤 AUTHOR
═══════════════════════════════════════════════════════════════════════════════
Created by: Zakaria Safri
Original Work: All code and concepts are original implementations
Based On: ICT (Inner Circle Trader) educational concepts
License: © 2024 Zakaria Safri - Personal Use Only
═══════════════════════════════════════════════════════════════════════════════
⚖️ DISCLAIMER
═══════════════════════════════════════════════════════════════════════════════
This indicator is for educational and informational purposes only. It does not
constitute financial advice. Trading involves substantial risk of loss. Past
performance does not guarantee future results. Always conduct your own research
and consult with a licensed financial advisor before making trading decisions.
The author is not responsible for any losses incurred from using this indicator.
═══════════════════════════════════════════════════════════════════════════════
If you find this indicator helpful, please:
👍 Like and favorite
⭐ Leave a review
📢 Share with other traders
💬 Comment with feedback or suggestions
Happy Trading! 📈

Entry (MTF) - Three phase Reversal patternOf course. We can absolutely reframe the explanation to give the strategy a more unique or generalized name, focusing on the concepts rather than the specific mentor.
Here is a revised, in-depth guide for your "Entry(MTF)" indicator, presented as the **"Momentum Shift Entry Model."**
***
### Entry (MTF) Indicator: A Guide to the Momentum Shift Model
This powerful indicator is designed to automatically detect a high-probability **Momentum Shift Entry Pattern**. The core strategy is to identify moments where the market's direction is likely to make a significant and sustained reversal, often driven by institutional order flow.
The indicator's key advantage is its **Multi-Timeframe (MTF)** functionality. It allows you to find these robust setups on a higher timeframe (like the daily chart) and then projects those signals onto your active, lower timeframe chart (like the 15-minute), providing a clear strategic edge for timing your entries.
---
## The Core Logic: The Three-Phase Reversal Pattern
This indicator is not based on a simple lagging condition. It looks for a specific three-step sequence of events. This sequence validates a genuine shift in market control from sellers to buyers (or vice-versa), filtering out false moves.
### Step 1: The Liquidity Purge 🎯
First, the indicator identifies recent, significant swing highs and lows on the chart. These price levels are natural magnets for liquidity, as many traders place their stop-loss orders there.
* **A Bullish Setup** begins when the price first dips **below a recent swing low**. This action is often an engineered move to "purge" or "sweep" the sell-side liquidity resting there before a move higher.
* **A Bearish Setup** begins with a price spike **above a recent swing high**, clearing out the buy-side liquidity.
This initial phase is designed to trap traders on the wrong side of the market before the true move begins.
### Step 2: The Market Structure Shift (The Confirmation) 🔄
After the liquidity has been taken, the indicator needs confirmation that a real power shift has occurred. This is confirmed by a **Market Structure Shift (MSS)**.
* After a **bullish purge (of a low)**, an MSS is confirmed when the price aggressively rallies and closes **above a recent swing *high***. This proves that buyers have not only absorbed all the selling but are now strong enough to break previous resistance levels.
* After a **bearish purge (of a high)**, an MSS is confirmed when the price falls and closes **below a recent swing *low***, showing that sellers are now decisively in command.
### Step 3: The Price Imbalance (The Entry Zone) GAP) is created during the same powerful move that caused the Market Structure Shift. A Fair Value Gap, or **price imbalance**, is a three-candle pattern that signifies a very aggressive, one-sided move, leaving a gap in the market that price will often seek to re-fill.
This FVG acts as the signature of institutional activity and becomes a high-probability zone for planning a trade entry.
---
## How to Use the Indicator in Your Trading
The true strength of this indicator lies in combining the higher-timeframe signal with the immediate context of your trading timeframe.
### Reading the Signals and Visuals
* **`BUY` / `SELL` Labels:** These are your primary signals, generated from the **"Signal Timeframe"** you select (e.g., Daily). A "BUY" label indicates that the complete three-phase bullish pattern has been confirmed on that higher timeframe.
* **Dotted Lines (Liquidity Levels):** The red and green dotted lines on your chart mark the most recent swing high and low on your **current timeframe**. These are the levels to watch for a potential "Liquidity Purge."
* **Colored Boxes (Imbalance Zones):** The green (bullish) and red (bearish) boxes highlight the Fair Value Gaps on your **current timeframe**. These are your potential entry zones.
### A Potential Trading Strategy
1. **Set Your Signal Timeframe:** Choose a higher timeframe that you use to define the overall trend (e.g., 'D' for daily, '4H' for 4-hour).
2. **Wait for an HTF Signal:** Patiently wait for a `BUY` or `SELL` label to appear. This is your cue to begin actively looking for an entry.
3. **Find a Local Entry Zone:** Once a `BUY` signal from the higher timeframe appears, look for the price on your current chart to retrace into a nearby **bullish FVG (green box)**. For a `SELL` signal, look for a pullback into a **bearish FVG (red box)**.
4. **Entry:** Plan your entry as the price tests this imbalance zone.
5. **Stop Loss:** A logical stop loss is critical. For a buy trade, place your stop below the swing low that was formed during the MSS. For a sell trade, place it above the corresponding swing high.
6. **Take Profit:** Aim for a significant liquidity level on a higher timeframe or use a predetermined risk-to-reward ratio (e.g., 1:2, 1:3).
---
## Customizing the Settings
* **`Signal Timeframe`**: The most critical setting. It determines the timeframe from which the core buy/sell logic originates. A Daily signal will carry more weight than an H1 signal.
* **`Liquidity/MSS Lookback`**: This controls the significance of the swing points the indicator uses.
* **Higher value:** Finds major, long-term swing points, leading to fewer but more powerful signals.
* **Lower value:** Finds minor, short-term swing points, leading to more frequent but potentially less reliable signals.
* **`Show Current TF Fair Value Gaps`**: This toggles the visibility of the imbalance zones (FVG boxes) on your chart. It is highly recommended to keep this enabled to easily spot your entry areas.

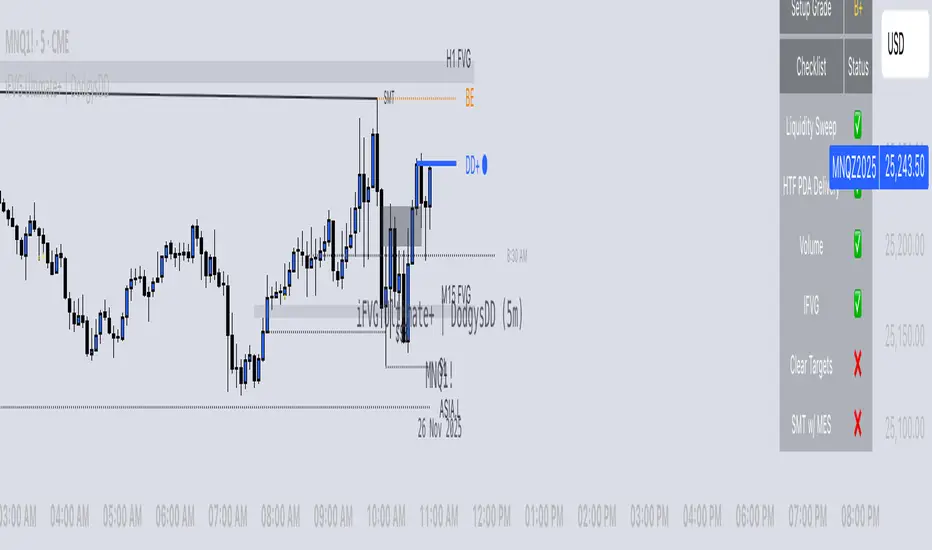
iFVG Ultimate+ | DodgysDDOVERVIEW
iFVG Ultimate+ | DodgysDD is a professional-grade visualization framework that automates the identification and management of Inversion Fair Value Gaps (IFVGs)
It is designed for analysts and educators studying institutional price behavior, liquidity dynamics, and displacement-based imbalances.
This indicator does not provide trading signals or forecasts.
All logic serves educational and analytical purposes only.
A Fair Value Gap (FVG) appears when strong directional displacement prevents candle bodies from overlapping.When a liquidity sweep occurs and price later closes through that gap, the imbalance is considered inverted. This often marks a shift in order-flow.
iFVG Ultimate+ tracks these transitions using a rule-based sequence:
Liquidity Sweep – Price sweeps a previous swing high or low.
Displacement – Body-to-body gap forms as price accelerates away.
Inversion – Full candle body closes through the gap after raid.
Validation and Tracking – Confirmed inversions are stored and managed until completion or invalidation.
-----------------------------------------------------------------------------------------------
PURPOSE AND SCOPE
-----------------------------------------------------------------------------------------------
The framework serves as a research tool to document and analyze IFVG behavior within liquidity and session contexts.
It is commonly used to:
-Record and journal IFVG formations for back-testing and model study.
-Assess how often gaps complete or invalidate after sweeps.
-Evaluate session-based patterns (London, Asia, New York).
-Overlay HTF PD Arrays to observe inter-timeframe delivery.
-Receive custom alerts to your phone
-----------------------------------------------------------------------------------------------
LOGIC STRUCTURE
-----------------------------------------------------------------------------------------------
iFVG Ultimate+ runs a five-stage validation process to ensure sequential, non-repainting behavior.
Liquidity Framework:
• Detects swing highs and lows on aligned timeframes (automatic or manual selection).
• Logs session highs/lows for Asia (20:00–00:00 NY) and London (02:00–05:00 NY).
• Includes data wicks around 08:30 NY for event reference.
FVG Detection and Displacement Filter:
• Identifies body-based imbalances using ATR-scaled sensitivity modes (Sensitive / Normal / Strict).
• Supports “Single” or “Series” modes to merge adjacent gaps.
• Excludes weak displacements using minimum ATR thresholds.
Inversion Validation:
• Confirms only when a complete candle body closes through a qualifying FVG within a user-defined window (6 or 15 bars).
• Duplicate detections are ignored; mitigation states are recorded.
HTF Context Integration:
• Maps higher-time-frame PD Arrays and tracks their delivery status.
• Labels active zones (e.g. “H4 PDA”) and updates on HTF close.
Model Lifecycle and Limits:
• Plots the inversion line and derives educational limit levels: Break-Even and Stop-Loss.
• Tracks until opposing liquidity is swept (model complete) or an invalidation event occurs.
-----------------------------------------------------------------------------------------------
COMPONENTS AND VISUALS
-----------------------------------------------------------------------------------------------
-IFVG Line — Marks confirmed inversion at close.
-Break-Even / Stop-Loss Lines — Calculated retrospectively for journal grading.
-Session High/Low Markers — London and Asia reference levels.
-Data Wicks — 8:30 NY “DATA.H/L” labels for event volatility.
-SMTs — Compares current symbol to correlated instrument for divergence confirmation.
-Checklist Panel — Tracks liquidity, momentum, HTF delivery, and SMT conditions.
-Setup Grade Display — Computes qualitative score (A+ to C) based on met conditions.
-----------------------------------------------------------------------------------------------
INPUT CATEGORIES
-----------------------------------------------------------------------------------------------
General — Detection mode, ATR strictness, bias filter, long/short window.
Liquidity — Automatic or manual timeframe alignment, session visuals.
FVG — Color themes, label sizes, inversion color change, HTF inclusion.
Entry / Limits — Enable or hide Entry, Break-Even, and Stop-Loss levels.
Alerts — Individual toggles for IFVG formation, session sweeps, multi-TF inversions, and invalidations.
Display — Info Box, relationship table, and grade styling.
All alerts output plain text messages only and do not execute orders.
-----------------------------------------------------------------------------------------------
ALERT FRAMEWORK
-----------------------------------------------------------------------------------------------
When enabled, alerts may notify for:
-Potential inversion detected.
-Confirmed IFVG formation.
-Liquidity sweeps (high/low or session).
-Multi-time-frame inversion.
-Invalidation or close warning.
-Alerts serve as educational markers only, not trade triggers.
The user will have the ability to create custom messages for each of these alert events.
-----------------------------------------------------------------------------------------------
USAGE GUIDELINES
-----------------------------------------------------------------------------------------------
iFVG Ultimate+ is suited for review and documentation of displacement-based price behavior.
Recommended educational workflows:
-Annotate IFVG events and review delivery into PD Arrays.
-Analyze frequency by session or timeframe.
-Assess how often IFVGs complete versus invalidate.
-Teach ICT-style liquidity mechanics in mentorship or training contexts.
-The indicator works across forex, futures, and crypto markets.
-----------------------------------------------------------------------------------------------
OPERATIONAL NOTES AND LIMITATIONS
-----------------------------------------------------------------------------------------------
-HTF calculations finalize on bar close (no look-ahead).
-ATR filter strength affects small-gap visibility.
-Session windows use New York time.
-Break-Even and Stop-Loss lines are visual aids only.
-Performance depends on chart density and bar count.
-No strategy module or backtest engine is included.
-----------------------------------------------------------------------------------------------
ORIGINALITY AND PROTECTION
-----------------------------------------------------------------------------------------------
iFVG Ultimate+ | DodgysDD integrates multiple independent systems into a single engine:
-PD Array context alignment with liquidity tracking.
-Dynamic session detection and macro data integration.
-Sequential IFVG validation pipeline with grade assignment.
-Multi-time-frame SMT confirmation module.
-Structured alerts and mitigation tracking.
The logic is entirely original, written in Pine v6, and protected as invite-only to preserve methodology integrity.
-----------------------------------------------------------------------------------------------
ATTRIBUTION
-----------------------------------------------------------------------------------------------
Core concepts such as Fair Value Gaps, Liquidity Sweeps, PD Arrays, and SMT Divergence are publicly taught within ICT-style market education. This implementation was designed and engineered by TakingProphets as iFVG Ultimate+ | DodgysDD, authored for TradingView publication by TakingProphets.
-----------------------------------------------------------------------------------------------
TERMS AND DISCLAIMER
-----------------------------------------------------------------------------------------------
This indicator is for educational and informational use only. It does not provide financial advice or predictive output. Historical patterns do not guarantee future results. All users remain responsible for their own decisions.Use of this script implies agreement with TradingView’s Vendor Requirements and Terms of Use.
-----------------------------------------------------------------------------------------------
ACCESS INSTRUCTIONS
-----------------------------------------------------------------------------------------------
Access is managed through TradingView’s invite-only framework. Users request access via private message to TakingProphets or access link
OrderBlocks by exp3rts (Non-Repainting)The OrderBlocks by exp3rts indicator automatically identifies and visualizes bullish and bearish order blocks using confirmed, non-repainting fractals combined with Fair Value Gap (FVG) validation for enhanced accuracy.
This tool is designed to help traders spot high-probability institutional price zones — areas where large buy or sell orders previously caused significant moves — allowing you to anticipate potential reversal, continuation, or mitigation levels with precision.
Core Features
✅ Non-Repainting Logic: Uses confirmed 3- or 5-bar fractals only after full pattern completion.
📈 Dynamic Order Block Detection: Marks both bullish and bearish OBs automatically.
⚖️ FVG Filter (Optional): Optionally require a Fair Value Gap within a user-defined distance to confirm valid OBs.
🎯 Customizable OB Lines: Adjust color, style (solid, dashed, dotted), width, and body/wick placement.
🧹 Auto-Cleanup: Option to remove order block lines once price has been mitigated (touched/filled).
🔺🔻 Fractal Display: Toggle fractal highs/lows on or off for extra structure clarity.
⚡ Optimized for Performance: Uses efficient array management to run smoothly within TradingView’s bar processing limits.
How to Use
Add the indicator to your chart.
Adjust settings such as Fractal Filter (3/5), FVG distance, and Line Style to match your trading preference.
Watch for bullish OBs (green lines) near potential demand zones and bearish OBs (red lines) near supply zones.
Use in confluence with market structure and liquidity concepts for best results.
Settings Overview
Fractal Filter: Choose between 3-bar or 5-bar swing fractals.
Order Block Type: Detect OBs based on Close or High/Low break structure.
FVG Filter: Optionally require nearby Fair Value Gaps.
Delete After Fill: Automatically remove mitigated OBs.
Visuals: Customize line color, thickness, and style for clear chart integration.
Made for any timeframe & any market.
CVD Pro – Smart Overlay + Signals (with Persist Mode)What this Indicator Does
CVD Pro visualizes Cumulative Volume Delta (CVD) data directly on your main price chart — helping you detect real buying vs. selling pressure in real time.
Unlike most CVD scripts that run in a separate subwindow, this one overlays price-mapped CVD curves on the candles themselves for better confluence with market structure and FVG zones.
The script dynamically scales normalized CVD values to the price range and uses adaptive smoothing and deviation bands to highlight shifts in trader behavior.
It also includes automatic bullish/bearish crossover signals, displayed as on-chart labels.
⚙️ Main Features
✅ Price-mapped CVD Overlay
CVD is normalized (Z-score) and projected onto the price chart for easy visual correlation with price structure.
✅ Multi-Timeframe Presets
Three sensitivity presets optimized for different chart environments:
Strict (4H) → Best for macro trends and high-timeframe structure.
Balanced (1H / 30m) → Great for active swing setups.
Sensitive (15m) → Captures short-term intraday reversals.
✅ Dynamic Bands & Smoothing
Deviation bands visualize statistical extremes in delta pressure — helping to identify exhaustion and divergence points.
✅ Smart Buy/Sell Signal Logic
Automatic label triggers when the CVD Overlay crosses its smoothed baseline:
🟢 BULL LONG → Rising CVD above the mean (buyers in control).
🔴 BEAR SHORT → Falling CVD below the mean (sellers in control).
✅ Persist Mode
Toggle to keep the last signal visible until a new one forms — ideal for traders who prefer clean chart annotations without noise.
✅ Clean, Minimal Overlay
Everything happens directly on your chart — no extra windows, no clutter. Designed for use with Smart Money Concepts, Fair Value Gaps (FVGs), or volume imbalance setups.
🧩 Use Case
CVD Pro is designed for traders who:
Use Smart Money Concepts (SMC) or ICT-style trading
Watch for FVG reactions, breaker blocks, and liquidity sweeps
Need to confirm order flow direction or momentum strength
Trade intraday or swing setups with precision entries and clear bias confirmation
⚡ Recommended Settings
4H / 1H: Use Strict mode for major structure and confirmation.
1H / 30m: Balanced mode for clear mid-term trend alignment.
15m: Sensitive mode to catch scalps and lower-TF shifts.
🧠 Pro Tips
Combine with RSI or Market Structure Breaks (MSS) for additional confluence.
A strong CVD divergence near a key FVG or 0.5–0.705 Fibonacci zone often signals reversal.
Persistent CVD crossover + price structure break = high-probability entry.
🧩 Credits
Created by Patrick S. ("Nova Labs")
Concept inspired by professional order-flow analytics and adaptive Z-Score normalization.
Would you like me to write a shorter “public summary” paragraph (for the short description at the top of TradingView, the one-liner users see before expanding)?
It’s usually a 2–3 sentence hook like:
“Overlay-based CVD indicator that merges volume delta with price structure. Detect true buying/selling pressure using adaptive normalization, deviation bands, and clean bullish/bearish crossover signals.”

Hidden Liquidity Free🟩 Hidden Liquidity Indicator – Free Version
The Free Version of the Hidden Liquidity Indicator provides traders with a structured and precise method for detecting Breaker Blocks and Hidden Order Blocks (HOBs).
By analyzing untouched candle bodies within order blocks, it delivers a clear framework for evaluating Fair Value Gaps (FVGs) and understanding market structure with greater accuracy.
🔍 Key Features
• Detection of HOBs, PHOBs
The Free version identifies Hidden Order Blocks (HOBs), Partial Hidden Order Blocks (PHOBs) on the current timeframe and two additional timeframes, providing an efficient multi-timeframe view of market liquidity.
• Classification by Strength and Structure
• HOB (Hidden Order Block): Candle body fully contained within the FVG and untouched by wicks – considered highly reliable.
• PHOB (Partial Hidden Order Block): At least 50% of the candle body fits within the FVG – a weaker form of the HOB.
For validity, the equilibrium (EQ) of the HOB must be crossed by the FVG, ensuring accurate and meaningful structural analysis.
• Enhanced Visualization through Color Coding
• HOBs – Teal
• PHOBs – Blue
• Multi-Timeframe Capability
Detect and visualize hidden liquidity areas across up to three timeframes (current + 2 additional).
Ideal for traders seeking cross-timeframe confluence.
• Display Options
Users can choose whether to display PHOBs and PMHOBs for a cleaner or more detailed chart view.
⚙️ Summary
The Free version is perfect for traders who want to explore the fundamentals of hidden liquidity analysis.
With support for multiple timeframes, color-coded visual clarity, and the identification of untouched candle structures, this version offers a strong foundation for precise and effective market analysis.

Scalper's Dream by Chino,CHINO’S ICT MES/MNQ Strategy — FVG/BOS/OTE/PD + VWAP + SMA + BB Squeeze/Failure
Summary
Intraday ICT-inspired toolkit tuned for MES/MNQ (also effective on equities/ETFs and crypto). It blends Fair Value Gaps (FVG) — including multi-timeframe FVG (MTF FVG) with first-touch and min-gap filters — Break of Structure (BOS), Optimal Trade Entry (OTE), and Prior-Day levels with VWAP, SMA gates, 9:30 Open, Session Equilibrium (EQ), custom ORB, and Key Rejection Levels (KRL). It also includes Accumulation/Distribution phase reads and Manipulation cues (e.g., liquidity sweeps/stop-runs) to contextualize trend transitions. On top, it adds Bollinger Band squeeze breakouts & failure reversals, V/A shape reversal detectors, Volume-boosted buy/sell signals with Reversal Candle Assist, Asia/London/New York sessions, an Options Assist HUD, and a Market Internals HUD.
Disclaimer: This tool is for education and research purposes only and is not financial advice. Test thoroughly in replay/paper before live trading.
KARAMAN Swing High/LowThis Pine Script indicator detects and visualizes swing highs/lows, daily levels, and Fair Value Gaps (FVGs) with full customization:
Swing points:
Validated swings are shown as small triangles (red = high, green = low).
Optional rays extend from swing points, and a ZigZag line connects them.
Daily high/low:
Tracks daily extremes (UTC+3).
Draws right-extended rays from the previous day’s high/low.
Fair Value Gaps (FVGs):
Automatically detects bullish and bearish FVGs.
Draws boxes and three rays (top, middle, bottom).
When price touches the middle line, the box and two lines are deleted, leaving only the untouched boundary.
If price fully breaks the FVG, all elements are removed.
Settings panel:
Every element (swing candidates, valid swings, rays, ZigZag, daily levels, FVG boxes/rays) can be turned on or off.
Iani SMC Sniper XAU v2.2 (Long+Short + News Countdown, v6)Iani SMC Sniper v2.6 — Anytime • Auto Pip • FVG 50% • OB • News Panel
Smart-Money Concepts made simple for intraday XAU/USD (works on any symbol).
Finds BOS, 50% FVG “sniper” entries, optional Order Blocks, London H/L, news countdown, and a mini info panel.
What it does
BOS (Break of Structure): detects bullish/bearish BOS after London sweep logic.
FVG 50% entries: plots precise long/short entry dots at the midpoint of the gap.
Auto TP/SL: TP = RR × risk, SL below/above recent swing with a small buffer.
Order Blocks (optional): marks the last opposite candle after BOS and alerts on OB revisit.
London High/Low: tracks session range; session filter is optional.
News countdown: shows next event time and minutes left (user-selectable timezone).
Mini Panel: top-left table with Trend (last BOS), Next news, R:R, Pip size.
Inputs (key)
Auto pip size: uses syminfo.mintick. Manual override available.
Risk:Reward (RR): default 2.0.
Pivot length: swing sensitivity.
Sessions: enable if you want signals only 12:00–20:00 (symbol timezone). Off = anytime.
News timezone: pick your own (e.g., Europe/Brussels, America/New_York).
Absolute & daily times: add your events (strings like 2025-09-17 20:00 or 14:30,16:00…).
Show labels/levels/OBs: toggle on/off.
Alerts included
BOS Bullish / BOS Bearish
BUY Entry / SELL Entry (return to 50% FVG)
Bullish OB revisit / Bearish OB revisit
TP Long/Short reached, SL Long/Short hit
NEWS WARNING (warning window only; does not block signals)
To use: Add Alert → Condition: this indicator → choose any of the alertconditions.
Best use
Bias: H1 for structure.
Execution: M15 (standard) or M5 (aggressive).
Works great on XAUUSD, but is symbol-agnostic (auto pip adapts).
Notes
News times display in the timezone you pick in settings.
OBs are a simple implementation meant for quick visual guidance.
Labels: BUY/SELL near entries, TP/SL on set and when hit, BOS up/down.
Risk disclaimer
This tool is for education only. Not financial advice. Backtest and manage risk.

Rebalance Statistics|█ OVERVIEW
Rebalance statistics is an indicator that gathers relevant data on how often price "rebalances" after an expansion, allowing traders to garner insights on potential future price movements through historical analysis. Additionally, it displays these key levels on the users chart and allows for users to implement filters in order to further deepen their analysis.
█ CONCEPTS
The concept of rebalancing follows the third candle in a typical 3-candle sequence of how an "FVG" is created. Typically, an "FVG" represents the area created during the second candle of an aggressive expansive movement, where the wick of the first candle high or low doesn't overlap with the third candles' high or low, creating an opportunity where traders may expect price to react from.
Rebalancing focuses on the third candle of this sequence, where the "FVG" may be created. When the low of the third candle (in the bullish case) doesn't reach the high of the first candle, the FVG isn't rebalanced, and if it does it's considered rebalanced. This may be useful to determine when movements are likely to retrace, as found by this indicator, most of the time the third candle is likely to rebalance the expansive move.
The indicator will display these areas, including the current ratio that candle 3 rebalanced of the area, as well as the overall stats associated with rebalancing, such as the average ratio of "non-rebalanced" areas, and how often price tends to rebalance these areas.
█ FEATURES
Rebalance areas: After a candle 2 expansion, the indicator will display the current rebalance ratio and the area that has been rebalanced as well as the overall rebalance area.
Rebalance statistics: The indicator will display through a table the overall probability of a rebalance including the average ratio that the candle 3 will rebalance of the overall area.
Time filtering: Filter rebalances to occur only during a specific period of time (suggested for lower timeframes).
Candle sequence filtering: Filter rebalances by only using the cases where the first candle of the sequence is in line with the second one to determine how it affects the statistic.
█ How to use
To use the indicator, simply apply it to your chart and modify any of your desired inputs.
The indicator is setup to display statistics for rebalances based on your current timeframe, but you may also adjust the indicator to only calculate the statistic based on a certain time window in the day done in NY time (UTC-4), or by filtering the candle sequence (candle 1 of the 3 candle sequence must be in the same direction as the ones following it.

Ayman – Full Smart Suite Auto/Manual Presets + PanelIndicator Name
Ayman – Full Smart Suite (OB/BoS/Liq/FVG/Pin/ADX/HTF) + Auto/Manual Presets + Panel
This is a multi-condition trading tool for TradingView that combines advanced Smart Money Concepts (SMC) with classic technical filters.
It generates BUY/SELL signals, draws Stop Loss (SL) and Take Profit (TP1, TP2) levels, and displays a control panel with all active settings and conditions.
1. Main Features
Smart Money Concepts Filters:
Order Block (OB) Zones
Break of Structure (BoS)
Liquidity Sweeps
Fair Value Gaps (FVG)
Pin Bar patterns
ADX filter
Higher Timeframe EMA filter (HTF EMA)
Two Operating Modes:
Auto Presets: Automatically adjusts all settings (buffers, ATR multipliers, RR, etc.) based on your chart timeframe (M1/M5/M15).
Manual Mode: Fully customize all parameters yourself.
Trade Management Levels:
Stop Loss (SL)
TP1 – partial profit
TP2 – full profit
Visual Panel showing:
Current settings
Filter status
Trend direction
Last swing levels
SL/TP status
Alerts for BUY/SELL conditions
2. Entry Conditions
A BUY signal is generated when all these are true:
Trend: Price above EMA (bullish)
HTF EMA: Higher timeframe trend also bullish
ADX: Trend strength above threshold
OB: Price in a valid bullish Order Block zone
BoS: Structure break to the upside
Liquidity Sweep: Sweep of recent lows in bullish context
FVG: A bullish Fair Value Gap is present
Pin Bar: Bullish Pin Bar pattern detected (if enabled)
A SELL signal is generated when the opposite conditions are met.
3. Stop Loss & Take Profits
SL: Placed just beyond the last swing low (BUY) or swing high (SELL), with a small ATR buffer.
TP1: Partial profit target, defined as a ratio of the SL distance.
TP2: Full profit target, based on Reward:Risk ratio.
4. How to Use
Step 1 – Apply Indicator
Open TradingView
Go to your chart (recommended: XAUUSD, M1/M5 for scalping)
Add the indicator script
Step 2 – Choose Mode
AUTO Mode: Leave “Use Auto Presets” ON – parameters adapt to your timeframe.
MANUAL Mode: Turn Auto OFF and adjust all lengths, buffers, RR, and filters.
Step 3 – Filters
In the Filters On/Off section, enable/disable specific conditions (OB, BoS, Liq, FVG, Pin Bar, ADX, HTF EMA).
Step 4 – Trading the Signals
Wait for a BUY or SELL arrow to appear.
SL and TP levels will be plotted automatically.
TP1 can be used for partial close and TP2 for full exit.
Step 5 – Alerts
Set alerts via BUY Signal or SELL Signal to receive notifications.
5. Best Practices
Scalping: Use M1 or M5 with AUTO mode for gold or forex pairs.
Swing Trading: Use M15+ and adjust buffers/ATR manually.
Combine with price action confirmation before entering trades.
For higher accuracy, wait for multiple filter confirmations rather than acting on the first arrow.
6. Summary Table
Feature Purpose Can Disable?
Order Block Finds key supply/demand zones ✅
Break of Structure Detects trend continuation ✅
Liquidity Sweep Finds stop-hunt moves ✅
Fair Value Gap Confirms imbalance entries ✅
Pin Bar Price action reversal filter ✅
ADX Trend strength filter ✅
HTF EMA Higher timeframe confirmation ✅
