Abacus (CMF + Stoch. + Chop.) StrategyThis strategy combines uses Chaikin Money Flow, Stochastic Oscillator, and the Choppiness Index to determine trend strength and direction and generate entry and exit signals. This is a strategy adaptation of our earlier CMF + Stoch + Choppiness Index indicator.
Oscillatore stocastico


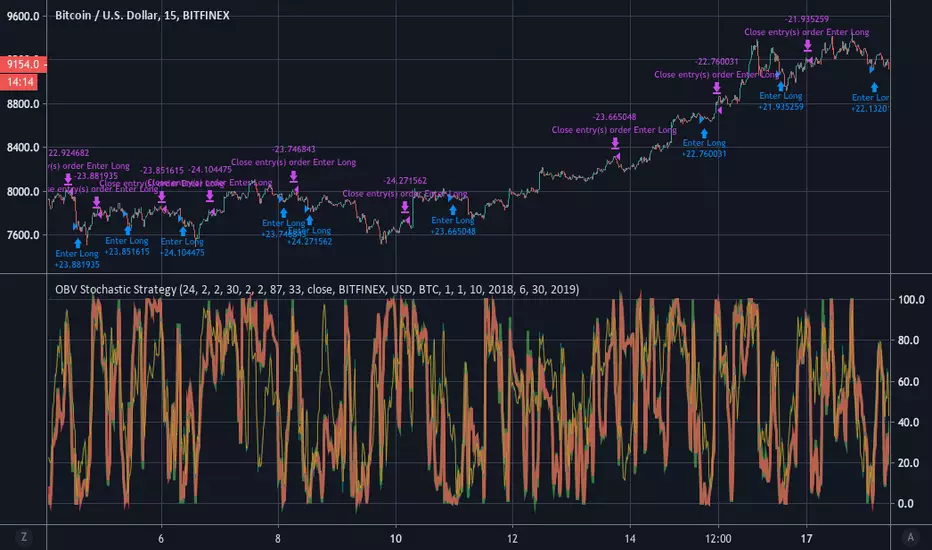
OBV StochasticsThis indicator uses both a standard Stochastic Oscillator based on security prices and stochastically oscillated OBV values.
Explanation:
Stochastics measure momentum by comparing the current closing price to its lowest and highest price over a user-defined window of n periods. Without going too in depth, traders can view the K value as the current value for the stochastic indicator and the D value as a Simple Moving Average of K values. Users can adjust the length of that Simple Moving Average through modifying the smooth D parameter in the input option menu.
Traders can also define the upper and lower bounds for both sets of K and D values. These are plotted on the graph as the horizontal red (upper) line and horizontal green (lower) line. Generally, the upper line is viewed as the threshold at which a security can be considered overBought. Conversely, the lower green line is the threshold at which they can be viewed as overSold.
OBV, or On-Balance Volume, is a versatile momentum indicator that we discussed in our OBV Z-Scores open-source script. That is a good place to look if you're looking to gain a better understanding of the OBV indicator. By applying the stochastic formula to the OBV, it allows us to gain a better understanding of the current OBV value relative to its historical data and display the OBV in a {0.100} bounded range of values.
Plotting the standard price-based Stoch. K and D in combination with the Stoch. OBV K and D can help identify divergences and track the progression and direction of trends. For example, you can see that when the two move in opposite directions or when one significantly outpaces the other, it often hints towards an impending reversal.
The Graph:
As mentioned the upper and lower overbought and oversold thresholds can be adjusted by the trader and are plotted on the graph in red and green.
The green oscillating line represents the Stoch. K of OBV values, while the red line symbolizes the OBV D values.
The teal line is the standard Stoch. K and the orange line is the standard Stoch. D.
Users have two options for background highlights. The first option is to use green highlights to show entry signals and red highlights to show exit signals. These signals are based on the criteria we have set for identifying optimal entry and exit points. This is shown in the second pane.
The second option is to plot red highlights whenever Stoch. OBV K crosses the upper bound and green highlights whenever it crosses the lower bound. This is shown in the bottom pane. NOTE: Choosing this option means that signals will not be displayed in sequential entry-exit order (instead this is a good option if traders only want to identify when the security is overbought or oversold).
Input Options:
Traders can adjust the respective smooth K and smooth D values for both the standard stoch. and OBV stoch. Additionally, the lookback window length can be adjusted as well as the upper and lower bounds(in addition to the display options shown above).
Alerts:
Indicator sends alerts when entry and exit conditions are met, as well as alerts to inform traders when overbought/oversold conditions are met. Alerts can be tailored for GunBot / other automated trading platforms upon request.
~Happy Trading~


Enhanced Commodity Channel Index(CCI) Cycle Indicator - MTFThis is a heavily modified and enhanced version of CCI Cycle and my first indicator released using Pine Script version 4.0, something I contributed to often in a small role, and will continue to do, in my free time. This indicator is highly reactive and does a magnificent job of identifying fluctuations in market cycles when they are not trending. Compared to my free "Enhanced Schaff Trend Cycle Indicator" presented above along side this indicator, CCI Cycle is superior in it's own way, but a superb companion for providing a more accurate signals analysis. I packed as much tech as I could into this indicator along with astounding color and agility, and I'm unsure if there is any room for major improvements in the near future.
Features List Includes:
I.P.O.C.S.(Initial Public Offering Clean Start) Technology - plotting from day one, minute one of IPO
Fully adjustable M.T.F. ( Multiple Time Frame ) is enable/disable capable
Enable/disable dark background for enhanced visibility
"Source" Selection
Multiple CCI Cycle adjustments
Moving average selection
Ranges and thresholds are enable/disable capable
Upper threshold adjustment
Red/green secondary range that adjusts +/- from the upper/lower thresholds
Lower threshold adjustment
Adjustable centered medial zone
Highlighting is enable/disable capable
Normalized zero mean to +/-1
This is not a freely available indicator, FYI. To witness my Pine poetry in action, properly negotiated requests for unlimited access, per indicator, may ONLY be obtained by direct contact with me using TV's "Private Chats" or by "Message" in my member name above. The comments section below is solely just for commenting and other remarks, ideas, compliments, etc... If you do have any questions or comments regarding this indicator, I will consider your inquiries, thoughts, and ideas presented below in the comments section, when time provides it. As always, "Like" it if you like it, and also return to my scripts list occasionally for additional postings. Have a profitable future everyone!

BOSS Smooth Stochastic-RSI And RSI Oscillators With Alerts THE BEST FOREX, BINARY OPTIONS, STOCK AND CRYPTO INDICATORS FOR TRADINGVIEW.COM
Our Smooth Stochastic RSI indicator and our RSI indicator all combined in one!
BACKGROUND AND BAR COLOR
Green=BULLISH
Yellow= NEUTRAL/TRANSITIONAL
Red= BEARISH
ALERTS
GET ALERTS FOR BULLISH AND BEARISH CROSSOVERS ON STOCHASTIC RSI
GET ALERTS WHEN RSI LINE IS GREEN AND RED

SMA Stochastic ForecastThis tool uses a discrete-time non-Markovian Martingale stochastic process (Please do not confuse with the strategy of the same name) under the hood to forecast a future (up to 28 bars, customizable) behaviour of the Simple Moving Average. The longer the average period, the more accurate the forecast.
The common cases are the next:
You can apply two instances of this indicator to your chart to obtain a crossover forecast
You can decrease an interval between forecasts to obtain a bunch of possible traectories
Decreasing a forecast interval for two instances, you will get the Kraken
This is the further improvement of my research work on forecasting
Mr. @syrinxflunki was the only one who provided a clear and useful feedback after testing, so he get a free lifetime access. I respect a fair play.
If you have any questions you can concat me via private messages.
Good luck.

IFT Stochastic + Trailing StopInverse fisher transform on stochastic strategy with trailing stop. Good work on flats with mid-wave length

PA Researcher MTF Stoch RSIThis is {A Researcher MTF Stoch RSI
OverSold/OverBought HighLight
Ability to Change Time-Frame

Ultra CMF + Stoch. and Choppiness IndexThis is a fairly complex, but powerful indicator that combines 3 different indicators.
1. Chaikin Money Flow (CMF)-
Oscillator that uses the sum of Money Flow Volume (MFV) values over n periods to determine and compare the amount of
buying/selling pressure. We modified the CMF's scale so that values fluctuate between {-100, 100} for easier visualization.
If (CMF > 0)
then (buying pressure > selling pressure)
If (CMF < 0)
then (buying pressure < selling pressure)
Thus, CMF can be a valuable tool for confirming both uptrends and downtrends, as well as identifying divergences as a negative CMF
value in the midst of an uptrend indicates lack of strength.
In addition, we set bounds for the CMF values to prevent whipsaws during periods of horizontal price movement.
The CMF is shown on the bottom of the chart as the teal and fuchsia histogram.
Teal bars means (CMF < 0) and fuchsia bars means (CMF > 0).
2. Choppiness Index -
The Choppiness Index is another oscillator that works synergistically with the Chaikin Money Flow to prevent entries during choppy
conditions (when there is no clear trend direction and movement is horizontal). Although it is blind to the actual direction of the
price movement, we use it to distinguish periods of consolidation from "trendy" markets. Values fluctuate between {0, 100}, with 50
acting as the center-point. We've also set thresholds for chop values that are utlized to optimize entry and exit timing.
The Choppiness Index is plotted as the green and pink circle line at the top of the chart. If movement is choppy(choppy > 50), then
circles are pink. If choppiness is low(chop < 50), then the circles are green.
3. Fast and Slow Stochastics -
Lastly, we use a fast and a slow stochastic momentum oscillator. This is a fairly common approach, as it allows us to detect signals
on a wider range of sensitivity.The slow stochastic confirms the high quantity of signals generated by the more hyper-sensitive
fast stochastic.
The fast and slow K and D values are not plotted on the graph by default, but users can change that in the inputs to choose which
ones to show on the graph(as shown in the bottom pane). The upper and lower bounds can also be chosen to increase/decrease
signal sensitivity.
All values such as lengths, bounds, etc. can be changed by users through the input options.
The Graph:
Chaikin Money Flow - Shown as the teal and pink zero-centered oscillator at the bottom of the chart. Bars are teal when CMF is less than
zero and fuchsia when CMF value is greater than 0. Users can choose whether the CMF is plotted by changing the 'plotCMF' input.
-The CMF histogram is shown in the second and third panes.
Choppiness Index - Plotted as the pink and teal line of circles at the top of the chart. Circles are pink if they are above 50 (high chop) and
teal when they are below 50 (low chop). Users can choose whether it is plotted through the 'plotChop' input.
-The Choppiness Index is shown in the second and third panes.
Stochastics - Not plotted by default, but users can choose to have them shown by adjusting the values in the input options menu. If you want,
there is an option to plot both fast and slow K and D values (4 total lines) and the upper and lower bounds that are used to determine entries
and exits.
NOTE: I tried to show all the ways that you can choose to display all the different indicators in the different panes, but there are a million
different ways you can choose to have the chart laid out through changing the inputs. You could have it be as simple as plotting just the 'B'
and 'S' for entries and exits or a complex graph with the CMF, Chop, and stochastics all plotted together.
HOW TO USE:
There is a set of conditionals for each of the three indicators to determine both entry and exit points. To simplify this, we decided to divide them
into red circles for exit conditions and green squares for entry conditions.
LONG ENTRIES:
1. If the conditions for the stochastics are met, a green square is plotted at the top of the chart.
2. If the conditions for the CMF are met, a green square is plotted at the center of the chart.
3. If the conditions for Choppiness Index are met, a blue circle is plotted at the bottom.
TRADE WHEN: There is a green square at the top, green square in the middle, and a blue circle at the bottom.
A GREEN 'B' IS PLOTTED IN THE CENTER OF THE GRAPH WHEN THE ABOVE REQUIREMENTS ARE TRUE...Enter position at that point.
LONG EXIT:
1. If the conditions for the stochastics are met, a red circle is plotted at the top of the chart.
2. If the conditions for CMF are met, a red circle is plotted at the center of the chart.
3. If the conditions for Choppiness Index are met, a blue circle is plotted the bottom.
TRADE WHEN: There is a red circle at the top, red circle in the middle, and blue circle at the bottom.
A RED 'S' IS PLOTTED AT THE CENTER OF THE GRAPH WHEN THE ABOVE REQUIREMENTS ARE TRUE....Exit Position at that point.
ALERTS:
An alert is sent when all buy conditions are met, informing the trader to enter a long position.
The same is done for sell conditions.
Like I said earlier, there are tons of input options to change this indicator to fit your specific use, as well as display options. I've tailored the settings
for trading BTC/USD, but it is a very versatile indicator and can be adapted for whatever you're trading.

Featherlite RSI - Extra SensitiveFeatherlite RSI - Extra Sensitive
This is a combined relative strength index (RSI) ans stochastic RSI indicator set to the super sensitive period of 2 candles.
I use this setting particularly on higher timeframes such as M, W, D but can also be useful on 4h. However lower timeframes, will become to noisy.
If you compare to the standard setting of 14, you can see that the pump and dump structure is a lot more washed out
The RSI builds up slowly from its low point in 2015 to a single maximum in 2017. This is great for charting the longer cycle (interyear bull / bear), but is of little help for charting the intermediate swings. However, by increasing the sensitivity we can see when the RSI is maxing out on an intermonth basis. And indeed this matches the actual high points of the previous bull runs very well.
The indicator also includes a stochastic RSI indicator also set to the same candle period.
In practice it is always good to use a range of indicators to get a feel for what is going on. This is good for intermonth cycles on M and W timeframes. For longer cycles use the standard period setting of 14.

Top and Bottom Oscillator - Quan DaoThis oscillator used to find bottoms and tops to decide when to go in and out of the market. It takes combination of price power, its direction and volume over the time into consideration.
*** Can be used on long term chart (monthly or weekly) or even short-term one like daily, hourly chart.
*** Indicator colors:
- Red: trend down
- Green: trend up
- Black: trend is on-going (either up or down), should wait for the reversal to come.
*** As a general rule of using any oscillator indicator:
- Buy when the oscillator is low and sell when oscillator is on its top.
- Be hesitate to buy when oscillator is on top just because the price is high and everyone is excited about it, as your risk is big and the reward is low.
- Always put a stop when you go in the market, as NO indicator can guarantee you 100% correct all the time.

EasyBee59 v1.0EasyBee59 v1.0 for TradingView does tedious CC59 counting for you automatically in your investment chart. It then creates respectable support and resistance levels based on CC59 counting results as well as marks and reminds you about important parameters that are happening so that you would not forget to consider them before placing trade orders. The events occur in the chart can be set to send server-side alerts to your smart phone so that you don't have to stay in front of the screen all the time.
=================================================================================================
The source code of EasyBee59 v1.0 for TradingView is protected. Only invited TradingView members can access and use this script.
Lifetime invitation to use it is for 100 USD with free future upgrades and online supports. Paypal, bank transfer and bitcoin payments are welcome.
For more informaton please contact the author (DrGraph or Nimit Chomnawang, PhD) via TradingView private chat
or in the comment field below.
=================================================================================================
How to install the script:
------------------------------
*Go to the bottom of this page and click on "Add to Favorite Scripts".
*Remove older version of the script by clicking on the "X" button behind the indicator line at the top left corner of the chart window.
*Open a new chart at and click on the "Indicators" tab.
*Click on the "Favorites" tab and choose "EasyBee59 v1.0".
*Right click anywhere on the graph, choose "Color Theme", the select "Dark".
*Right click anywhere on the graph, choose "Settings".
*In "Symbol" tab, set "Precesion" to 1/100 for stock price or 1/100000 for forex and set "Time Zone" to your local time.
*In "Status line" tab, uncheck "Indicator Arguments" and "Indicator Values".
*In "Events" tab, check "Show Dividends on Chart", "Show Splits on Chart" and "Show Earnings on Chart".
*At the bottom of settings window, click on "Template", "Save As...", then name this theme of graph setting for future call up such as "DrGraph chart setting".
*Click OK.
For free TradingView plan, you can add two more indicators to the chart. That means you may add Stoch and Vol indicators with same parameters as those setup in EasyBee59 to your graph. DrGraph regularly publishes his educational ideas on using features provided in EasyBee59 for profitable investments. You can follow him for how to use the tools in trading stocks, forex, and crypto currencies.


Stochastic + ATRStochastic oscillator with dynamic buy/sell levels. Levels calculate with volatility/averag true range. No repaint

Stochastic + ATRIt is a stochastic with dynamic buy sell levels. Levels are calculate from volatility/average true range. No repaints

Stochaholic — SharkCIAStochaholic consists of 8 stochastic oscillators with different speeds.
It has less noise and better visualization compared to a simple stochastic.
Created from Stochastic Rainbow by shayankm

Cyatophilum PSAR Bot Trader V2 [BACKTEST]A strategy built upon Parabolic Stop And Reverse.
This new version includes my whole Trend Detector / Stop Loss / Takeprofit / Trailing System.


BOSS Smooth Stochastic RSI Histogram Oscillator With Alerts THE BEST FOREX, BINARY OPTIONS, AND CRYPTO INDICATORS FOR TRADINGVIEW.COM
Our smooth stochastic rsi in column form with buy and sell alerts.
