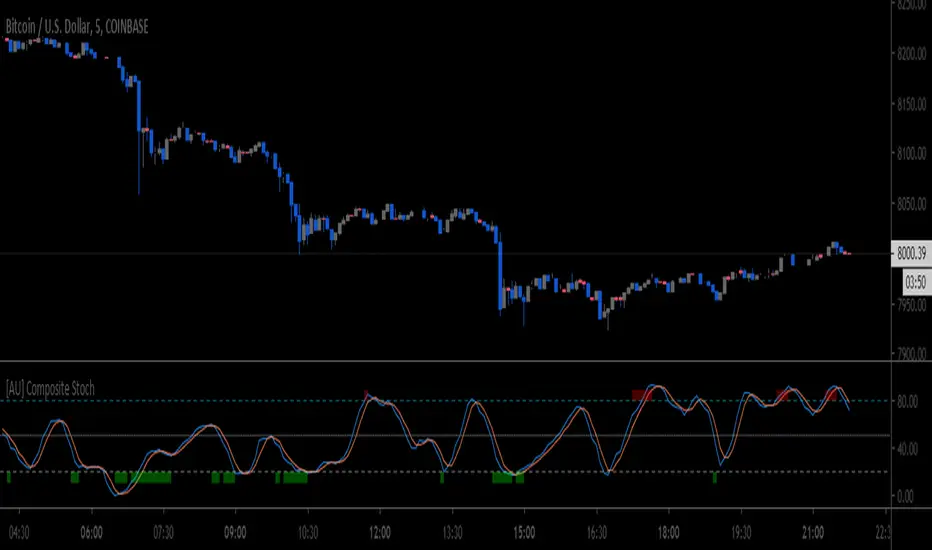
Oscillatore stocastico

TympanumTrioI started from scratch and borrowed nothing from any source, so its completely unique. Named TypanumTrio, it will evolve into a trend-detector, chop-detector, & volatility detector. Currently its only a trend-detector. Its not a full strategy, rather is an eviron-detection module which will become part of other IMQ strategies, such as Alduin. Tympanum is the hearing organ of dragons & dinosaurs. The trio of companions to Alduin are: Dimetrodon, Spinosaurus, & Ludodactylus. Each of these ancient monsters have either a crest or a sail; Personally I imagine they are sense organs. But they remind me of the crests & sails of the crypto histogram, so I've colorized this first pterodactyl histogram prehistoric hues of green & orange.


HARA BB on Stochastic / CCI coded OBVThis indicator contains
- 1 Bollinger Bands based on a Stochastic / CCI coded OBV
- 1 Fibonacci Bollinger Bands based on the Stochastic / CCI coded OBV
Composed by HARA


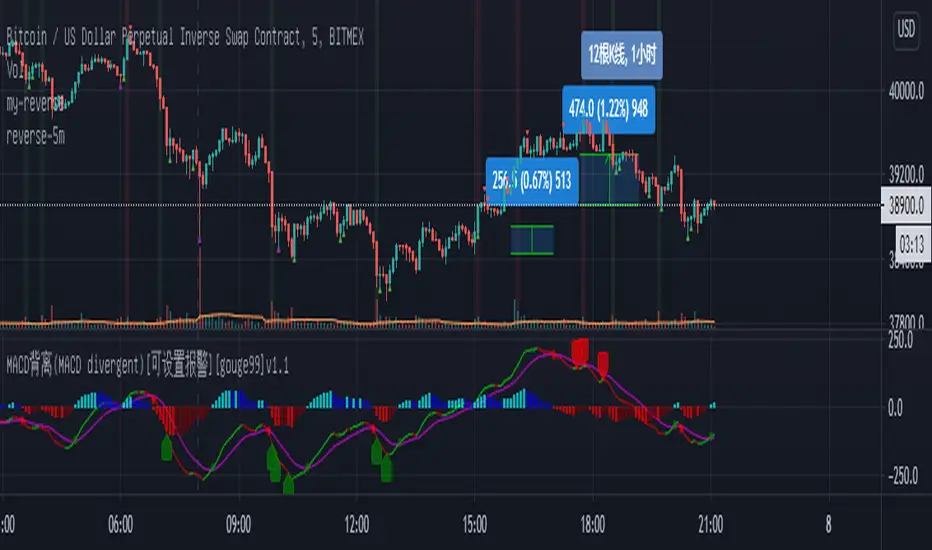
MACD背离(MACD divergent)[公开版][gouge99]注意:背离意味着做反转交易,所以入场要求很高,但是背离一般的收益风险比很大
MACD背离:收盘价创造新高或者新低,但是macd却没有出新高或者新低
计算原理:根据历史K线长度(默认90根K线)来判断收盘价的高低极值和macd的高低极值来进行比较判断
建议使用:
1.在震荡调整行情中,在支撑和压力位附近出现的突然的趋势K线,一般是假突破
2.在趋势末端,一般还会有一次缓慢的测试趋势极点的行情,一般这是趋势反转进入震荡的开始
3.结合其他形态如双顶,头肩,pin bar
4.结合其他指标如stoch随机指标做反转
5.推荐在1h, 30m, 15m级别中使用,5m也可以使用,但是最好背离计算长度设置大一点 比如150

Stoch + Stoch RSI [R1984]Simple comparison of stochastic based on price versus stochastic based on RSI.
Plan to add more features later like divergence indications, light/dark mode toggle, etc.

Hara's Favorit Stochastic 2BBs by Theo ParkThis indicator include :
- Stochastic
- Bollinger Bands of Stochastic
- Fibonacci based Bollinger Bands of Stochastic
with fill background color options for each BB. (upper and lower)

Triple Stochastic3 stochastic K-lines with short, medium & long periods & the D-lines removed.
Provides a good indication of where you are in the current supply/demand cycle & I find it helpful for timing entries.
Look for peaks & valleys formed by 2 or 3 lines, & entry would be when they start to turn around.
Try it on multiple timeframes & of course use confluence with other indicators & data.

Stochastic Strategy of BiznesFilosofThis strategy allows you to test the stochastic indicator, as well as adjust it to a specific trading pair. The parameters indicated in the books are too approximate and have nothing to do with modern reality. The optimal parameters for Bitcoin are now set. You can customize better for yourself. This strategy allows you to make settings.
===
Эта стратегия позволяет протестировать индикатор стохастик, а также настроить его на конкретную торговую пару. Параметры, указанные в книжках слишком приблизительные и не имеют ничего общего с современной реальностью. Сейчас установлены оптимальные параметры для биткоина. Вы же можете настроить лучше под себя. Это стратегия позволяет сделать в настройках.

yutas_RSI_Stochastic_BBver .1.0
Produce a combined signature of RSI, Stochastic and BB.
MTF compatible.
With alert function.
-----------------------------------------------------------------
RSIとStochasticとBBの複合サインを出します。
MTF対応。
アラート機能付き。
-----------------------------------------------------------------

Stoch + Stoch BB + Stoch BB with Fibnacci sequence by Theo ParkThis indicator contains :
- 1 Stochastic
- 1 Stochastic Bollinger Bands
the source of the Bollinger Bands is the %K of the Stochastic obove
- 1 Fibonacci Bollinger Bands
Stochastic Bollinger Bands with Fibonacci sequence like
0.236, 0.382, 0.5, 0.618, 0.764, 1..
Helios v1.0 - by @cryptomrdavis -1.0
This is another indicator for you guys. From different indicators its get the signals and combines them into one.
Green marks an uptrend and red an downtrend.
Happy trading
+++ use this tool on your own risk. i'm not responsible for your loses. DYOR +++
____________________________________________________________________________
BTC: 1GVRDK3HHr9CKM5SF2CGpCNXFuavB3L4j9
ETH: 0x7b825fa752b9926D3E8397cDb1d9E5473D074646
XMR: 41zL2SQS7zyZmwXKng2TeUWsMi5vMmkgSdDCjULUTvM6ichwm1E2ZDEYGt56zk9ghoM9bekhjycSwa8amtTcB2JiUet5jtg
NEO: AXja5xPDhczfm2ujHyBfpkQAAnMsXsazmb
TRX: THi1L1v2wHJxmQg6Wk9TgkKLcP6x2oMAwf
ZEC: zcZzFkRx95cp7MtuW8wLhC5zz5RYF9QkT2uPPmhZZHc6ppXepHGgCSeAS1rtD6WFdqsM5p1gZm2gfirnrnviucsdP4aCpqU
XLM: GAXUQJSW55C7MAC4GI26NZUGIKSHFDVFRFKZCXPLMPY4HCADSDT55XK6
WAVES: 3PCMkNpMHxSraTCkwV1ENcBKa9sXbVCGjQX
BCH: qz57n04ud6mn42u00aymqkku8tfh0lk4jv9c28mjvv
tippin.me
____________________________________________________________________________

StochastiXMy indicator is probably the most accurate indicator you can use today to make the most profitable trades. It will be open to the public for a limited time only so enjoy it while it is there. Come DM me if you want exactly how to use it. Tips and donations are welcome! I hope you have fun with it ;)

4 Stochastic + RSI + Stochastic RSI by Theo ParkThis indicator contains :
4 stochastics
1 RSI
1 Stochastic RSI


