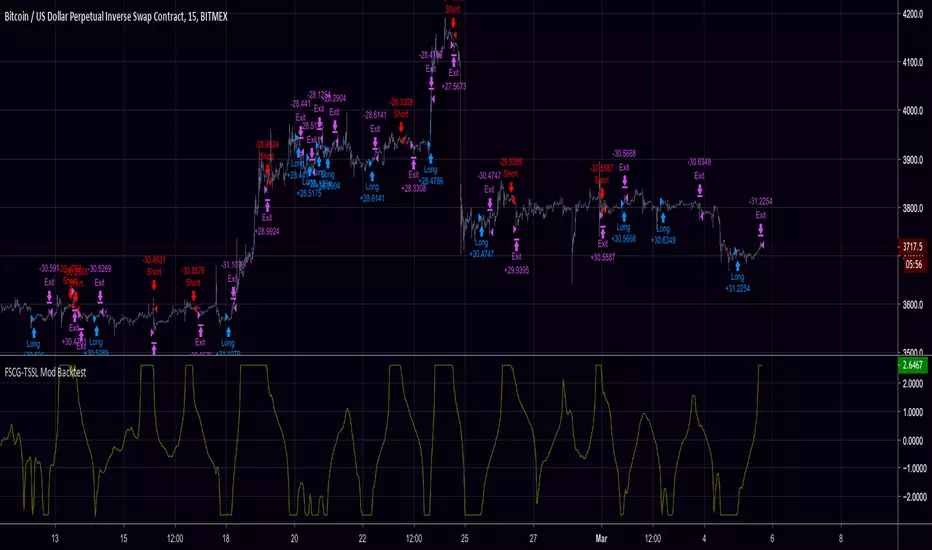
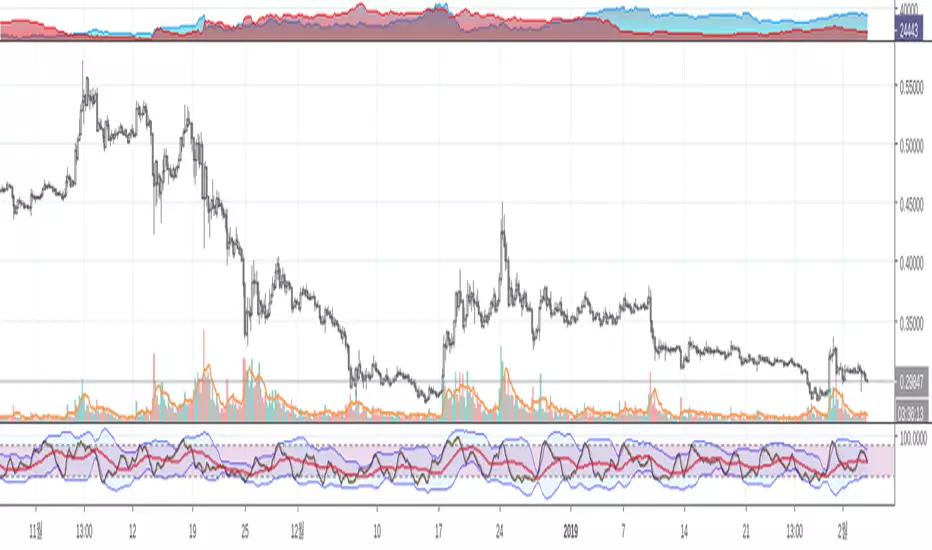
FSCG-TSSLA modification of dasanc's "Fisher Stochastic Center of Gravity"
Added:
- Thresholds for Buy/Sell Signals
- Trailing Stop / Stop Loss
- Backtest Range
Support the open-source community.
Screw you people selling open-source scripts to newbies.
Tip Jar: 3KNZq8mE24MuBmpDJVF31bBy8zc9beDiZo
Contact me for collaborations and let's take things to the next level!
Do NOT contact me for alert scripts or paid-custom work, I don't work for clients.
Oscillatore stocastico
Stuffed Oscillators/てんこ盛りオシレーターStuffed Oscillators
You can use Stochastic RSI, Stochastic, RSI at once.
てんこ盛りオシレーター
ストキャスティクスRSI, ストキャスティクス, RSIをいっぺんに使えます。

Fisher Stochastic Center of GravityWhat happens when you take the Fisher Transform of a Stochastic Oscillator?
Well, you filter out all the stuff you don't want and are left with super-precise entries!
This indicator works especially well in with a trend-follower in a higher timeframe - iTrend, MAMA, Hull, etc...
How to trade:
Use with another indicator to tell you the current trend.
Take buy and sell signals as you would with the Stoch.
-DasanC


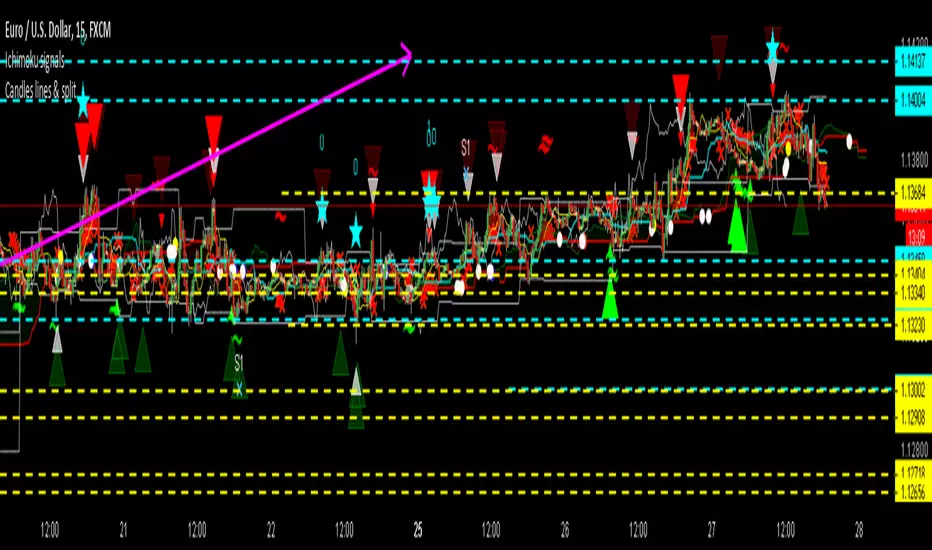
Candles lines & splitTrigger alerts when candle pattern are detected.
More conditions are shown : if previous ichimoku levels are touched, if divergence is being raised.

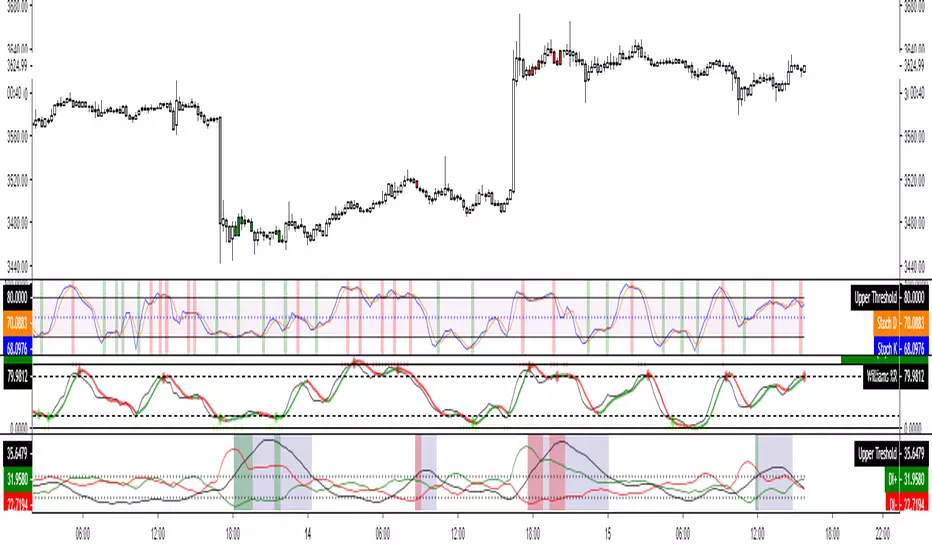
Modern Advance Stochastic (Hybrid BBMAS)This is a combination of three Stochastics (35, 65 and 100). Each has equal smoothing.
Powerzone: 5-20% and 95-100%
The centre line at 50% is a confirmation trend.

Godmode StochasticGodmode Stochastic oscillator that can be used as alternative to Stoch RSI, since imho it better tracks price movements.

IFTSTOCH + RSI 1.0IFTSTOCH Strategy with 50% exits and full stops.
This strategy was developed for a backtest-rookies services customer. I has been published only for testing and acceptance. Access cannot be granted to anyone else sorry!
Other open source scripts are available on the Backtest Rookies profile.

Multi-Stochasticstochastic 1= (5,3,2)
stochastic 2= (14,7,3)
zone 1= 80-20
zone 2= 70-30
zone 3= 55-45
every things is editable,
enjoy...

Rsi and Stochastic 2 in 1The title says it all.
The indicators contains a button that let's you switch between the two popular indicators.

Momentum Oscillators [CP]This is collection of 3 Momentum Oscillators:
*RSI
*Stochastic
*SRSI
You can filter each one with the following options:
*SMA
*EMA
*Hull MA
*Linear Regression
*Laguerre
*SuperSmoother
*SuperSmoother

Lysergik's Stochastic SynergyThis indicator shows the average Stochastic RSI output of the 15m, 1h, 2h, 4h, and Daily Stochastic RSI. It will change in its behavior depending on the time-frame you're using, but for many markets it works best on the 30m time-frame and the daily time-frame.
It is best used along with Lysergik's Fib Cross, which will allow you to avoid false signals in the stochastic synergy indicator. If your MA cross (50, 200) indicates a direction change opposite of the stochastic RSI synergy indicator then that is a signal to wait for more price action to determine your entry/exit points.
Using the Lysergik's Fib Cross, the same applies, but remember that a golden cross (white cross symbol) followed directly by a golden ratio cross (gold cross symbol) is even further indication that the stochastic RSI needs more breathing room before reversing.
This indicator is fully adjustable for you to back-test against charts and refine the indicator to your market.
The inputs in respective order are as follows:
RSI Length, Stoch Length, Smooth K, Smooth D, Upper Limit, Lower Limit, Basis
Enjoy and remember only make trades on your own terms.
Happy trading/investing! :)

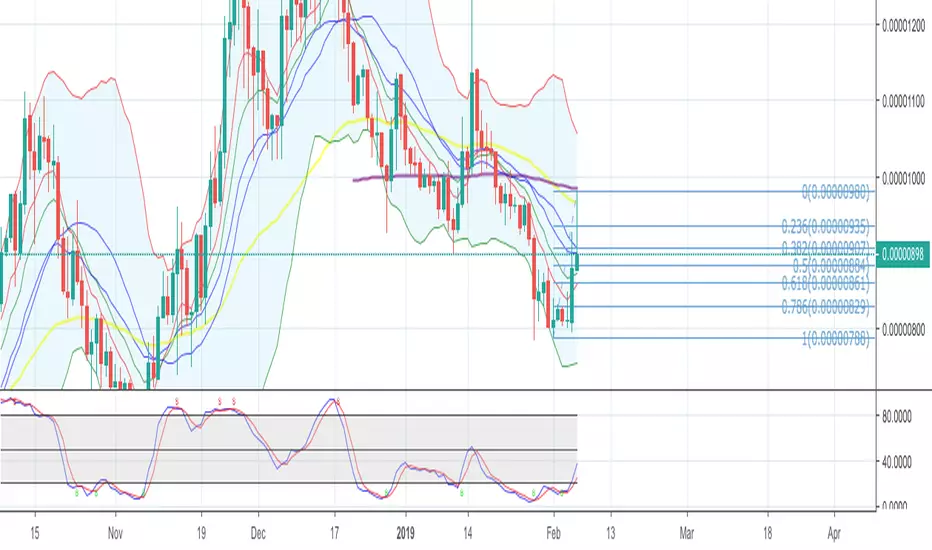
STOCHASTIC-RSI / RSI AREASAn easy Stochastic-RSI and RSI combined to show oversold and overbought areas.

Stochastic RSI Threads by SpiralmanTook a Spuds Stochastic Threads idea code by Chris Moody and redone into sRSI version.
More on the subject you can read here www.forexfactory.com


RSI and Stoch RSI Midline Crossover ArrowsPuts arrows on chart when RSI crosses over 52 and also when Stoch RSI crosses up 52 based on Warsnop strategy.

RSI + Stochastic RSI Indicator CombinedFree to use RSI and Stochastic RSI, combined within one indicator.
The RSI and Stochastic RSI are two of the most commonly used and respected indicators in trading technical analysis. By placing them on top of each other you can save valuable space on your chart and stay more easily within your TradingView indicator limit.
The RSI is bright blue, with the "neutral" 30-70 chart area shaded blue.
The Stoch RSI is red and blue, with the "neutral" 20-80 chart area shaded purple.
None of the other annotations shown above will appear, they are only to demonstrate how they can be interpreted.
So what does the RSI do?
Broadly speaking, the Relative Strength Index measures the strength and movements of a market.
Above 70 the RSI is considered oversold = an increased likelihood of an incoming price drop.
Below 30 the RSI is considered undersold = an increased likelihood of an incoming price rise.
What does the Stochastic RSI do?
Broadly speaking, the Stochastic RSI measures the momentum of a market. It does this by measuring the RSI relative to its own high/low over the previous period.
Above 80 the Stoch RSI is considered oversold = an increased likelihood of an incoming price drop.
Below 20 the Stoch RSI is considered undersold = an increased likelihood of an incoming price rise.
Look for when the two Stoch RSI lines cross over - it is an important signal.
When the blue line is on top we have momentum driving the price up; when the red line is on top we have momentum driving the price down.
The key here is to look for periods where both the RSI and Stoch RSI are both low at the same time (especially on the daily chart) = an extremely promising entry point to catch a move up. Equally, looking for periods where both the RSI and Stoch RSI are very high is likely a good exit point (or at least a time to make absolutely certain you have a suitable stop-loss in place), because a price drop is likely not far away.
Remember: the Stoch RSI does not always fluctuate cleanly between the top and bottom. At any time it can change direction to reflect market conditions, which is why a stop loss is essential at all times. Equally, just because the RSI or Stoch RSI is at 100, it is still possible for it to keep going up due to whale action or traders FOMOing in. The same applies at low levels. Both these indicators represent historical data and therefore are not strictly predictive in nature, but show trends that may be in action.
Please give me a thumbs up and follow me if you found this useful. This tool is for educational purposes only and not a recommendation to buy or sell. Always do your own research before trading. Make sure to add this to your favourite scripts.
Best wishes,
BCryptological
ps - combine this powerful indicator with knowledge of strong support and resistance points with the 50/100/200 Moving Average . This will help you identify likely entry/exit points to maximise the accuracy of your predictions.

3 Oscillator (RSI + Stochastics + MFI) with over bought/soldThis is a combined oscillator indicator which includes:
Relative Strength Index ( RSI )
Money Flow Index ( MFI )
Stochastic or StochasticRSI
In addition there are some advanced features including:
Custom time frame (Have the indicator running 5 minute candles while on a 1 hour chart)
Highlight Overbought/Oversold (The intensity of highlight changes when it is 5% below the threshold to 5% above the threshold)
Moving average trend for highlights (This will prevent the threshold-5 highlight from showing in a uptrend to reduce false signals)
It is important to know that the highlight feature is not designed as a buy/sell signal, it is only there as and oversold/overbought indicator to suggest when a trend change may be approaching.
The highlights are dependent on all three oscillators being above or below their thresholds respectively, this is to provide confluence that the market is indeed oversold and not just a single indicator.

Maleta Stochastic JRNuevo indicador de de la estrategia Maleta (by Jonathan Nuñez ). Solo puse linea horizontal del 50 y aumenté el grosor de las lineas. Gracias.

(C)RSI, (Ehler's) Stoch, (Ehler's) SRSIA collection of the following indicators:
*Connor's RSI
*RSI
*Stoch
*Stoch by Ehler
*Stoch RSI
*Stoch RSI by Ehler
The last four have long and short conditions and there are plenty of options to change the indicators to the ticker and timeframe.