Technical Analysis and Outlook:
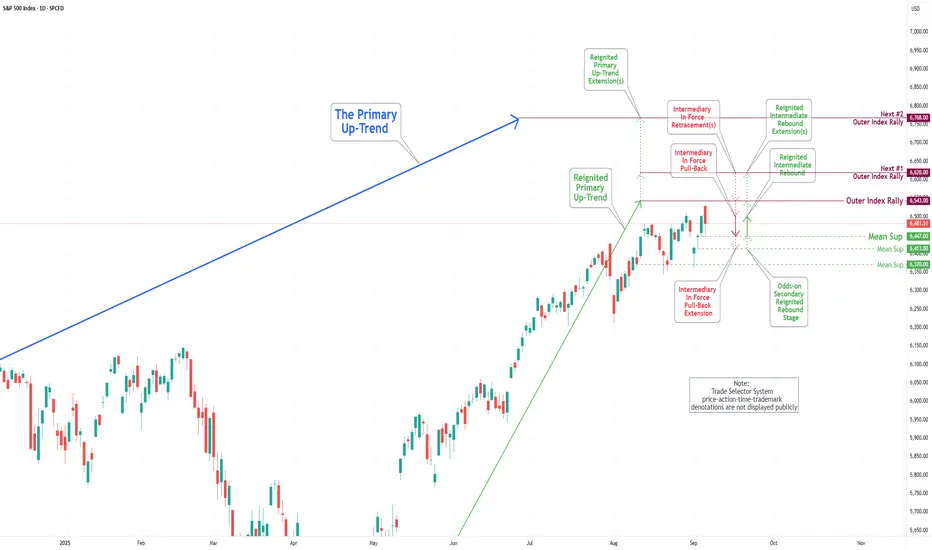
During the trading sessions of the previous week, the S&P 500 Index exhibited a notable downward movement, reaching the Intermediary In Force Pullback Extension of 6370. An Odds-on Secondary Rebound subsequently followed this decline, as the index restored its upward trajectory by achieving the Mean Resistance level of 6502, although it subsequently settled below this benchmark.
It is essential to acknowledge that the current rebound from the Mean Support level of 6447 suggests a significant probability of a sustained upward movement toward the long-term objective, namely the Outer Index Rally at 6543, as detailed in the prior S&P 500 Daily Chart Analysis. Conversely, one must consider the potential for a substantial pullback to the Mean Support extension level of 6413, which would likely precede another rebound.
Moreover, it is critical to recognize that the ongoing price fluctuations may induce a considerable pullback after the fulfillment of the Outer Index Rally target at 6543. Following this anticipated downward adjustment, the index will likely resume its upward trend, targeting the completion of the Outer Index Rally at 6420.
Pubblicazioni correlate
Declinazione di responsabilità
Le informazioni ed i contenuti pubblicati non costituiscono in alcun modo una sollecitazione ad investire o ad operare nei mercati finanziari. Non sono inoltre fornite o supportate da TradingView. Maggiori dettagli nelle Condizioni d'uso.
Pubblicazioni correlate
Declinazione di responsabilità
Le informazioni ed i contenuti pubblicati non costituiscono in alcun modo una sollecitazione ad investire o ad operare nei mercati finanziari. Non sono inoltre fornite o supportate da TradingView. Maggiori dettagli nelle Condizioni d'uso.