Volume ClusterVolume Cluster aggregates one-minute-based volume information over a specified arbitrary price range as a cluster. In delta mode, the accumulated volume is displayed based on the buy volume/sell volume information.
Forex

Divergence Indicator Screener [Trading Solutions]It's been a while since the last publication on the platform. We've been studying the charts and developing some interesting strategies and indicators, so we'll be posting some ideas in the near future.
Overview
This indicator allows you to find divergences between the price action and the classic RSI. It has the ability to anticipate trend changes.
Highs and Lows are determined using Pivot Points, wich can be adjusted in settings.
You can use this indicator to find two kind of divergences, Regular and Hidden:
Regular is when price makes a higher high, but the RSI makes a lower high
Hidden is when price makes a lower high, but the RSI makes a higher high
The opposite case for Bearish Divergence
The most important functionality of this indicator is that we can be alerted when a divergence occurs in different trading pairs, without the necessity of checking different charts at the same time, and seize opportunities offered by the market. You only have to go to Alerts Tab , click on Create Alert , select Divergence Indicator Screener and wait for the Notification in your favorite device.
You can choose any ticker to be plotted on chart and even add a new one.
Settings
To get everything started with this indicator, here are the different inputs:
RSI Settings: Period y Source
Pivot Point: Left and Right lookback bars
Filter Divergences: Regular and Hidden and max and min distance from the pivot points to consider a valid divergence
Draw table and Filter how much bars to look for a divergence in the past and plot it in the table: The fewer bars, less divergences shown
We hope you can take the most of this tool, and helps improve your day to day trading. Feel free to comment and make suggestions. We will be updating soon

Forex Strength IndicatorThis indicator will display the strength of 8 currencies, EUR, AUD, NZD, JPY, USD, GBP, CHF, and CAD. Each line will represent each currency. Alongside that, Fibonacci levels will be plotted based on a standard deviation from linear regression, with customizable lengths.
For more steady Fibonacci levels, use higher lengths for both Standard Deviations and Linear Regression. All currency lines come from moving averages with options like EMA, SMA, WMA, RMA, HMA, SWMA, and Linear Regression.
When lines of the active pair are far from each other, it means higher divergence in those currency strengths among the other pairs. The closer the lines are, the lower the divergence.
You can use the Fibonacci levels as points for the reversal or end of the current trend. When the lines cross can be used as a parameter for a more accurate signal of the next movement.
All 28 pairs are loaded from the same time frame and will use the same moving average for all of them
Alerts from the line crossing are available.

FOREX MASTER PATTERN Companion ToolWhat This Indicator Does
The Forex Master Pattern uses candlesticks, which provide more information than line, OHLC or area charts. For this reason, candlestick patterns are a useful tool for gauging price movements on all time frames. While there are many candlestick patterns, there is one which is particularly useful...
The Engulfing Pattern
An engulfing pattern provides an excellent trading opportunity because it can be easily spotted and the price action indicates a strong and immediate change in direction. In a downtrend, an up candle real body will completely engulf the prior down candle real body (bullish engulfing). In an uptrend a down candle real body will completely engulf the prior up candle real body (bearish engulfing).
Used in conjunction with the FOREX Master Pattern value line, the Engulfing Pattern can assist the trader with reversal timing or trend confirmation during the expansion and trend phases.
As shown in the screenshot below. Engulfing Candles usually precede a sharp move in price in the direction of the engulfing candle.
As shown in the screenshot below, when the Show Lines option is ON while using the indicator, both red and green lines are drawn on the chart automatically when engulfing candles form. These lines are projected forward 100 bars and tend to be reliable support and resistance areas. These areas are typically hidden from view.
In addition to the Show Lines option, the indicator (by default) creates boxes around trading zones that are created when an engulfing candle is formed. (There is an option to hide these from view if desired).
As seen in the screenshot below, these areas / zones are wider than a line and encompass a resistance / support zone rather than a specific price. Liquidity is usually high in these areas and a lot of selling / buying occurs here. These zones are drawn in advance out into the future giving the trader an idea of where price will revert to eventually.
A combination of LINES and AREAS can be used giving the user a better idea of where within the zone price will go.
As seen on the screenshot below, this combination provides a pretty accurate indication of the reversal point well in advance.
As seen in the screenshot below, when a ZONE / AREA has been fully breached (crossed) by price, the area is deactivated an no longer continues forward on the chart. Until price breaches an area, it remains valid and continues on the chart until and only if it is breached by price.
The Indicator is fully customizable.
The use can change the color of the engulfing candles, the color of the zones, transparency etc. You can turn OFF or ON any of the features such as lines, zones, bar coloring, and plotted arrows.
I really hope you get value from this indicator and... HAPPY TRADING!!

Forex Lot Size CalculatorI grew very tired of opening a Forex Calculator Website in the moment I wanted to enter a trade copying and pasting the values as fast as I can to make sure my trade is the correct size like a responsible trader before I hit the buy button :') SO I put together this indicator tool to make the process faster and just better for myself. I have been using it for a bit and I have found it very helpful in my own process so I thought I should share it with the TV community.
The indicator does as it's title suggest. Simply add it to your chart follow to two prompts...Step one select your entry price. Step two select your stop loss price. The indicator will then load the position box for your trade. In the settings you can set your account balance, Risk % per trade and your risk to reward ratio. You also have the option to change the account base currency, the indicator will calculate the lots required to reflect the base currency that you have selected.
Things to note: This calculator is intended to give you a quick idea of an appropriate lot size for your desired trade there are many different factors that many influence the results of the calculations. Please take the time to review the results before entering your trades this tool is intend to add in your process; calculations are not guaranteed. The tool is for the Forex Market obviously.
For the most efficient way to deploy this tool I've found keeping it in my favorites section of my indictors is the best way to use it. I add it to the chart sets my points read the lots then remove it from the chart. You can modify the settings for the entry and stop each time and just leave the indictor on the chart however if you trade many pairs it becomes more tedious to type in manually the new price levels each time. It is far more simpler and fast to grab the tool out of the favs tab click the two points and read the result. Just remember to save your account settings ie: Balance, Risk, Base currency, etc...as the default settings of the indicator so everything is set up when you want to use it( You can save your settings at the bottom of the settings tab). I truly hope this tool helps your process. God bless and happy trading.

Cosmic Channel LiteCosmic Channel Lite ( CC Lite) draws dynamic non-repainting trendlines and helps
⭐ know when a breakout is about to begin
⭐ predict the position and timing of the next swing reversal
⭐ predict sudden changes in volatility
⭐ recognize whether the price is in bearish or bullish territory
👀 HOW IT WORKS
Cosmic Channel Lite draws a dynamic channel consisting of a support line, basis line and resistance line. These are calculated by applying the Reduced Median Method to groups of moving averages of different type over several periods each, effectively taking 20 data points and reducing them to 3. In between, 6 internal levels are left to give context inside the channel with stable levels, the extremes of which help highlight the SR lines (see chart). The basis line color is determined by its smoothed angle with positive angles in green and negative in purple. The aim of this indicator is to provide a consistent and generic price context that works out-of-the-box and accordingly the settings have been stripped to the bare minimum with no need to continually adjust them.
📗 HOW TO USE IT
The Cosmic Channel Lite plots are meant to be used as a guide for entering and exiting positions and setting stop-loss and take profit levels. The indicator is deemed effective for any particular timeframe as long as the price stays within the maximum bounds of the indicator's plots. For this reason it is recommended to use Cosmic Channel Lite in a multi-chart layout where each chart has a different timeframe. The 5 primary strategies are:
long when the price reverses off of the support line and short when the price reverses off of the resistance line
long when the support line is highlighted and short when the resistance line is highlighted
long when the price breaks above the resistance line and short when the price breaks below the support line
long when the price moves above the basis line after being below it for a prolonged period and visa-versa (short when the price moves below the basis line)
long/short in the direction the price takes after a stable level ends
🔔 SMART ALERTS
Get notified at the most critical times by settings just one alert. Simply select CC Lite and Any alert() function call as the conditions when creating an alert and you will be tipped-off on bar-close as follows:
R─ (resistance line is highlighted)
S─ (support line is highlighted)
For example, an alert such as CC Lite 6h R─ would mean that during the last 6-hour bar the resistance line has been highlighted. The highlight lasts at least 15 bars from the first highlight bar regardless of price action.
Macro Score - DFMA-BasedA "macro score", as defined here, is created by giving various weights to different signals and adding them together to get one smooth score. Positive or negative values are assigned to each of the signals depending on if the statement is true or false (e.g. DPO > 0: +1, DPO < 0: -1). This manner of strategy allows for a subset of the available signals to be present at one time as opposed to every technical signal having to be active in order for a long/short signal to trigger.
The DFMA - Democratic Fibonacci Moving Average - is a separate indicator that we have released that takes 10 different Fibonacci MAs (lengths of 3 to 233, at Fibonacci intervals) and averages them to form the DFMA line. This helps by creating a consensus on the trend based on moving averages alone. Crossovers of the DFMA with the various Fib MA lengths as well as a cross of the price source and these lines can provide adequate long and short signals.
This strategy has the signals and weights pre-determined in the code. Heaviest weights have been given to crosses of the DFMA line/Fib MA (233) as well as the crosses of the Fib MA (3)/DFMA. Additionally, there are thresholds for DPO ( Detrended Price Oscillator , above or below 0), CMO ( Chande Momentum Oscillator , above or below 0), Jurik Volatility Bands (above or below 0), and Stoch RSI (above or below 50). These foursignals hold a lighter weight than the MA cross signals.
The macro score itself is printed in an underlay as a white line that goes between -10 and 10 for this strategy. In addition to the macro score line, a blue momentum line (sourced by the macro score itself) has been included. A crossover/crossunder of the macro score and the macro momentum line is included into the long/short signal syntax in addition to a threshold for the macro score (-5/5).
Take profit, stop loss, and trailing percentages are also included, found at the bottom of the Input tab under “TT and TTP” as well as “Stop Loss”. Make sure to understand the TP/SL ratio that you desire before use, as the desired hit rate/profitability percentage will be affected accordingly. This strategy does NOT guarantee future returns. Apply caution in trading regardless of discretionary or algorithmic. Understand the concepts of risk/reward and the intricacies of each strategy choice before utilizing them in your personal trading.
Profitview Settings:
If you wish to utilize Profitview’s automation system, find the included “Profitview Settings” under the Input tab of the strategy settings menu. If not, skip this section entirely as it can be left blank. Options will be “OPEN LONG TITLE”, “OPEN SHORT TITLE”, “CLOSE LONG TITLE”, and “CLOSE SHORT TITLE”. If you wished to trade SOL, for example, you would put “SOL LONG”, “SOL SHORT”, “SOL CLOSE LONG”, and “SOL CLOSE SHORT” in these areas. Within your Profitview extension, ensure that your Alerts all match these titles. To set an alert for use with Profitview, go to the “Alerts” tab in TradingView, then create an alert. Make sure that your desired asset and timeframe are currently displayed on your screen when creating the alert. Under the “Condition” option of the alert, select the strategy, then select the expiration time. If using TradingView Premium, this can be open-ended. Otherwise, select your desired expiration time and date. This can be updated whenever desired to ensure the strategy does not expire. Under “Alert actions”, nothing necessarily needs to be selected unless so desired. Leave the “Alert name” option empty. For the “Message”, delete the generated message and replace it with {{strategy.order.alert_message}} and nothing else.
Default Properties, for AVAX 20M:
DPO - 40, uncentered
CMO - 25, open
K/D - 3/3
RSI Stoch Length - 3
Stoch Length - 4
Stoch Source - open
JVB Length - 25
JVB Smoothing - 2
DFMA source - close
Macro Length - 13
TP % - 1.5%
TTP % - 0.005%
SL % - 2%

MACD + RSI + ADX Strategy (ChatGPT-powered) by TradeSmartThis is a trading strategy made by TradeSmart, using the recommendations given by ChatGPT . As an experiment, we asked ChatGPT on which indicators are the most popular for trading. We used all of the recommendations given, and added more. We ended up with a strategy that performs surprisingly well on many crypto and forex assets. See below for exact details on what logic was implemented and how you can change the parameters of the strategy.
The strategy is a Christmas special , this is how we would like to thank the support of our followers.
The strategy has performed well on Forex, tested on 43 1-hour pairs and turned a profit in 21 cases. Also it has been tested on 51 crypto pairs using the 1-hour timeframe, and turned a profit in 45 cases with a Profit Factor over 1.4 in the top-5 cases. Tests were conducted without commission or slippage, unlike the presented result which uses 0.01% commission and 5 tick slippage.
Some of the top performers were:
SNXUSDT
SOLUSDT
CAKEUSDT
LINKUSDT
EGLDUSDT
GBPJPY
TRYJPY
USDJPY
The strategy was implemented using the following logic:
Entry strategy:
Long entry:
Price should be above the Simple Moving Average (SMA)
There should be a cross up on the MACD (indicated by the color switch on the histogram, red to green)
RSI should be above the 50 level
Volume is above the selected volume-based Exponential Moving Average (EMA)
ADX should also agree to this position: below 50 and over 20, and above the Regularized Moving Average (REMA)
Short entry:
Price should be under the Simple Moving Average (SMA)
There should be a cross down on the MACD (indicated by the color switch on the histogram, red to green)
RSI should be below the 50 level
Volume is above the selected volume-based Exponential Moving Average (EMA)
ADX should also agree to this position: below 50 and over 20, and above the Regularized Moving Average (REMA)
Exit strategy:
Stop Loss will be placed based on ATR value (with 1.5 Risk)
Take profit level will be placed with a 2.5 Risk/Reward Ratio
Open positions will be closed early based on the Squeeze Momentum (Long: change to red, Short: change to green)
NOTE! : The position sizes used in the example is with 'Risk Percentage (current)', according which the position size will be determined such
that the potential loss is equal to % of the current available capital. This means that in most of the cases, the positions are calculated using leverage.
Parameters of every indicator used in the strategy can be tuned in the strategy settings as follows:
Plot settings:
Plot Signals: true by default, Show all Long and Short signals on the signal candle
Allow early TP/SL plots: false by default, Checking this option will result in the TP and SL lines to be plotted also on the signal candle rather than just the entry candle. Consider this only when manual trading, since backtest entries does not happen on the signal candle.
Entry Signal:
Fast Length: 12 by default
Slow Length: 26 by default
Source: hlcc4 by default
Signal Smoothing: 9 by default
Oscillator MA Type: EMA by default
Signal Line MA Type: EMA by default
Exit Strategy:
ATR Based Stop Loss: true by default
ATR Length (of the SL): 14 by default
ATR Smoothing (of the SL): EMA by default
Candle Low/High Based Stop Loss: false by default, recent lowest or highest point (depending on long/short position) will be used to calculate stop loss value. Set 'Base Risk Multiplier' to 1 if you would like to use the calculated value as is. Setting it to a different value will count as an additional multiplier. Please select only one active stop loss. Default value (if nothing or multiple stop losses are selected) is the 'ATR Based Stop Loss'.
Candle Lookback (of the SL): 10 by default
Base Risk Multiplier: 1.5 by default, the stop loss will be placed at this risk level (meaning in case of ATR SL that the ATR value will be multiplied by this factor and the SL will be placed that value away from the entry level)
Risk to Reward Ratio: 2.5 by default, the take profit level will be placed such as this Risk/Reward ratio is met
Force Exit based on Squeeze Momentum: true by default, a Long position will be closed when Squeeze Momentum turns red inside an open position and a Short position will be closed when Squeeze Momentum turns green inside an open position
BB Length: 20 by default
BB Mult Factor: 1.0 by default
KC Length: 20 by default
KC Mult Factor: 1.5 by default
Use True Range (KC): Yes by default
Base Setups:
Allow Long Entries: true by default
Allow Short Entries: true by default
Order Size: 1.5 by default
Order Type: Risk Percentage (current) by default, allows adjustment on how the position size is calculated: Cash: only the set cash ammount will be used for each trade Contract(s): the adjusted number of contracts will be used for each trade Capital Percentage: a % of the current available capital will be used for each trade Risk Percentage (current): position size will be determined such that the potential loss is equal to % of the current available capital Risk Percentage (initial): position size will be determined such that the potential loss is equal to % of the initial capital
Trend Filter:
Use long trend filter: true by default, only enter long if price is above Long MA
Show long trend filter: true by default, plot the selected MA on the chart
MA Type (Long): SMA by default
MA Length (Long): 100 by default
MA Source (Long): close by default
Use short trend filter: true by default, only enter long if price is under Short MA
Show short trend filter: false by default, plot the selected MA on the chart
MA Type (Short): SMA by default
MA Length (Short): 100 by default
MA Source (Short): close by default
Simple RSI Limiter:
Limit using Simple RSI: true by default, if set to 'Normal', only enter long when Simple RSI is lower then Long Boundary, and only enter short when Simple RSI is higher then Short Boundary. If set to 'Reverse', only enter long when Simple RSI is higher then Long Boundary, and only enter short when Simple RSI is lower then Short Boundary.
Simple RSI Limiter Type:
RSI Length: 14 by default
RSI Source: hl2 by default
Simple RSI Long Boundary: 50 by default
Simple RSI Short Boundary: 50 by default
ADX Limiter:
Use ADX Limiter: true by default, only enter into any position (long/short) if ADX value is higher than the Low Boundary and lower than the High Boundary.
ADX Length: 5 by default
DI Length: 5 by default
High Boundary: 50 by default
Low Boundary: 20 by default
Use MA based calculation: Yes by default, if 'Yes', only enter into position (long/short) if ADX value is higher than MA (ADX as source).
MA Type: REMA by default
MA Length: 5 by default
Volume Filter:
Only enter trades where volume is higher then the volume-based MA: true by default, a set type of MA will be calculated with the volume as source, and set length
MA Type: EMA by default
MA Length: 10 by default
Session Limiter:
Show session plots: false by default, show crypto market sessions on chart: Sidney (red), Tokyo (orange), London (yellow), New York (green)
Use session limiter: false by default, if enabled, trades will only happen in the ticked sessions below.
Sidney session: false by default, session between: 15:00 - 00:00 (EST)
Tokyo session: false by default, session between: 19:00 - 04:00 (EST)
London session: false by default, session between: 03:00 - 11:00 (EST)
New York session: false by default, session between: 08:00 - 17:00 (EST)
Date Range:
Limit Between Dates: false by default
Start Date: Jul 01 2021 00:00:00 by default
End Date: Dec 31 2022 00:00:00 by default
Trading Time:
Limit Trading Time: false by default, tick this together with the options below to enable limiting based on day and time
Valid Trading Days Global: 1234567 by default, if the Limit Trading Time is on, trades will only happen on days that are present in this field. If any of the not global Valid Trading Days is used, this field will be neglected. Values represent days: Sunday (1), Monday (2), ..., Friday (6), Saturday(7) To trade on all days use: 123457
(1) Valid Trading Days: false, 1234567 by default, values represent days: Sunday (1), Monday (2), ..., Friday (6), Saturday(7) The script will trade on days that are present in this field. Please make sure that this field and also (1) Valid Trading Hours Between is checked
(1) Valid Trading Hours Between: false, 0930-1600 by default, hours between which the trades can happen. The time is always in the exchange's timezone
Fine-tuning is highly recommended when using other asset/timeframe combinations.

Most Power V5 Most Power V5
The MOST indicator is an indicator used as a Moving Stoploss. The MOST indicator also generates a buy signal in case the prices rise, unlike the traditional indicators that allow you to make stop losses.In the MOST POWER V5 indicator, stoploss generates its signals using moving averages such as 'SMA', 'EMA', 'WMA', 'VWMA', 'HMA', 'SMMA', 'DEMA' rather than just the current price. In this way, it aims to prevent false signals that may be produced by excessive price movements during the day.
MOST POWER Indicator follows the average by preserving the stop loss distance in the movement of the moving average in the same direction.
The second variable that creates the MOST POWER curve is the stop loss distance that gives power to MOST with the moving average used and the shift rate that provides the stop signal. In this version, this distance is prepared with 2 separate inputs for both buy and sell.You can set these values as "percentage for long trend" and "percentage for short trend" in the indicator input properties.
You can also enter your Take Profit-1, Take Profit-2-, Take Profit-3- and Stop Loss levels in the indicator input properties, especially if you are interested in algo trading or to take advantage of the wonderful alarm setup features of tradingview and get the chance to get maximum profit. (If you enter Take Profit-1, Take Profit-2-, Take Profit-3- and Stop Loss levels as 0. Only buy and sell labels will appear on the indicator.)
Also, activate the amplitude filter option from the indicator input settings to get less signal and filter our inputs.
In addition, the entry price, take profit1, take profit2, take profit3 values for the last transaction opened to make things easier are located in the upper right corner of your graph as a table.
Important note: No indicator guarantees investment. That's why the tests you will do before real trades are very important in this indicator. I wish you all successful trades.
i will show how works with examples
Example 1
If you enter Take Profit-1, Take Profit-2-, Take Profit-3- and Stop Loss levels greater than 0
Example 2
If you enter Take Profit-1, Take Profit-2-, Take Profit-3- and Stop Loss levels as 0 (u will see only buy - sell labels)
Example 3
if select Amplitude Filter is on . you will see less signal
how works Amplitude Filter whats logic ?
if Amplitude Filter is active the signal from mostpower will be combined with Amplitude Filter.
for example, if the amplitude value is 2, the highest price and the lowest price of the last 2 bars are calculated. then this amplitude value is calculated for sma with its source high and low. Based on these values, the trend is determined in the amplitude of the price movement.
Important note: No indicator guarantees investment. That's why the tests you will do before real trades are very important in this indicator. I wish you all successful trades.

dmn's ICT ToolkitThis is my quality of life indicator for forex trading using the methods and concepts of ICT.
The idea is to automate marking up important price levels and times of the day instead of doing it manually every day.
Killzones
Marks the most volatile times of the day on the chart, during which the intraday high/low usually takes place.
Particularly impactful when there's news released during these times.
London Open (02:00-05:00 EST)
New York Open (08:30-11:00 EST)
London Close (10:00-11:30 EST)
True Day delineation
Vertical line at the start of the "true day" (00:00 EST), start of the algorithmic trading day and aids in visualizing the intraday direction.
New York midnight price level
Noteworthy price level at the start of the "true day".
This price level is referenced by the interbank trading algorithms during the day. Buy below it on bullish days, sell above it on bearish days.
Daily open price level
Reference level for optimal trade entries. Buy below it on bullish days, sell above it on bearish days.
Central Banks Dealers Range (CBDR) (14:00-20:00 EST) &
Central Banks Dealers Flout (CBDF) (15:00-24:00 EST) &
Asian Range (AR) (20:00-24:00 EST)
The standard deviation lines available are used to make predictions for short-term future highs/lows when the CBDR and AR are smaller than 40 pips.
Trade them by looking for 5/15min key levels that converge with the projection levels.
X days Average Daily Range (ADR)
Default to 5 days back, gives an idea of how much movement to expect intraday when the ADR high/low is converging with CBDR/CBDF/AR standard deviations.
Current Daily Range (CDR)
Used for comparison against the ADR to help determine if there's enough intraday range left to enter a trade.
Dynamically changes color based on percentage of the ADR. Green below 50% of ADR, orange between 50 and 100%, red when CDR exceeds ADR.
All of the above are used in conjunction with each other and higher timeframe levels of importance to find entries and target.
Note: Preferably use New York's time zone for your charts.

Investing ZonesInvesting Zones indicator shows the areas where LONGS or SHORTS can be made, the areas are calculated based on the mathematical averages of the high and low peaks of the price.
-There is an area called "No trading Zone" where the price is too slow, It also has a Alma Trend Ribbon (blue for uptrend, pink for downtrend) that helps to make trading decisions.
-You can make shorts when the price enters the Yellow zone called the "Sell Zone" and the price is below the Alma trend, set the TP1 in the white dotted line, and TP2 in the white lower line
-You can make longs when the price enters the Green zone called the "Buy Zone" and the price is above the Alma trend, set the TP1 in the yellow dotted line, and TP2 in the yellow upper line
-It works in all timeframes, personally I use it in 1min, 5min and 1hr.

Day Trading Booster by DGTTiming when day trading can be everything
In Stock markets typically more volatility (or price activity) occurs at market opening and closings
When it comes to Forex (foreign exchange market), the world’s most traded market, unlike other financial markets, there is no centralized marketplace, currencies trade over the counter in whatever market is open at that time, where time becomes of more importance and key to get better trading opportunities. There are four major forex trading sessions, which are Sydney , Tokyo , London and New York sessions
Forex market is traded 24 hours a day, 5 days a week across by banks, institutions and individual traders worldwide, but that doesn’t mean it’s always active the entire day. It may be very difficult time trying to make money when the market doesn’t move at all. The busiest times with highest trading volume occurs during the overlap of the London and New York trading sessions, because U.S. dollar (USD) and the Euro (EUR) are the two most popular currencies traded. Typically most of the trading activity for a specific currency pair will occur when the trading sessions of the individual currencies overlap. For example, Australian Dollar (AUD) and Japanese Yen (JPY) will experience a higher trading volume when both Sydney and Tokyo sessions are open
There is one influence that impacts Forex matkets and should not be forgotten : the release of the significant news and reports. When a major announcement is made regarding economic data, currency can lose or gain value within a matter of seconds
Cryptocurrency markets on the other hand remain open 24/7, even during public holidays
Until 2021, the Asian impact was so significant in Cryptocurrency markets but recent reasearch reports shows that those patterns have changed and the correlation with the U.S. trading hours is becoming a clear evolving trend.
Unlike any other market Crypto doesn’t rest on weekends, there’s a drop-off in participation and yet algorithmic trading bots and market makers (or liquidity providers) can create a high volume of activity. Never trust the weekend’ is a good thing to remind yourself
One more factor that needs to be taken into accout is Blockchain transaction fees, which are responsive to network congestion and can change dramatically from one hour to the next
In general, Cryptocurrency markets are highly volatile, which means that the price of a coin can change dramatically over a short time period in either direction
The Bottom Line
The more traders trading, the higher the trading volume, and the more active the market. The more active the market, the higher the liquidity (availability of counterparties at any given time to exit or enter a trade), hence the tighter the spreads (the difference between ask and bid price) and the less slippage (the difference between the expected fill price and the actual fill price) - in a nutshell, yield to many good trading opportunities and better order execution (a process of filling the requested buy or sell order)
The best time to trade is when the market is the most active and therefore has the largest trading volume, trading all day long will not only deplete a trader's reserves quickly, but it can burn out even the most persistent trader. Knowing when the markets are more active will give traders peace of mind, that opportunities are not slipping away when they take their eyes off the markets or need to get a few hours of sleep
What does the Day Trading Booster do?
Day Trading Booster is designed ;
- to assist in determining market peak times, the times where better trading opportunities may arise
- to assist in determining the probable trading opportunities
- to help traders create their own strategies. An example strategy of when to trade or not is presented below
For Forex markets specifically includes
- Opening channel of Asian session, Europien session or both
- Opening price, opening range (5m or 15m) and day (session) range of the major trading center sessions, including Frankfurt
- A tabular view of the major forex markets oppening/closing hours, with a countdown timer
- A graphical presentation of typically traded volume and various forext markets oppening/clossing events (not only the major markets but many other around the world)
For All type of markets Day Trading Booster plots
- Day (Session) Open, 5m, 15m or 1h Opening Range
- Day (Session) Referance Levels, based on Average True Range (ATR) or Previous Day (Session) Range (PH - PL)
- Week and Month Open
Day Trading Booster also includes some of the day trader's preffered indicaotrs, such as ;
- VWAP - A custom interpretaion of VWAP is presented here with Auto, Interactive and Manual anchoring options.
- Pivot High/Low detection - Another custom interpretation of Pivot Points High Low indicator.
- A Moving Average with option to choose among SMA, EMA, WMA and HMA
An example strategy - Channel Bearkout Strategy
When day trading a trader usually monitors/analyzes lower timeframe charts and from time to time may loose insight of what really happens on the market from higher time porspective. Do not to forget to look at the larger time frame (than the one chosen to trade with) which gives the bigger picture of market price movements and thus helps to clearly define the trend
Disclaimer : Trading success is all about following your trading strategy and the indicators should fit within your trading strategy, and not to be traded upon solely
The script is for informational and educational purposes only. Use of the script does not constitutes professional and/or financial advice. You alone the sole responsibility of evaluating the script output and risks associated with the use of the script. In exchange for using the script, you agree not to hold dgtrd TradingView user liable for any possible claim for damages arising from any decision you make based on use of the script

Macro Score -- User-Customized Scores and SignalsA "macro score", as defined here, is created by giving various weights to different signals and adding them together to get one smooth score. Positive or negative values are assigned to each of the signals depending on if the statement is true or false (e.g. DPO > 0: +1, DPO < 0: -1). This manner of strategy allows for a subset of the available signals to be present at one time as opposed to every technical signal having to be active in order for a long/short signal to trigger. This particular strategy allows the user to choose between 18 different signals to be used in scoring as well as allowing the user to determine the individual weights of each score as well as the overall threshold to determine long or short signals. Weights for each score range between 1 and 5, with 5 being the greatest weight. The overall threshold for long or short is dependent on the total possible weights added together (i.e. if your weights total -10 or +10, a threshold within this range must be used).
The macro score itself is printed in an underlay as a white line that goes between the maximum positive and negative values for all weights added together for this strategy. In addition to the macro score line, a green momentum line (sourced by the macro score itself) has been included. A crossover/crossunder of the macro score and the macro momentum line is included into the long/short signal syntax in addition to a threshold for the macro score. The length of the Macro Score's momentum line can be found in the settings.
The current signals to choose from include:
- ADX Threshold - if the Average Directional Index is above a set threshold, signal positive or negative
- CMF Threshold - if the Chaikin Money Flow oscillator is above 0, signal positive; otherwise, signal negative
- CMO > TSI Signal - signal positive if there is a cross of the Chande Momentum Oscillator and the True Strength Index signal line
- CMO Threshold - if the Chande Momentum Oscillator is above 0, signal positive; otherwise, signal negative
- DPO Threshold - if the Detrended Price Oscillator is above 0, signal positive; otherwise, signal negative
- EOM Threshold - if the Ease of Money Oscillator is above 0, signal positive; otherwise, signal negative
- Jurik Threshold - if the Jurik price line (from the Jurik Volatility Bands) is above 0, signal positive; otherwise, signal negative
- MACD Threshold - if the MACD signal line is above 0, signal positive; otherwise, signal negative
- McGinley Cross - a crossover of a fast McGinley Dynamic length line and a slow McGinley Dynamic line signals positive; otherwise, signal negative
- PSAR - if the direction of the PSAR is heading long, signal positive; otherwise, signal negative
- ROC Threshold - if the Rate of Change oscillator is above 0, signal positive; otherwise, signal negative
- RSI Threshold - if the Relative Strength Index is above 50, signal positive; otherwise, signal negative
- Stoch RSI Threshold - if the Stoch RSI is above 50, signal positive; otherwise, signal negative
- Supertrend - if the Supertrend determines long, signal positive; otherwise, signal negative
- TSI Cross - a crossover of the True Strength Index value line and the TSI signal line signals positive; otherwise, signal negative
- TSI Signal Threshold - if the TSI signal line is above 0, signal positive; otherwise, signal negative
- Williams Alligator Cross - if the Williams Alligator lips cross the teeth and jaw, signal positive; otherwise, signal negative
- Williams %R - if the Williams %R is above -50, signal positive; otherwise, signal negative
Take profit, stop loss, and trailing percentages are also included, found at the bottom of the Input tab under “TT and TTP” as well as “Stop Loss”. Make sure to understand the TP/SL ratio that you desire before use, as the desired hit rate/profitability percentage will be affected accordingly. This strategy does NOT guarantee future returns. Apply caution in trading regardless of discretionary or algorithmic. Understand the concepts of risk/reward and the intricacies of each strategy choice before utilizing them in your personal trading.
Profitview Settings:
If you wish to utilize Profitview’s automation system, find the included “Profitview Settings” under the Input tab of the strategy settings menu. If not, skip this section entirely as it can be left blank. Options will be “OPEN LONG TITLE”, “OPEN SHORT TITLE”, “CLOSE LONG TITLE”, and “CLOSE SHORT TITLE”. If you wished to trade SOL, for example, you would put “SOL LONG”, “SOL SHORT”, “SOL CLOSE LONG”, and “SOL CLOSE SHORT” in these areas. Within your Profitview extension, ensure that your Alerts all match these titles. To set an alert for use with Profitview, go to the “Alerts” tab in TradingView, then create an alert. Make sure that your desired asset and timeframe are currently displayed on your screen when creating the alert. Under the “Condition” option of the alert, select the strategy, then select the expiration time. If using TradingView Premium, this can be open-ended. Otherwise, select your desired expiration time and date. This can be updated whenever desired to ensure the strategy does not expire. Under “Alert actions”, nothing necessarily needs to be selected unless so desired. Leave the “Alert name” option empty. For the “Message”, delete the generated message and replace it with {{strategy.order.alert_message}} and nothing else.
Sample setup for SOLUSDT 30M:
- Score 1 - Value 4, PSAR (0.05 start, 0.02 increment, 0.2 max value; sourced open)
- Score 2 - Value 4, Jurik Threshold (JVB Length 25, JVB Smoothing 6, JVB Price Threshold 0)
- Score 3 - Value 5, DPO Threshold (DPO Length 40, uncentered)
- Score 4 - Value 5, CMO Threshold (CMO Length 40, sourced open)
- Score 5 - Value 2, MACD Threshold (Fast Length 12, Slow Length 30, sourced open)
- Macro Length 21
- Long Threshold - -3
- Short Threshold - +3
- Take Profit % - 0.9/0.9
- Trail % - 0.005
- Stop Loss % - 1.4
Sample setup for AVAXUSDT 20M:
- Score 1 - Value 3, TSI Cross (Long Length 25, Short Length 16, Signal Length 17)
- Score 2 - Value 2, TSI Signal Threshold (same settings as the TSI Cross)
- Score 3 - Value 2, Jurik Threshold (JVB Length 20, JVB Smoothing 8, JVB Price Threshold 0)
- Score 4 - Value 2, DPO Threshold (DPO Length 40, uncentered)
- Score 5 - Value 1, Stoch Threshold (K/D 3, RSI (Stoch) Length 10, Stochastic Length 4, sourced open)
- Macro Length 13
- Long Threshold - +5
- Short Threshold - -5
- Take Profit % - 1.2/1.2
- Trail % - 0.005
- Stop Loss % - 1.5

Rob Booker Reversal Tabs StrategyRob Booker Reversal Tabs Strategy is an updated version of Rob Bookers Reversal Tab study: Rob Booker Reversal Tabs
While the original is a Pinescript study, this version can be switched between strategy and indicator mode.
Rob Bookers script generates reversal signal based on MACD and Stochastics, it is not a true reversal system, default pyramiding value is set to 5.
Inputs determine MACD and Stochastics settings. The only additional input is the "Strategy Mode" checkbox.
This script works well on its own for some tickers, but like any reversal pattern generating scripts, traders will profit from looking at overall price action and trend strength before making a trade.
From the original:
A simple reversal pattern indicator that uses MACD and Stochastics.
Created by Rob Booker and programmed by Andrew Palladino.
Please note that I only updated the original to V5 and edited it to be a strategy, which was a grand total of 5 minutes of work. I updated it because I wanted to see how the script performs as a strategy and I'm publishing it in case others would like to use it. I take no credit whatsoever for the original and WILL take this version down if Rob Booker or his Team ask me to or decide to release their own strategy version of the original.
Check out Rob Bookers scripts and ideas on his Tradingview account: robbooker

Price Average ZonesThis indicator shows the areas where LONGS or SHORTS can be made, the areas are calculated based on the mathematical averages of the high and low peaks of the price.
It also has a line that shows the average of the price movement. you can make shorts when the price enters the orange zone called the "Short Zone".
You can make longs when the price enters the orange zone called the sell zone.
It works in all timeframes, personally I use it in 1 min and in 1 hour.

FluidTrades - SMC Lite
Price action and supply and demand is a key strategy use in trading. We wanted it to be easy and efficient for user to identify these zones, so the user can focus less on marking up charts and focus more on executing trades.
This indicator shows you supply and demand zones by using pivot points to show you the recent highs and the recent lows.
Features
This indicator includes some features relevant to SMC , these are highlighted below:
Full internal & swing market structure labeling in real-time
Swing Structure: Displays the swing structure labels & solid lines on the chart (BOS).
Supply & demand ( bullish & bearish )
Swing Points: Displays swing points labels on chart such as HH, HL, LH, LL.
Options to style the indicator to more easily display these concepts
White OB (supply): search for short opportunities
Blue OB (demand): search for long opportunities
Break of structure ( BOS )
For markets to move up and down a break in market structure must occur. A break in market structure occurs when the market begins to shift direction and break the previous HH and HL or HL and LL of the market. We also integrated the feature that you can see the BOS lines. In the indicator settings you can adjust the color of the label.
Settings
SwingHigh/Low Length: Allows the user to select Historical (default) or Present, which displays only recent data on the chart.
Supply/demand box width: Allows user to change the size of the supply and demand box
History to keep: allows the user to select how many most recent supply & demand box appear on the chart.
Visual settings
Show zig zag : allow user to see market patters within the market
Show price action labels: allow user to turn on/off the (swing points)
Supply box color : allow users to change the color of their supply box
Demand box color : allow users to change the color of their supply box
Bos label color : allow users to change the color of their BOS label
Poi label color : allow user to change the color of their POI label
Price action label : allow users to change the color of their swing points labels
Zig zag color : allow users to change the color of the zig/zag market patters
Warning
Never blindly take a trade on a supply/demand box - wait for a proper market structure to occur before considering a trade.

Crypto and FX PSCA simple tool to calculate crypto position size and FX lot size.
How to use:
1. Use TradingView measurement tool or position tool to know how wide is your stop loss.
2. Set the equity and risk parameters.
2. For crypto, input the PERCENTAGE in stop loss;
For FX, input the PIPS.
3. Position size will be displayed in the panel.
Notes:
>Position size is in USDT for Cryptocurrencies
>Lot size for forex.
Forex contract size is your account type set by the broker:
Standard = 100,000 units = ~$10/pip
Mini = 10,000 units = ~$1/pip
Micro = 1,000 units = ~$0.10/pip
Nano = 100 units = ~$0. 01/pip
Credits:
trananhvu149
hanabil

Sw1tchFX - Average Daily RangeDESCRIPTION AND OVERVIEW
The Average Daily Range is a measure of volatility (typically across 5 days for the FX markets). I originally saw this being used in a trading system called ANTSSYS by Daryll Guppy and some other developers. I couldn't find it anywhere so I decided to build it from scratch.
What this does is allow you to measure volatility across various FX assets (I will apply other asset classes in the future that this is applicable to i.e. Crypto, Commodities, Blue Chip Stocks), and set realistic targets based off that volatility. Overall, this makes much more sense to me in the FX markets rather than support and resistance lines because it's based off the actual movement of the asset class. Market research shows that an asset class has a 80-85% chance to reach 75% of it's Average Daily Range (ADR).
Let's take a look at the daily ADR on the GBPNZD 15m chart. Notice how the values of the ADR act as real support and resistance based off the volatility of the asset. In this case, price did not quite reach the 75% ADR target.
Let's take a look at another example on EURNZD 15m chart. In this case, price hit the 75% target.
It's important to note that these levels do not bound the price. The probability that price exceeds it's 75% ADR is fairly low, but not impossible. Especially during important news events. Let's look at the recent USDCHF 15m chart for example.
Additionally, you can use these values to measure longer term movements (Weekly, and Monthly)
Here is a weekly view:
And a monthly view:
HOW I USE THIS
I use this in conjunction with some other indicators I've developed. Typically, I use range bars since I only care about price, not time. Additionally, averages are smoother when time is not taken into account and only price.
HOW THE CANDLE OPEN AND CLOSE IS CALCULATED
This is done based off of your own specific time zone and from the daily candle. So for me on PST, the daily candle will close at 1400. Once closed, a new ADR value is automatically calculated and added to the chart. There is an option to show past ADR values if you would like to see them or conduct additional research.

Market sessions and Volume profile - By LeviathanThis script allows you to keep track of Forex market sessions (Tokyo, London and New York), as well as Daily, Weekly and Monthly sessions. All of them are accompanied by Volume Profile options where you can view VP Histogram, Point of Control, Value Area High and Value Area Low.
Colors, lines and other design preferences are fully customizable.
* Volume Profile of shorter sessions (eg. Tokyo, London, New York) works better when using lower timeframes such as 15min, 5min, etc.
** Use timeframe higher than 15min when viewing Monthly sessions
Indicator settings overview:
SESSION TYPE
- Tokyo session (1:00 - 9:00 UTC/ GMT )
- London session (7:00 - 16:00 UTC/ GMT )
- New York session (13:00 - 22:00 UTC/ GMT )
- Daily session
- Weekly session
- Monthly session
DISPLAY
- Show Volume Profile (Show or hide Volume Profile histogram)
- Show POC (Show or hide Point Of Control line)
- Show VAL (Show or hide Value Area Low line)
- Show VAH (Show or hide Value Area High line)
- Show Live Zone (Show or hide the ongoing session)
VOLUME PROFILE SETTINGS
- Resolution (The higher the value, the more refined of a profile, but less profiles are shown on the chart)
- Smooth Volume Data (Useful for assets that have very large spikes in volume over large bars, helps create better profiles)
APPEARANCE
- Up Volume color (Pick a custom color for up/ bullish volume profile nodes)
- Down Volume color (Pick a custom color for down/ bearish volume profile nodes)
- POC color and thickness (Pick a custom color and thickness for Point Of Control line)
- VAH color and thickness (Pick a custom color and thickness for Value Area High line)
- VAL color and thickness (Pick a custom color and thickness for Value Area Low line)
- Session box thickness (Pick a custom thickness for the session box. Color is provided automatically with optimal contrast)
** Some VP elements are inspired by @LonesomeTheBlue's volume profile script

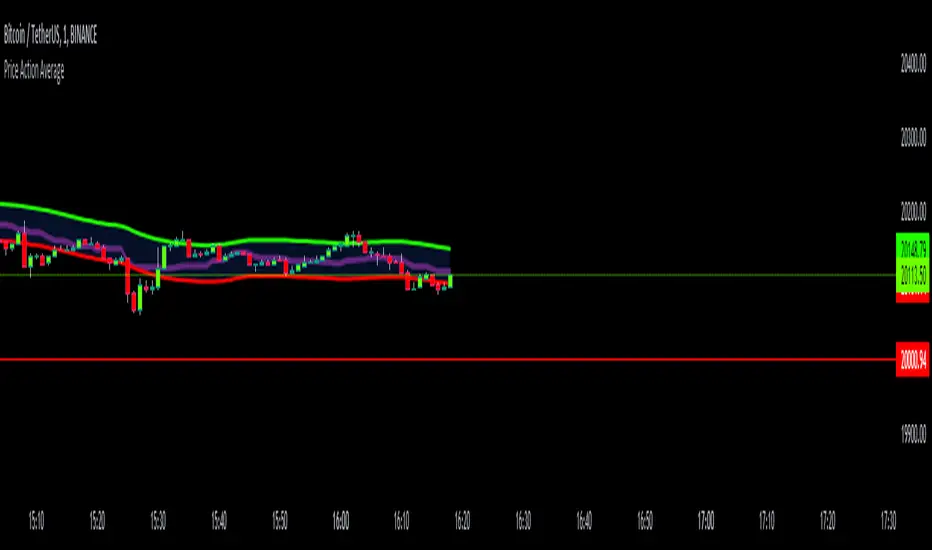
Price Action AverageThis indicator is perfect for scalping in 1 minute, it consists of a channel and a line that is made up of the average of the highs and lows of the price in 12 and 64 cycles.
The channel has as its center a 7 cycles SMA, when the average line (Called Signal, the purple one) crosses the upper band it is time to make a Long.
If it crosses the lower band it is time to make a short, if the line returns to the channel a signal appears to close the operation.
The indicator works with all timeframes, I use it on the 1 hour chart and I do the trades in 1 minute.
rt maax EMA cross strategythis just sample of our strategies we published with open source, to learning our investor the way of trading and analysis, this strategy just for study and learning
in this strategy we use expontial moving avarage 20 , 50 , 200 and the we build this strategy when the price move up ema 200 and ema 20,50 cross up the 200 ema in this conditions the strargey will open long postion
and the oppisit it is true for short postion in this sitation the price should be under ema 200 and the ema 20 , 50 should cross under 200 ema then the strategy will open the short postion
we try this strategy on forex ,crypto and futures and it give us very good result ,, also we try this postion on multi time frame we find the stragey give us good result on 1 hour time frame .
in the end our advice for you before you use any stratgy you should have the knowledg of the indecators how it is work and also you should have information about the market you trade and the last news for this market beacuse it effect so much on the price moving .
so we hope this strategy give you brefing of the way we work and build our strategy

Cosmic GravityCosmic Gravity draws dynamic non-repainting trendlines and helps
⭐ know when to scalp
⭐ predict the position and timing of the next major reversal
⭐ predict sudden changes in volatility
⭐ recognize if the trend is bearish or bullish
👀 HOW IT WORKS
Cosmic Gravity draws a dynamic channel consisting of a basis line and several support and resistance levels for low/medium/high volatility situations, as defined by the Inner Channel and 2 Outer Channel plots respectively. The script achieves this by reducing a large number of select moving averages, their multiples, and other trend levels into a single basis line and deriving the remaining plots off of it using ATR and probability-constant multiples. The basis line color is determined by its smoothed vector similar to how our Cosmic Vector indicator paints its plot. The aim of this indicator is to provide a consistent and generic price context that works out-of-the-box; accordingly a single static average period is used throughout and the settings have been stripped to the bare minimum with no need to ever update them.
📗 HOW TO USE IT
Cosmic Gravity's channel levels are meant to be used as a guide for entering and exiting positions and setting stop-loss and take profit levels. The indicator is deemed effective for any particular timeframe as long as the price stays within the maximum bounds of the indicator's plots. For this reason it is recommended to use Cosmic Gravity in a multi-chart layout where each chart has a different timeframe. The 5 primary strategies are:
long when the price reverses off of an Outer Channel support level and short when the price reverses off of an Outer Channel resistance level
long when the price crosses above the basis line after being below it for a prolonged period and vice-versa (short when the price trend moves below the basis line)
long when the basis line color turns blue after being pink for a prolonged period and visa-versa (short when the basis line color turns pink)
long/short in the direction the price takes when it goes outside the Magnetic Gravity channel when this channel is in a tight squeeze
scalp as the price bounces between the Inner Channel levels (do this only while the price is contained inside the Inner Channel )
🔔 SMART ALERTS
Get notified at the most critical times with a single alert. Simply select Cosmic Gravity - Any alert() function call as the condition when creating an alert and you will be tipped-off on bar-close as follows:
RR↘ (price close crossed below Outer Channel R6 plot)
RR↗ (price high crossed above Outer Channel R6 plot)
R└ (price low entered R channel from above)
R┘ (price high exited R channel from above)
R┐ (price high exited R channel from below)
R┌ (price high entered R channel from below)
B↘ (price high crossed below Basis plot)
B↗ (price low crossed above Basis plot)
B╮ ( Basis vector turned negative)
B╯ ( Basis vector turned positive)
S└ (price low entered S channel from above)
S┘ (price low exited S channel from above)
S┐ (price low exited S channel from below)
S┌ (price high entered S channel from below)
SS↘ (price low crossed below Outer Channel S6 plot)
SS↗ (price close crossed above Outer Channel S6 plot)
For example, an alert such as Cosmic Gravity 6H R┐ B↘ means that during the last 6-hour bar the price exited the R channel from below and also crossed below the basis line.
🚩 DISCLAIMER
The information we create and publish here is not prohibited, doesn't constitute investment advice, and isn't created solely for qualified investors.

Oasis Trading Group: Correlation Table The Correlation Table is an indicator that is used to measure the Correlation Coefficient of multiple assets at the same time in an easy to read table.
A quick introduction into reading a Correlation Coefficient:
A strong positive correlation (one asset moves in one direction the other asset also moves in the same direction) = +1.00
A strong negative correlation (one asset moves in one direction the other asset moves in the opposing direction) = -1.00
Typically you would like to see the correlation strength to be greater than 0.7 or less than -0.7 for there to be a tradable correlation. A reading close to zero would not offer optimal trade entries.
The other data the indicator is showing is the overall trend. This reading is a simple calculation based on the correlation length the user inputs, the indicator will determine if price action is trending up or down based on this length.
The indicator has a reading for the current timeframe that is on the chart and also a second timeframe which is defaulted to the daily.
This indicator is an add-on to the and I hope to have more updates coming soon.
For Access or Questions: Private message us. Thank you.
