BOSS EMA Trend Meter PRO With Alerts BOSS PRO TRADING SYSTEM INDICATORS
Bullish Uptrend
To determine bullish uptrend there must beat least 2 green squares on all three trend meters. This is a great predictor that a uptrend is imminent. You can set alerts for top two meters being green as well as all 3 meters being green
Bearish Downtrend
To determine bearish downtrend there must beat least 2 red squares on all three trend meters. This is a great predictor that a downtrend is imminent. You can set alerts for top two meters being red as well as all 3 meters being red.
Purchase Here: bosscripts.com
Forex


MTF RSI [mushoku]Multi Time Frame RSI
異なる時間軸のRSIを同時に表示できるインジケーターです。
無料で使用できます。
こちらでも簡単ですが紹介しています。
note.mu

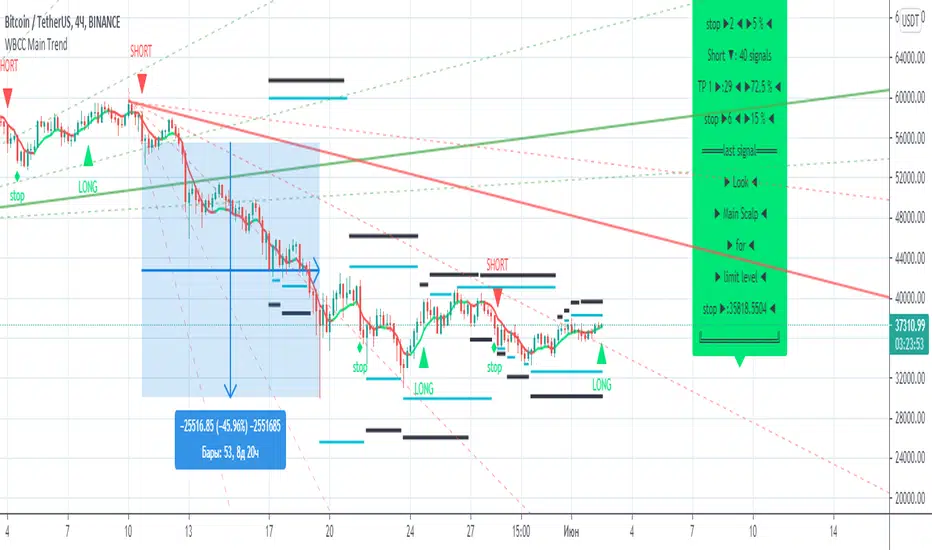
WBCC Main TrendИспользуется для определения движения основного тренда (Long/Short), а так же успешно может быть применен и на более маленьких временных интервалах.

WBCC Strategy (1hour)RU
Нами было принято решение о возможности предоставления доступа к нашему индикатору - WBCC Strategy, он подходит для любой биржи и видов монет и акций.
Примеры:
1) Золото - Форекс -
2) Биткоин - Bitmex -
3) MLT - Binance -
Доступен данный индикатор будет с 15 августа 2019 (мы предоставляем возможность его использовать, путем выдачи ограниченного доступа - для вашего персонального аккаунта на платформе - ru.tradingview.com ,
Он будет доступен у Вас в этом разделе: prnt.sc)
Со всеми вопросами писать сюда Telegram: @wbcc_club
ENG
We decided to provide access to our indicator - WBCC Strategy, which is suitable for any exchange and types of coins and shares.
Examples:
1) Gold - Forex -
2) Bitcoin - Bitmex -
3) MLT - Binance -
This indicator will be available from August 15, 2019 (we provide the opportunity to use it, by issuing a limited access - for your personal account on the platform - ru.tradingview.com ,
It will be available from you in this section: prnt.sc)
With all the questions to write here Telegram: @wbcc_club

Auto Swing Trading IndicatorAuto Swing Trading Indicator is based on 5 different technical indicators. This indicator uses these different indicators to determine the best time to BUY and SELL. This Indicator will not Repaint and signal at candle close is final.
This Indicator is best used on 4 hrs timeframe. But can be used on any timeframe.
Targets (T1) are displayed when there is a BUY signal. Targets are based on the combination of previous High and Low.
The strategy is to sell 50% at T1 and ride until the SELL signal posted.
Buy and Sell Alerts are added for this indicator. In the Alerts window, please choose the option "Once the candle closes" for best results.
More features are going to be added to this indicator.
This is an invite-only script. Please message me for access

CoinStudio Signals Full (read the description)CoinStudio Signals Full displays long and short, as well as reasonable targets and allows to set custom alerts based on them.
Possible targets are flagged as "C" for the most previously occurred signal. These targets indicate chances to sell before an expected reversal.
If the signals switch from let's say Short to Long and there are no targets between them, it either means the signal failed or the target is falling together with a new signal.
CoinstudioSignals work for any asset (crypto, stocks, gold , silver , etc.) and work for every time-frame.
However, daily and 4hr usually give the best results.
To add this script, please send me a message and ask for an invite!

CS Signals Lite (read the description)CoinStudio Signals Lite displays long and short entries.
Additionally, the Full version supports custom alerts based on the signals.
To get access to the full version and alerts, please message me for an invite.
The signals work for any asset (crypto, stocks, gold , silver , etc.).
In principle, the signals work for every time-frame but depending on the asset some work better than others.
However, daily and 4hr usually give the best results.


Trademinator Forex Sessions"Trademinator Forex Sessions" displays overlapping colored boxes on the chart delimited by the opening and closing times of the specific exchange on the horizontal axis, and the maximum and minimum trading prices on the vertical axis, respectively. It also displays the exchange name on top of the candle corresponding to the opening time for each exchange.
Sessions can be enabled or disabled on the chart for each individual exchange through the "Inputs" tab of the "Settings" dialog box of the indicator. The exchange names can also be enabled or disabled in the same tab.
The included exchange sessions in sequential opening order are:
1- Sydney
2- Tokio
3- Frankfurt
4- London
5- New York
And additional session is included to account for the 2 hour timespan between the New York close and the Sydney open, when all exchanges are closed but still there is someone out there trading the Forex. I don't need to nominate you, since by now you already know who you are.
A future release of the indicator is planned to automatically adjust the opening and closing times of each exchange by the Daylight Saving Time.

Intelligent Exponential Moving Average Private AccessView the full documentation on this indicator here: www.kenzing.com
Note: This indicator is now intended for those who have been granted private access and may be more frequently updated than the previous versions.
Introduction
This indicator uses machine learning (Artificial Intelligence) to solve a real human problem.
The Exponential Moving Average ( EMA ) is one of the most used indicators on the planet, yet no one really knows what pair of exponential moving average lengths works best in combination with each other.
A reason for this is because no two EMA lengths are always going to be the best on every instrument, time-frame, and at any given point in time.
The " Intelligent Exponential Moving Average " solves the moving average problem by adapting the period length to match the most profitable combination of exponential moving averages in real time.
How does the Intelligent Exponential Moving Average work?
The artificial intelligence that operates these moving average lengths was created by an algorithm that tests every single combination across the entire chart history of an instrument for maximum profitability in real-time.
No matter what happens, the combination of these exponential moving averages will be the most profitable.
Can we learn from the Intelligent Moving Average?
There are many lessons to be learned from the Intelligent EMA . Most will come with time as it is still a new concept. Adopting the usefulness of this AI will change how we perceive moving averages to work.
Limitations
Ultimately, there are no limiting factors within the range of combinations that has been programmed. The exponential moving averages will operate normally, but may change lengths in unexpected ways - maybe it knows something we don't?
Thresholds
The range of exponential moving average lengths is between 5 to 40.
Additional coverage resulted in TradingView server errors.
Future Updates!
Soon, I will be publishing tools to test the AI and visualise what moving average combination the AI is currently using.
Follow and like for more content!

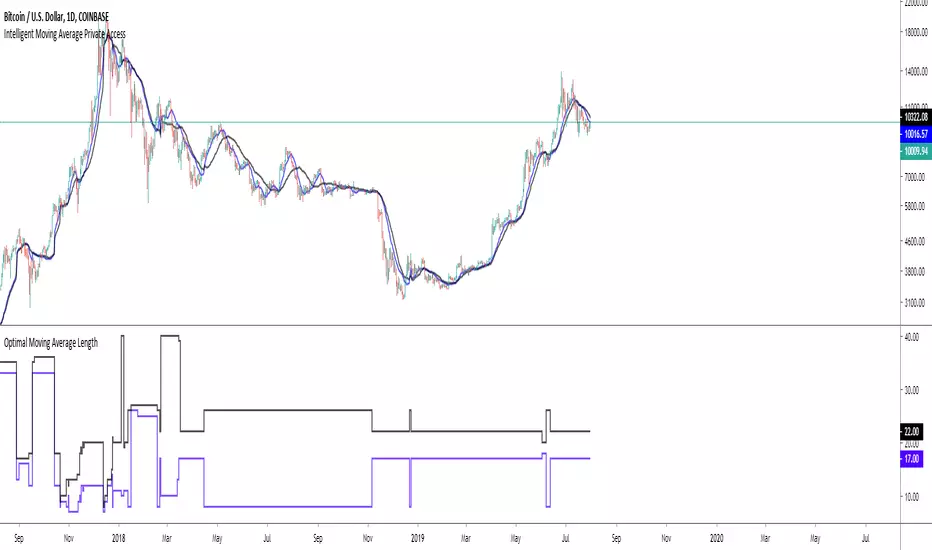
Intelligent Moving Average Private AccessNote: This indicator is intended for those who have been granted private access and may be more frequently updated than the previous versions.
Introduction
This indicator uses machine learning (Artificial Intelligence) to solve a real human problem.
The Moving Average is the most used indicator on the planet, yet no one really knows what pair of moving average lengths works best in combination with each other.
A reason for this is because no two moving averages are always going to be the best on every instrument, time-frame, and at any given point in time.
The " Intelligent Moving Average " solves the moving average problem by adapting the period length to match the most profitable combination of moving averages in real time.
How does the Intelligent Moving Average work?
The artificial intelligence that operates these moving average lengths was created by an algorithm that tests every single combination across the entire chart history of an instrument for maximum profitability in real-time.
No matter what happens, the combination of these moving averages will be the most profitable.
Can we learn from the Intelligent Moving Average?
There are many lessons to be learned from the Intelligent Moving Average. Most will come with time as it is still a new concept.
Adopting the usefulness of this AI will change how we perceive moving averages to work.
Limitations
Ultimately, there are no limiting factors within the range of combinations that has been programmed. The moving averages will operate normally, but may change lengths in unexpected ways - maybe it knows something we don't?
Thresholds
The range of moving average lengths is between 5 to 40.
Additional coverage resulted in TradingView server errors.
Future Updates!
This indicator will be maintained and many updates will come in the near future! Stay tuned.
View the documentation on this indicator here: www.kenzing.com
Tenkan Kijun Cross AlertTenkan Kijun cross alert, best used alongside a Volume indicator to help aid with finding those trend continuation patterns.
I prefer to use the Chaikin Money Flow, when it indicates and holds above the 0 line then you will bias Longs, and when below then you will Bias shorts
If you like this then please donate
BTC: 1LRbUgrkvFLQ5Mt7C62EJRD9aMvhDNT22K
ETH: 0xa509b89bccb788234278eFE63470c10946E26F3c
LTC: LV7MUr6arvCffS5N6pbTWgav5S3Yi1Eejp

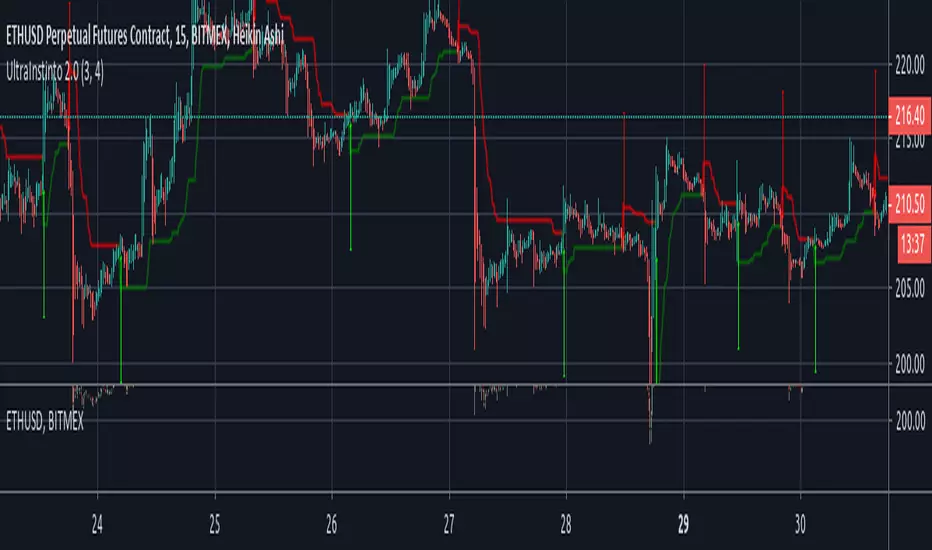
UltraInstinto 2.0BITMEX:ETHUSD
UltraInstinto 2.0 is a trend hunter tool, based on the latest artificial inteligence algorithms it can take decisions on real time, on any frametime, buy when the green arrow appears, and sell when the red arrow appears, easier than play fortnite, and returns you a lot of money
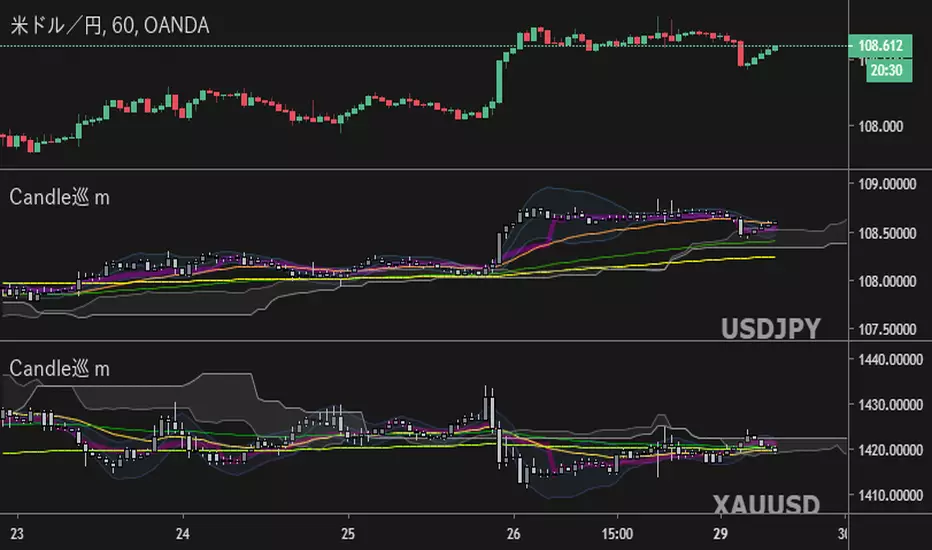
Candles [Meguru] MobileMulti-currency Indication For mobile "Candles[Meguru]Mobile"
The display of exchanges and major currencies has been made selective. (I thought about the use with a smartphone etc. and made it possible to omit the trouble of character input. It is also possible to enter manually.)
モバイル向け多通貨表示インジ『Candles[Meguru]Mobile』
取引所やメジャーな通貨の表示を選択式にしました。(移動時・スマホなどでの利用を考え、文字入力の手間を省略できるよう作成しました。手入力での設定も利用できます。)
反転チャート・時足の固定も可能です。
複数表示することで、多通貨を同時に表示・監視することもできます。
詳細、購入などはこちらにて
note.mu
Various Volume RSI (UNLIMITED)RSI displaying multiple currencies together (arbitrary input version)
forex or cryptcurrencies...economic index or metal or energy...and more...
複数の通貨をまとめて表示するRSIです。(任意入力版)
外国為替や暗号通貨...経済指数・金属・エネルギー...その他を表示できます。
同時に多通貨を監視することで見えてくるものがあります。
詳細、購入などはこちらにて
note.mu
