[astropark - Premium] Long-Short V3-FOREX [Strategy]This indicator is not holy grail , but it is an amazing trend finder and works nicely between 3m and 1W timeframes on FOREX :)))
With this indicator you can enjoy its trading signal and backtest the strategy.
In order to check how much you could have been profitable with this script if you started trading from a specific timestamp, please use this nice website to get the integer number representing in seconds the date-time you want to start from: www.unixtimestamp.com
If you want to set alerts on both buy, sell, take profit and stop-loss signals you must use the following not-strategy indicator version:
HOW TO USE THIS INDICATOR
Buy/Long when you see a green "B" label on the chart at best price you can, you have time till next candle's open price , trying to buy as low as possible near the green cloud or below it. Green cloud acts like a moving support for price, so use it for more buys/longs. The bigger the cloud, the stronger the bull-trend and so the support.
Sell/Short when you see a red "S" label on the chart at best price you can, you have time till next candle's open price , trying to sell as high as possible near the red cloud or over it. Red cloud acts like a moving resistance for price, so use it for more sells/shorts. The bigger the cloud, the stronger the bear-trend and so the resistance.
This indicator suggests some TP (Take Profit) for both longs (in green color) and shorts (in red color): you can start (at least partially!) closing the current trade (eventually you start new longs/shorts at cloud touch if you are a bold trader!).
Keep in mind that the lower the timeframe you work on, the easier is the trend to change rapidly, so always set a -2% / -5% stop-loss on trades and follow the trend with a nice trailing stop strategy.
Of course, as said at the beginning, this indicator suggests some TPs (Take Profits) for both longs (in green color) and shorts (in red color) operations: when you see a TP, you can start (at least partially!) taking profits over the current trade and move stop-loss higher (at least at break-even).
This is a premium indicator , so send me a private message in order to get access to this script.
Do you like my free scripts? Offer me a coffee, a beer, a pizza or whatever :)
BTC jar: 1K5kuYQPEqoNo6GRmJbHWMPmqwKM5S3oRR
ETH jar: 0x091b541a6dd6fe08c4e7bd909baafb2fce9b975e
LTC jar: LSVoAChsZrVsvbNyUfdpxtFpDAUSaUTUig
XRP jar: (XRP deposit tag) 103997763 (XRP deposit address) rEb8TK3gBgk5auZkwc6sHnwrGVJH8DuaLh
PS: Do you need a customization or do you need a dev who implements your strategy? send me a private message ;-)
Forex

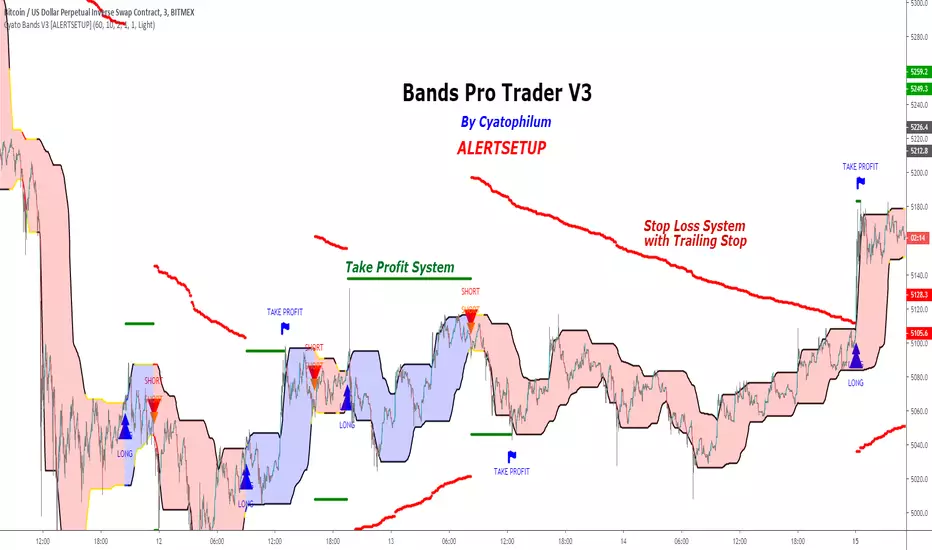
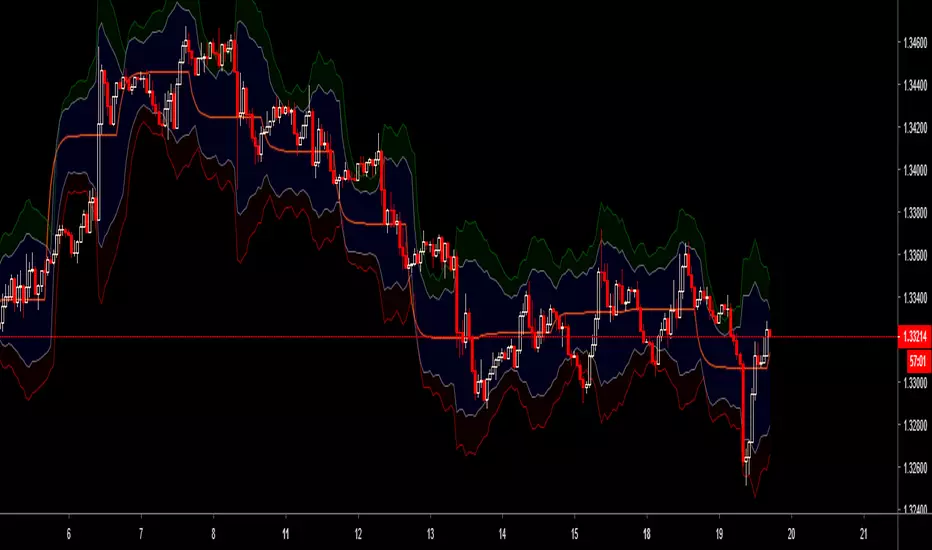
Cyatophilum Bands Pro Trader V3 [ALERTSETUP]An Original Automated Strategy that can be used for Manual or Bot Trading, on any timeframe and market.
>> Presentation <<
This script comes with a Backtest Version
How it works
No, these are NOT Bollinger Bands..
The Cyatophilum Bands are an original formula that I created. You will probably never find it anywhere else.
Their behavior is the following:
When they are horizontal it means the trend is going sideways and they represent supports (lower band) and resistances (upper band).
When they are climbing or falling it means the trend is either bullish or bearish and they represent Trend Lines.
The strategy enters Long on a Bull Breakout and enters Short on a Bear Breakout.
The exits are triggered either on a Trend Reversal, a Stop Loss or a Take Profit.
FEATURES
Take Profit System
Stop Loss System
Show Net profit Line
More features here
Finding a profitable configuration is GUARANTEED
0. Choose your symbol and timeframe. Then add the Backtest version to your chart. If at any time you decide to change your timeframe, go back to step 1.
1. Open the strategy tester and look at the buy & hold line.
If it is mostly climbing (last value greater than 0) then it means we are in a bull market. You should then opt or a long only strategy.
If it is mostly dropping (last value lower than 0) then it means we are in a bear market. You should then opt or a short only strategy.
Note : This first step is really important. Trading against the market has very little chances to succeed.
2. Go into the Strategy Input Parameters:
check "Enable Long Results" and uncheck "Enable Short Results" if you are in a long only strategy.
check "Enable Short Results" and uncheck "Enable Long Results" if you are in a short only strategy.
3. Open the Strategy Tester and open the Strategy Properties.
We are going to find the base parameters for the Bands.
The "Bands Lookback" is the main parameter to configure for any strategy. It corresponds to how strong of a support and resistance the bands will behave. The lower the timeframe, the higher lookback you will need. It can move from 10 to 60. For example 60 is a good value for a 3 minute timeframe. Try different values, and look at the "net profit" value in the Overview tab of the Strategy Tester. Keep the Lookback value that shows the best net profit value.
Then play with the "Bands Smoothing" from 2 to 20 and keep the best net profit value.
The "Band Smoothing" is used to reduce noise.
Usually, the default value (10) is what gives the best results.
From this point you should already be able to have a profitable strategy (net profit>0), but we can improve it using the Stop Loss and the Take Profit feature.
4. To activate the Stop Loss feature, click on the "SECURITY" checkbox
You should see horizontal red lines appear.
A Long/short exit alert will be triggered if the price were to cross this line. (A red Xcross will appear)
Choose the Stop Loss percentage.
On top of that, you can enable the feature "Trailing Stop". It will make the red line follow the price, at a speed that you can configure with the "Trailing Speed" parameter.
Now, sometimes a stop is triggered and it was just a fakeout. You can enable "Re-entries after a stop" to avoid missing additional opportunities.
5. To activate the Take Profit feature, click on the "TAKE PROFIT" checkbox
You should see horizontal green lines appear.
A Long/short exit alert will be triggered if the price were to cross this line. (A flag will appear)
Choose the Take Profit percentage.
A low takeprofit will provide a safer strategy but can reduce potential profits.
A higher takeprofit will increase risk but can provide higher potential profits.
6. Money Management
You can configure the backtest according to your own money management.
Let's say you have 10 000 $ as initial capital and want to trade only 5%, set the Order Size to 5% of Equity.
You can increase net profit by increasing the order size but this is at your own risk.
How to create alerts explained here
Sample Uses Cases
Use it literally anywhere
This indicator can be used on any timeframe and market (not only cryptocurrencies).
About the Backtest below
The Net Profit (Gross profit - Gross loss) is calculated with a commission of 0.05% on each order.
No leverage used. This is a long strategy.
Each trade is made with 10 % of equity from an inital capital of 10 000$. The net profit can be bigger by increasing the % of equity but this a trader's rule to minimise the risk.
I am selling access to all my indicators on my website : blockchainfiesta.com
To get a 2 days free trial, just leave a comment , thanks !
Join my Discord for help, configurations, requests, etc. discord.gg
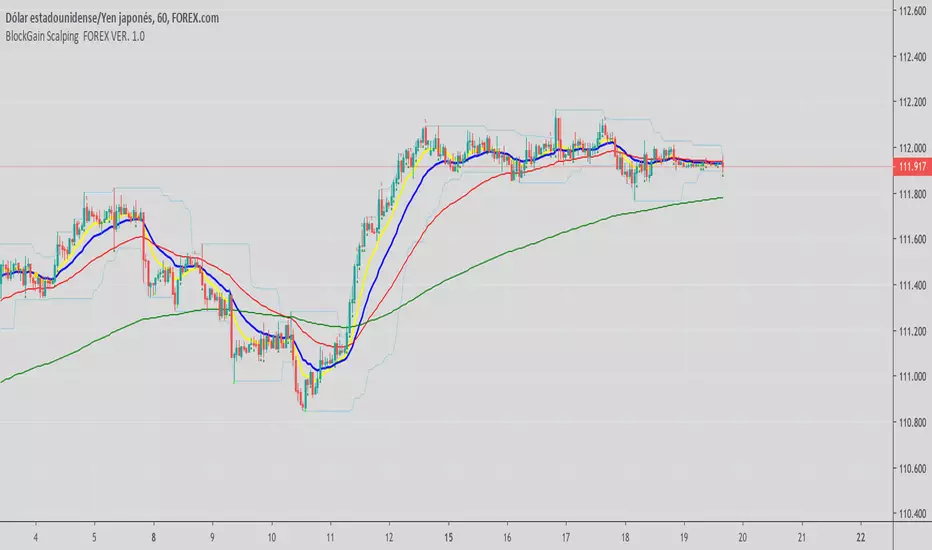
BlockGain Scalping FOREX VER. 1.0THIS INDICATOR WORK WITH TWO SIGNAL YELLOW AND BLUE (FIRST PROFIT 15PIPS) AN STRONG CROSS YELLOW, BLUE, RED CROSS GREEN (MORE 15 PIPS) FOR TIME FRAME 15 MIN , 5 MIN AND 1H

Fake-Out IndicatorThe signal comes from the "RailRoad" candlestick pattern breaking a support/resistance level, which typically indicates price will respect that level.
How consistent is the pattern? Hard to say considering candlestick patterns vary wildly by % change between different securities.
I didn't implement any kind of "fuzzy logic" for this strategy, though it would benefit greatly from it.
There are many instances where a fixed% simply doesn't catch a winning trade from a "bounce" off a S/R level.

PpSignal QQE Move Average Normal VersionQQE Move Average.
The indicator QQE, is an interesting tool based on a Relative Strength Index ( RSI ). While the original RSI is often used as a pointer for overbought or oversold market phases, the QQE provides additional information. Use the QQE to display trend direction and trend strength.
in this version we convert QQE oscilator to QQE move Averague.
UltraInstintoTraderthe ultra instinct trader is the most powerful tool basedin the ultimate form of goku, u can use this script to do very fast trading also binary options and get a lot of profitttt

SharinganTraderthe most powerful clan of konoha, the uchiha have created a sharingan indicator before itachi kill them all, and now u have this precious weapon use it with respect.

ReMegaSayayinTraderTHIS IS A AKAROTO BASED TOOL WE HAVE BEEN INSPIRED BY LTRA INSTTINC MODE OF GOKU A CREATE THIS TOOL THAT U CAN USE IN 1 MINUTE CHART, IF U ARE IN LONG AND THE SAYAYIN SAYS SHORT, Y CHANGE UR TRADE COME ON USE IT IT WILL BE AMAZING

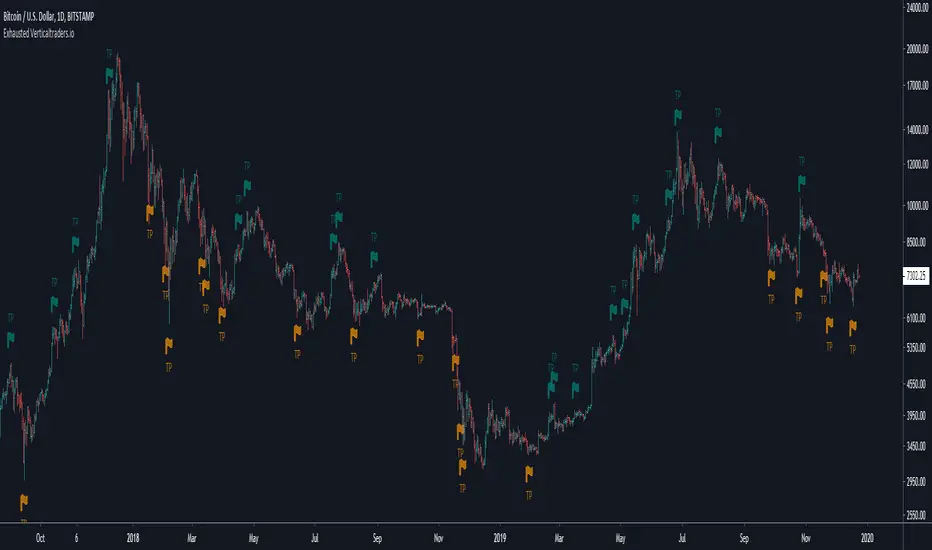
Exhausted-This algorithm takes in consideration Media averages, Volatility Movements, trend direction and other Mathematical Properties.
-After adding this signal on TradingView, you will get notified when it is suggested to protect profit or exits long and short positions.
-Meaning of colors:
Dark Red: suggestion protect profits Long
Red: suggestion exit Long
Dark green: suggestion protect profits Short
Green: suggestion exit Short
-You can activate notification alerts for any of the conditions.
-Works in any timeframe or market like Forex, Crypto, Commodities even Stocks.
-Recommended manual trading.
Do you need an Script or an expert adviser for Forex, contact our coding service!
Get this indicator today! contact us.
Adv Scalper-This algorithm takes in consideration Media averages, Volatility Movements, trend direction and other Mathematical Properties.
-After adding this signal on TradingView, you will get notified every of potential long and short points triggered by the indicator.
-This signal alerts you anytime bars form a bullish or bearish pattern and price start to move in the suggested direction.
- It is recommended to use in 15-30 min timeframes in forex , but It works in any timeframe or market like Forex, Crypto, Commodities even Stocks.
-Recommended manual trading.
Do you need an Script or an expert adviser for Forex, contact our coding service!
Get this indicator today! contact us.

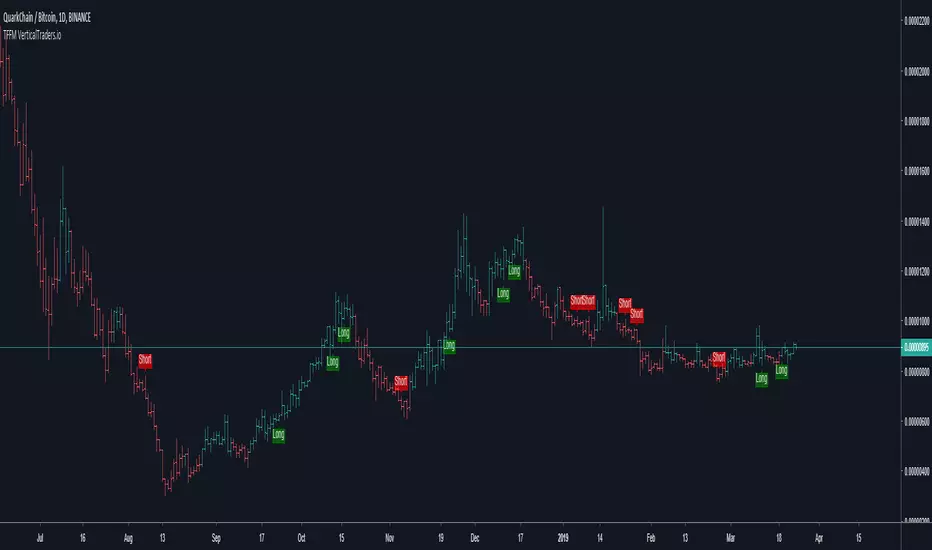
TFFM-This algorithm takes in consideration Media averages, Volatility Movements, trend direction and other Mathematical Properties.
-After adding this signal on TradingView, you will get notified every of potential long and short points triggered by the indicator.
-This signal alerts you anytime bars form a bullish or bearish pattern and price start to move in the suggested direction.
-It works in any time frame or market like Forex, Crypto, Commodities even Stocks.
-Recommended for bots or manual trading.
Do you need an Script or an expert adviser for Forex, contact our coding service:
Get this indicator today! contact us
[astropark - Premium] 5m Bitmex ScalperThis strategy is private for bitmex scalping on 5m - 15m.
News soon.
Thanks
-- astropark --

Premium 3-This algorithm takes in consideration Media averages, Volatility Movements and other Mathematical Properties.
-Allows you to find divergences and price trends in a simple way
-After adding this signal on TradingView, you will see potential long and short according to the colors of the candlesticks.
-It works in any time frame or market like Forex, Crypto, Commodities even Stocks.
Bullish Strength
Olive: weak
Dark green: medium
Light green: strong
Lime: very strong
Bearish strength
Fuchsia: weak
Maron: medium
Red: strong
Intense red: very strong
Do you need an Script or an expert adviser for Forex, contact our coding service
Get this indicator today! contact us

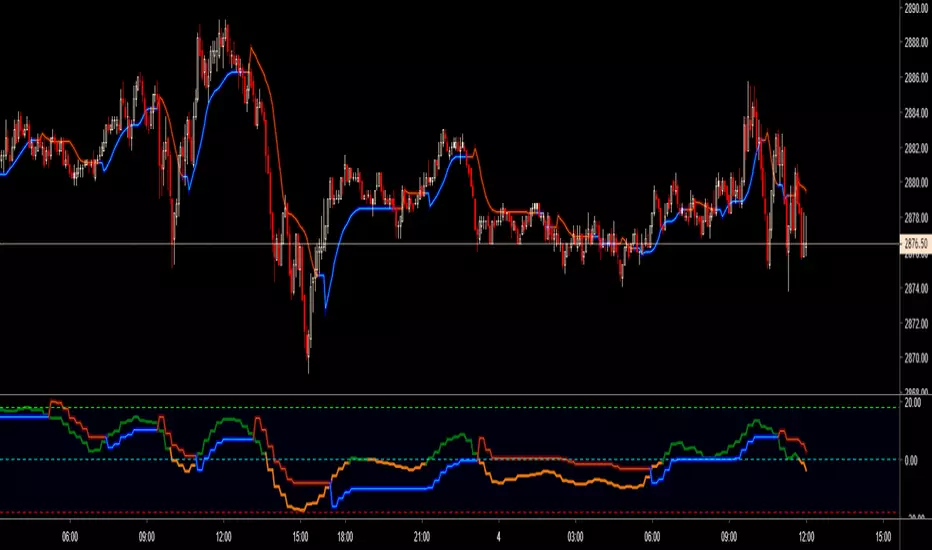
PpSignal For Loop - Up / Down Bars CounterPerPro Oscillator version
Buy when the oscillator is up to line 61.8 of Fibonacci, color lime.
Sell when the oscillator is down to line 23.6 of Fibonacci, color orange.
The fibo 38 and 50, silver color is a neutral position.

Entry Bars -This algorithm takes in consideration Media averages, Volatility Movements and other Mathematical Properties.
-After adding this signal on TradingView, you will get notified every of potential long and short points triggered by the indicator.
-This signal alerts you anytime bars form a bullish or bearish pattern and price start to move in the suggested direction.
-It works in any time frame or market like Forex, Crypto, Commodities even Stocks.
-Recommended for bots or manual trading.
Do you need an Script or an expert adviser for Forex, contact our coding service
Get this indicator today! contact us

Premium 2-This algorithm takes in consideration Media averages, Volatility Movements, trend direction and other Mathematical Properties.
-After adding this signal on TradingView, you will get notified every of potential long and short points triggered by the indicator.
-This signal alerts you anytime bars form a bullish or bearish pattern and price start to move in the suggested direction.
-It works in any time frame or market like Forex, Crypto, Commodities even Stocks.
-Recommended for bots or manual trading.
Do you need an Script or an expert adviser for Forex, contact our coding service: coding@verticaltraders.io
Get this indicator today! contact us

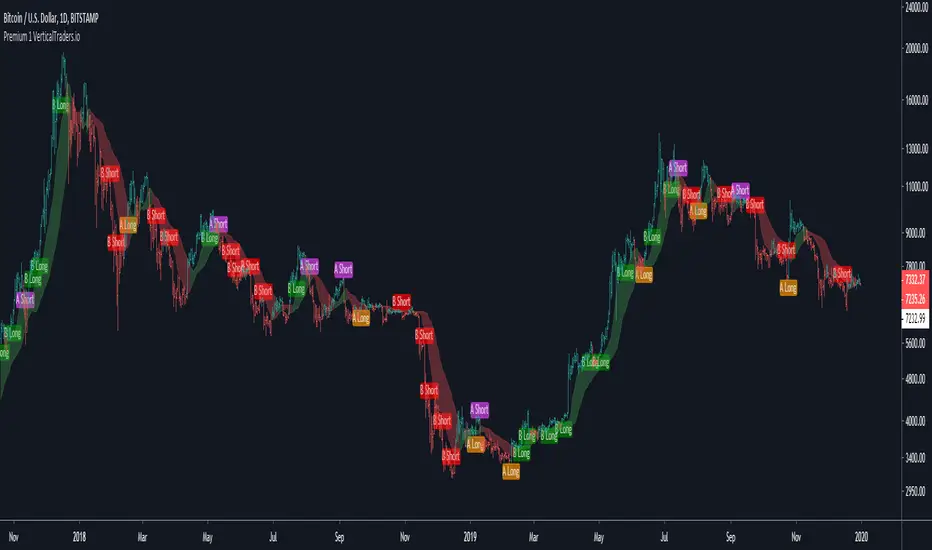
Premium 1-This algorithm takes in consideration Media averages, Volatility Movements and other Mathematical Properties.
-After adding this signal on TradingView, you will get notified every of potential long and short points triggered by the indicator.
-This signal alerts you anytime bars form a bullish or bearish pattern and price start to move in the suggested direction.
-It works in any time frame or market like Forex, Crypto, Commodities even Stocks.
-Recommended for bots or manual trading.
Do you need an Script or an expert adviser for Forex, contact our coding service:
Get this indicator today! contact us
PpSignal Wyckoff Volumeoriginal script
i changed internal calculation
for more information about this oscilator see please
stockcharts.com

PpSignal Wyckoff Wave
the original script is from @modhelius.
I add color trend, alarm (up and down), and volume weighted Average convert to smooth elder.

PpSignal Multi-Day VWAPThank to @mortdiggiddy
original script:
Chart the multi-day Volume Weighted Average Price ( VWAP ). Normally, the VWAP is tracked for the current day, from the first bar of the day (regular or extended session). The VWAP shows the current value of:
-> sum(hlc3 * volume , barsForDay) / sum( volume , barsForDay),
-> where 'barsForDay' is the total number bars that have elapsed during the day for the chart interval.
The multi-day version tracks the VWAP for N days back, by averaging the previous N - 1 day bars VWAP and the current VWAP for the current bar (chart interval).
This is very different that simply using a volume weighted moving average , since the closing VWAP values are used for the historical day bars. The results are interesting for intraday trades... especially for values of 1, 2, 3, 4, 5 ....to 21 days.

PerPro V7+AlertPerPro V7 with alarm. version can be configurable with telegram alert.
www.youtube.com
