Forex

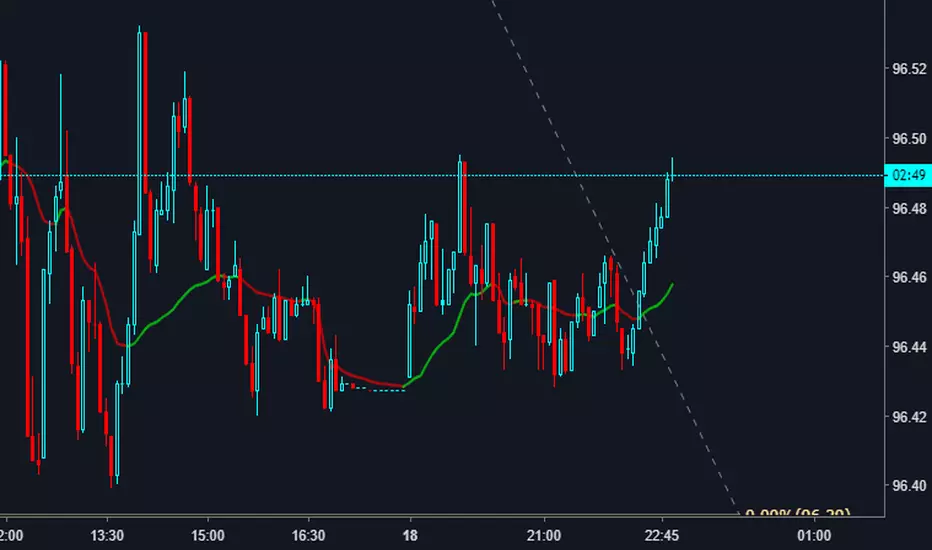
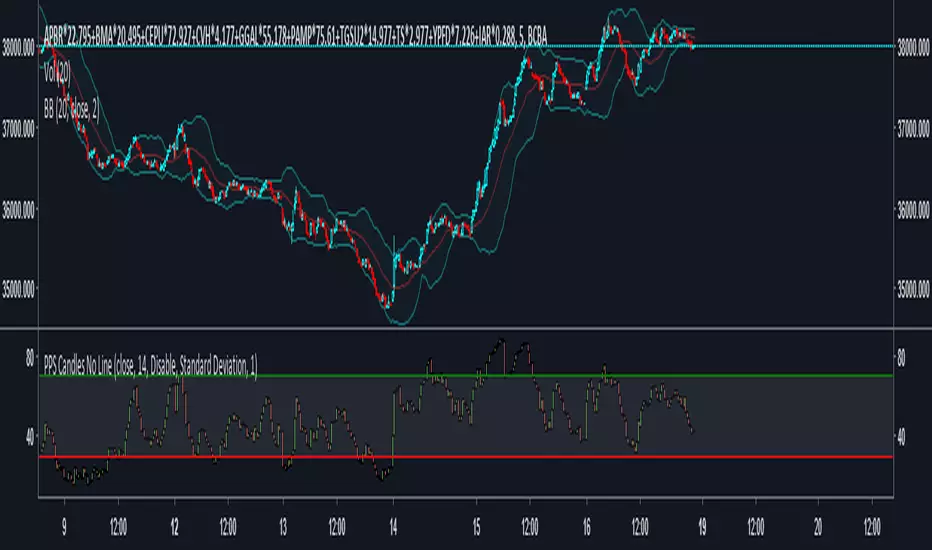
PpSignal The Ultimate Moving Average Crossover 4.0VMA with linear regression smoothe haiken ashi and supertrend bollinguer trend direction

PpSignal The Ultimate Moving Average Crossover 3.0 (CFB)CFB tells you how long the market has been in a quality trend. This value can be used to adjust the period length of other indicators, especially stochastic bands.In order to quantify the overall duration of a market's trend, we replaced classical cycle analysis methods (FFT, MEM, MESA) with a form of analysis that works even when no cycles exist. We accomplished this by examining a time series for specific fractal patterns of any size. We then gather all the patterns found and combine them into one overall index, CFB (Composite Fractal Behavior) Index.For good reason, CFB does not analyze time series data for dominant cycles. Classical cycle analysis examines data points (e.g. prices) and estimates the average presence of a cycle in the window. Now suppose a cycle with a period length of 9 days was strong for 50 days and then disappeared for the next 21 days

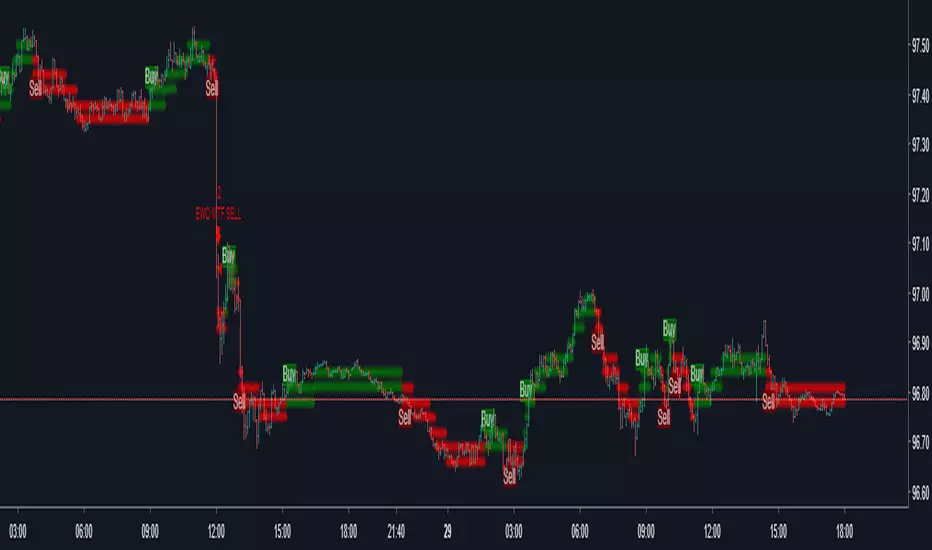
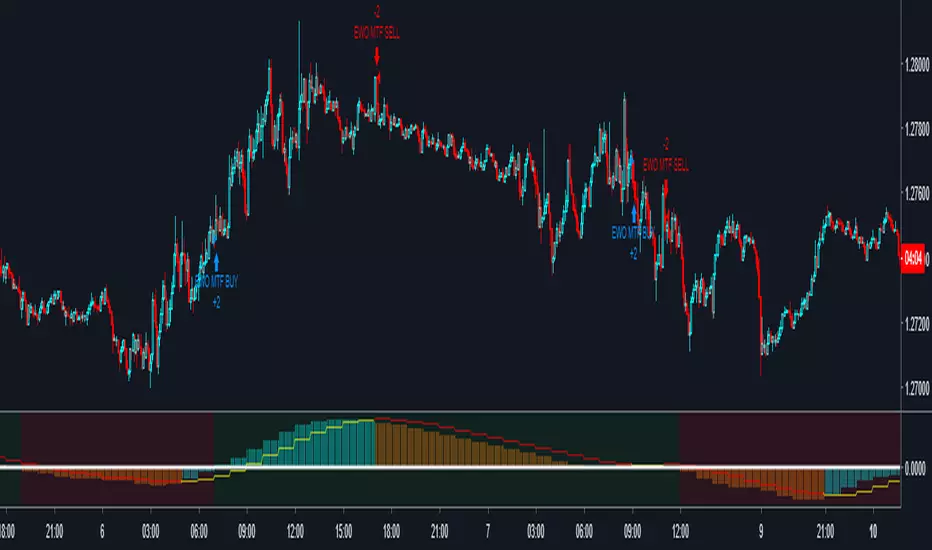
PpSignal EWO LBR MTFEwo mtf strategy.
(tf) superior time frame configuration in input window
Configuration
Forex and crypto :
For time 1 min use tf 30 min
for time 5 min use tf 60 min
for 15, 30 and 60 min use tf 240
Stock:
For time 1 min use tf 30 min
for time 5 min use tf 60 min
for 15 and 30 min tf 240.
For 60 tf D.
For D tf W
For W tf M
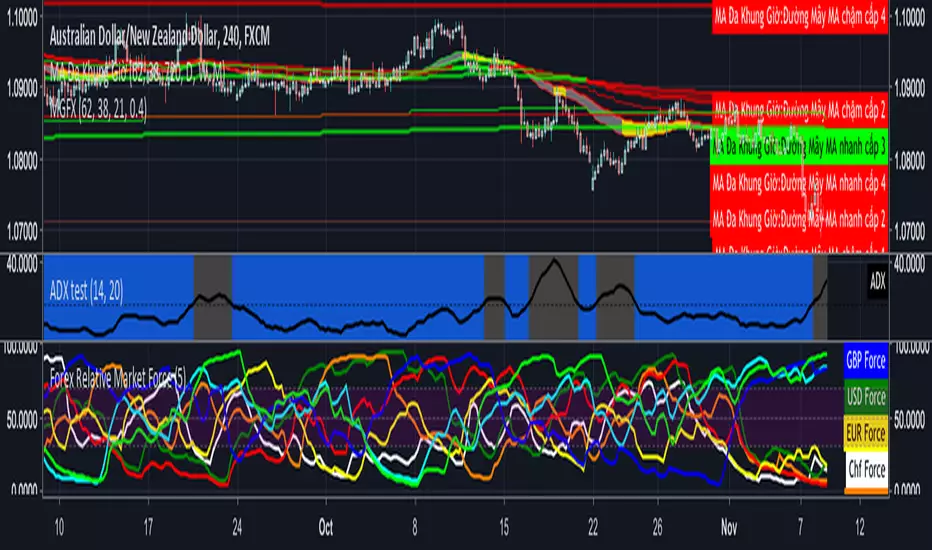
PpSignal The Ultimate Moving Average Crossover 2.0In this version we move out hauken ashi smoothed, bollinguer band and coral. in this version the script have Vidya MA yelloy red color, step ma, lime maroon color, VMA gren. solver and red color and ppsignal hilo trima ma, with different time frame.
If you work in time frame 5 min to 15 min we recommend use hilo trima or alma in 60 min time frame, if you use 30 min to 60 min en 240 min time frame, and d in weekly time frame.


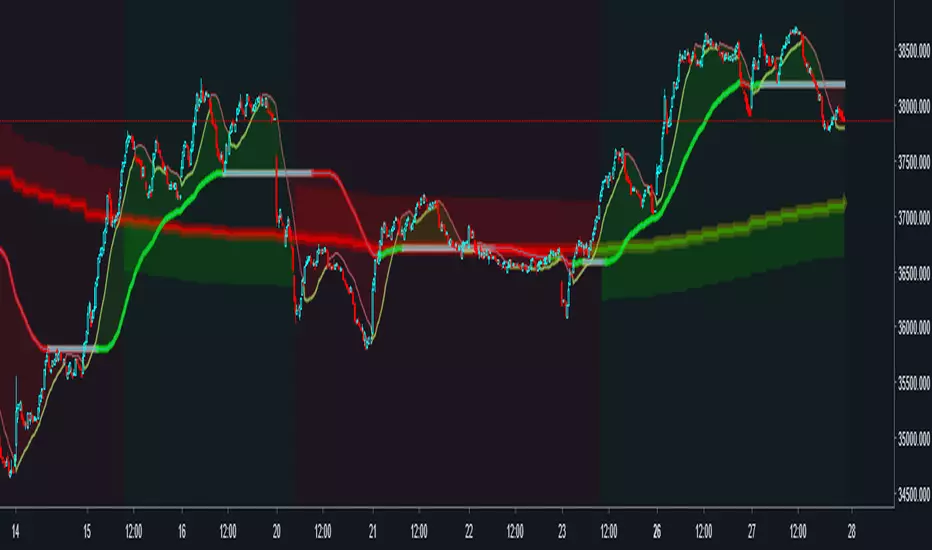
Ehlers MESA Adaptive Moving Averageeveloped by John Ehlers, the MESA Adaptive Moving Average is a technical trend-following indicator which, according to its creator, adapts to price movement “based on the rate change of phase as measured by the Hilbert Transform Discriminator”. This method of adaptation features a fast and a slow moving average so that the composite moving average swiftly responds to price changes and holds the average value until the next bar’s close. Ehlers states that because the average’s fallback is slow, you can create trading systems with almost whipsaw-free trades.
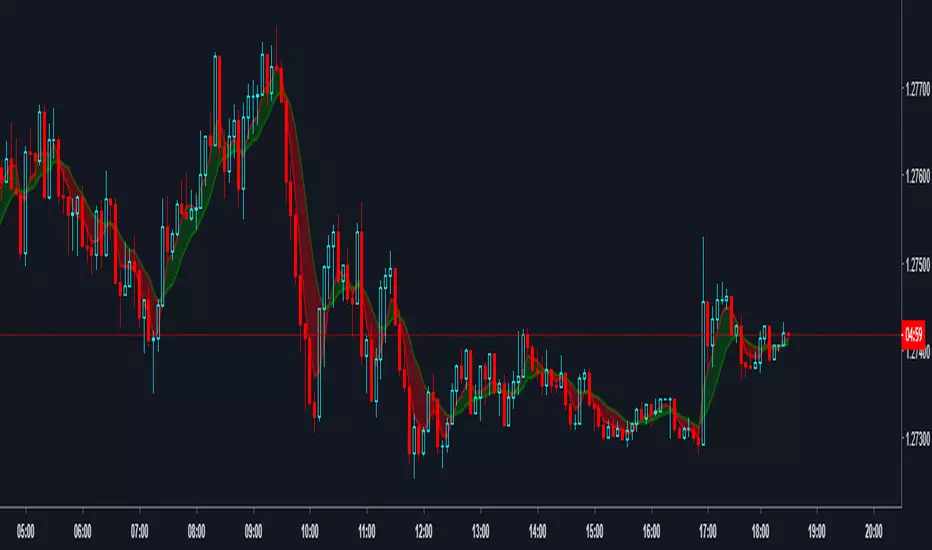
PpSignal Non lag SMAThe zero lag exponential moving average (ZLEMA) indicator was created by John Ehlers and Ric Way.
As is the case with the double exponential moving average (DEMA) and the triple exponential moving average (TEMA) and as indicated by the name, the aim is to eliminate the inherent lag associated to all trend following indicators which average a price over time.
The formula for a given N-Day period and for a given data series is:
{\displaystyle {\textit {Lag}}={(Period-1)/2}} {\textit {Lag}}={(Period-1)/2}
{\displaystyle {\textit {EmaData}}={Data+(Data-Data(Lagdaysago))}} {\displaystyle {\textit {EmaData}}={Data+(Data-Data(Lagdaysago))}}
{\displaystyle {\textit {ZLEMA}}={EMA(EmaData,Period)}} {\textit {ZLEMA}}={EMA(EmaData,Period)}
The idea is do a regular exponential moving average (EMA) calculation but on a de-lagged data instead of doing it on the regular data. Data is de-lagged by removing the data from "lag" days ago thus removing (or attempting to) the cumulative effect of the moving average.
we use simple move average format for calculate this script.

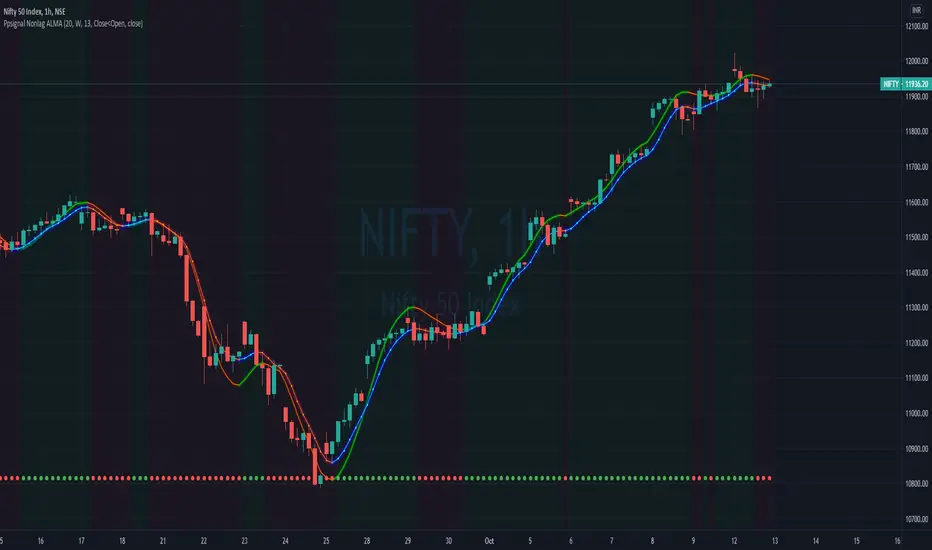
PpSignal Non lag ALMAThe zero lag exponential moving average (ZLEMA) indicator was created by John Ehlers and Ric Way.
As is the case with the double exponential moving average (DEMA) and the triple exponential moving average (TEMA) and as indicated by the name, the aim is to eliminate the inherent lag associated to all trend following indicators which average a price over time.
The formula for a given N-Day period and for a given data series is:
{\displaystyle {\textit {Lag}}={(Period-1)/2}} {\textit {Lag}}={(Period-1)/2}
{\displaystyle {\textit {EmaData}}={Data+(Data-Data(Lagdaysago))}} {\displaystyle {\textit {EmaData}}={Data+(Data-Data(Lagdaysago))}}
{\displaystyle {\textit {ZLEMA}}={EMA(EmaData,Period)}} {\textit {ZLEMA}}={EMA(EmaData,Period)}
The idea is do a regular exponential moving average (EMA) calculation but on a de-lagged data instead of doing it on the regular data. Data is de-lagged by removing the data from "lag" days ago thus removing (or attempting to) the cumulative effect of the moving average.
we use alma ma for calculate this script
PpSignal Non lag LSMAThe zero lag exponential moving average (ZLEMA) indicator was created by John Ehlers and Ric Way.
As is the case with the double exponential moving average (DEMA) and the triple exponential moving average (TEMA) and as indicated by the name, the aim is to eliminate the inherent lag associated to all trend following indicators which average a price over time.
The formula for a given N-Day period and for a given data series is:
{\displaystyle {\textit {Lag}}={(Period-1)/2}} {\textit {Lag}}={(Period-1)/2}
{\displaystyle {\textit {EmaData}}={Data+(Data-Data(Lagdaysago))}} {\displaystyle {\textit {EmaData}}={Data+(Data-Data(Lagdaysago))}}
{\displaystyle {\textit {ZLEMA}}={EMA(EmaData,Period)}} {\textit {ZLEMA}}={EMA(EmaData,Period)}
The idea is do a regular exponential moving average (EMA) calculation but on a de-lagged data instead of doing it on the regular data. Data is de-lagged by removing the data from "lag" days ago thus removing (or attempting to) the cumulative effect of the moving average.
We use Linear regression ma for calculate this script

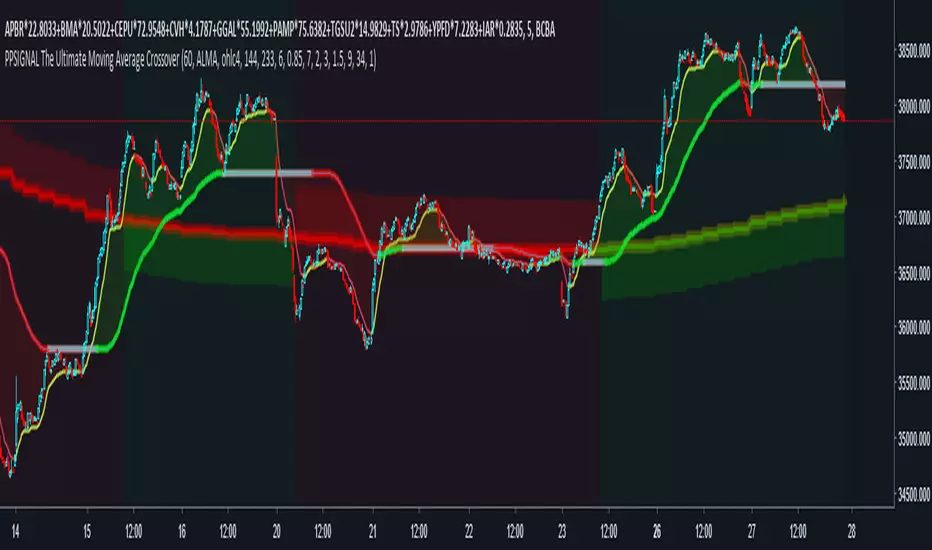
PpSignal The Ultimate Moving Average CrossoverNo matter how many times I explore new concepts, I tend to always incorporate a moving average, or two (if not on price, then on an oscillator). I am going to show the settings I have found to be most beneficial for finding the trend for the ES, forex, crypto etc. First, I have to admit, it is not just a simple crossover. Instead, it is a combination of a MA cross, Multi-Time Frame (MTF), and direction of a normalized moving average.
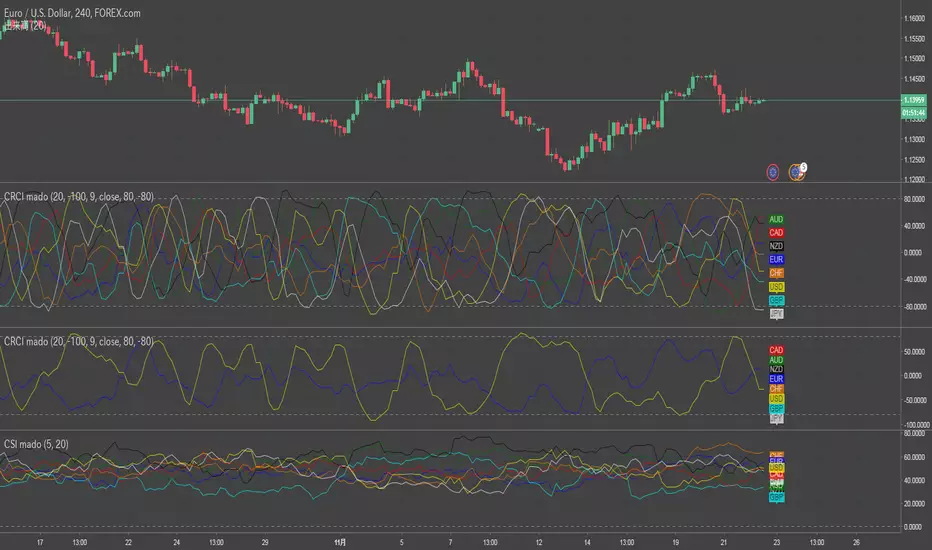
Currency Rank Correlation Index -CRCICurrency Rank Correlation Index based below multi pair RCI average.
compare usd/eur/gbp/aud/jpy/cad/chf/nzd.
Use like Currency Strength Indicator -CSI :)
config label position only.(default 20/-100)
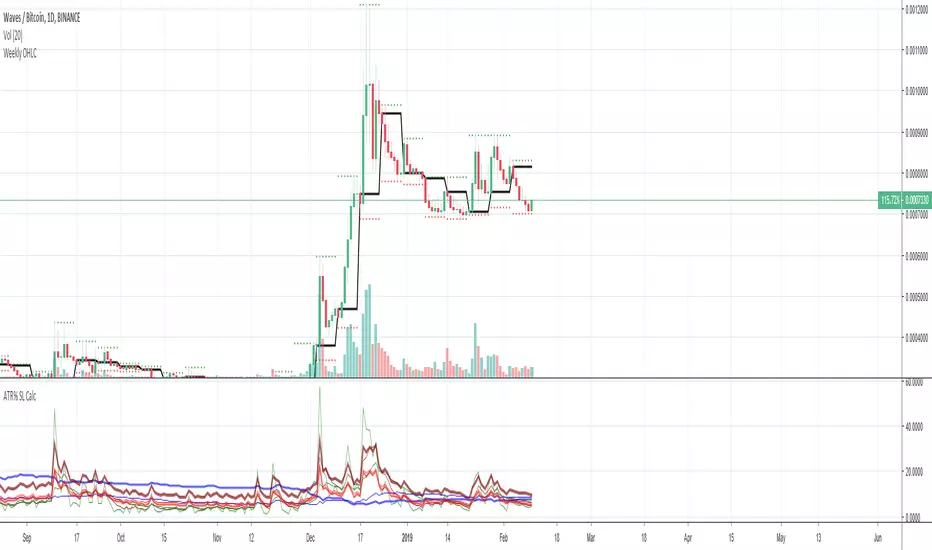
Average True Range Stop Loss CalculatorThis indicator takes the average of a series of ATR to calculate what I would consider an optimum stop loss placement represented in percentage (read below for full overview).
While the data is plotted what is most helpful are the actual numbers presented.
This indicator is most helpful on the daily timeframe but can be used for all timeframes such as the 4HR or 1HR.
This indicator should not be used alone. It should be used in conjunction with proper price action analysis. It’s also a great indicator if you chart using Value Channels. Ideally you want your stop placement to be below at least one core Value Channel boundary range. In addition to standard support and resistance and some key moving averages the market respects. This also works best when trading with the prevailing BIAS of the instrument (bull or bear).
Cryptos: Generally, that means you’re buying on retracements that fit the end of a structured move. The other option is using this in a clear up trending market where the pull backs are clearly being supported with buying.
FOREX: I use this in my FOREX swing trades for my stop placements. Keep in mind I primarily trade my trade system and use this indicator to ensure my stop placements I define based on VCs are within the ATR tolerance. I’ve found that ATR * 1.5 is the best for my trade system.
WTI: Helpful but I have different rules for when I trade WTI. I rely upon VCs and diagnal VCs much more when trading this.
Equities: Helpful but with the increase of volatility as well as uncertainty of Bias of the market-- this should be used as more of a guide than
Indicator Overview:
Value 1 (maroon): 3 Period ATR
Value 2 (green): 7 Period ATR
Value 3 (blue): 30 Period ATR
Value 4 (blue, bold): 90 Period ATR
Value 5 (green): 1 Period ATR
Value 6 – Prime Stop Loss Placement (red): Average of all above ATR multiplied by 1.5
Value 7 (red): Difference between Value 6 (prime stop loss) and current period move. This is an experimental value. Two ways to use this value. Use as a tighter stop loss placement. The other option is to use as a retrace target for purchase and using the Prime Stop Placement value as you’re stop loss.
All ATRs use the LOW price of the period. After testing both the low and close I’ve settled on the low to capture the most volatility you will typically experience.
Once again, this indicator should be used in conjunction with your proven trade system.
Also, by knowing what the values are within the indicator you could just eye ball what would be the best stop placement depending on the ATR or 1 or 2 ATRs you find most represent the volatility of what you are trading.
I will be expanding on this indicator by bringing in average measured moves as well as volume analysis and most likely with color changes and modifications.
Background:
While using and refining my trade system I've noticed that most moves happen in 3 periods. So we start there. The 7 period is good for a 24 hour market such as crypto (although weekend trading can be a hit or miss) and to some extent FOREX. The longer periods of 30 & 90 are to smooth out the data set. The final value of the 1 period is to bring a little more recency to the calculation.
Why multiply the average by 1.5? I've found in my own trading and system I built to be the best placement (in conjunction with VCs) to ensure you're stop isn't to close and is within the instrument you are trading volatility.
I'm looking at making this more intelligent as well as take into account volume and structured moves.


TradingLive24 System XRPUSD This is a script for XRPUSD in 5 minutes resolution.
It will show you when you must to Buy, Sell or Exit from the Crypto.
The strategy has 80% of success. You can modify and adapt it to your requirements.
If you want to have more entries, you only need to modify the parameters 3 and 4, preferably with values less than 20.
Usually, the parameter 4 need to be grater than parameter 3.
The parameters 1 and 2 don't need to be modified, but you can touch them too.
Also, the TakeProfit1 and StopLoss1, usually are greater than TakeProfit2 and StopLoss2.
If you want more success percent, you can modify the TakeProfit with a smaller number.
Get 10-day Free Trial, just send us your TradingView Username here www.tradinglive24.com

TradingLive24 System ETHUSD This is a script for the ETHUSD in 5 minutes resolution.
It will show you when you must to Buy, Sell or Exit from the Crypto.
The strategy has 80% of success. You can modify and adapt it to your requirements.
If you want to have more entries, you only need to modify the parameters 3 and 4, preferably with values less than 20.
Usually, the parameter 4 need to be grater than parameter 3.
The parameters 1 and 2 don't need to be modified, but you can touch them too.
Also, the TakeProfit1 and StoppLoss1, usually are greater than TakeProfit2 and StoppLoss2.
If you want more success percent, you can modify the TakeProfit with a smaller number.
Get 10-day Free Trial, just send us your TradingView Username here www.tradinglive24.com