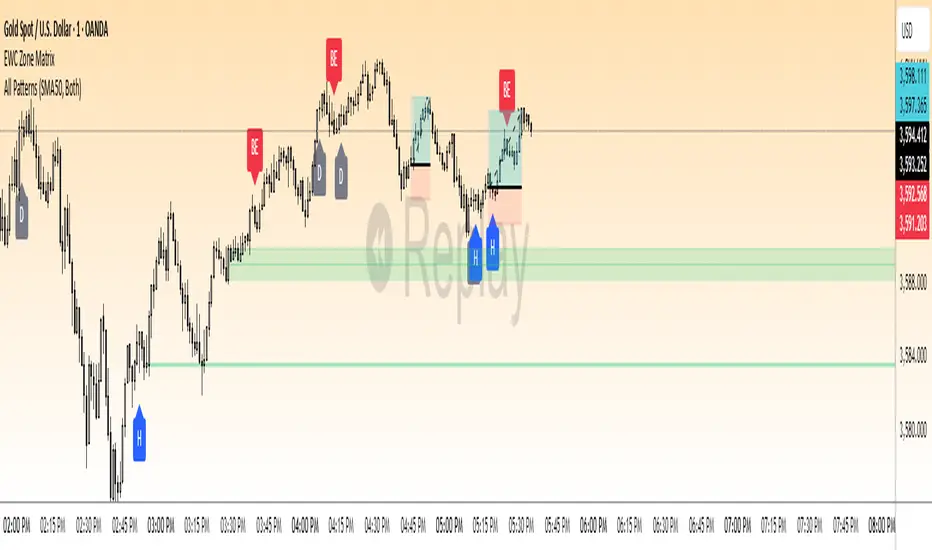
EWC Precision Blocks📌 EWC Precision Blocks
🔎 Overview
EWC Precision Blocks is a professional market analysis tool designed to highlight high-probability trading zones on the chart. Instead of relying on lagging signals, this indicator maps out Alpha Zones (bullish) and Beta Zones (bearish), allowing traders to identify potential market reaction areas with clarity.
The algorithm is built to adapt across Scalp, Swing, and Position trading modes, making it flexible for short-term intraday traders as well as long-term investors.
⚡ Key Features
Multi-Mode Detection – Switch between Scalp, Swing, or Position modes depending on your trading style.
EWC Alpha Zone (Bullish Detection) – Highlights areas where the market may find strong upward momentum.
EWC Beta Zone (Bearish Detection) – Highlights areas where the market may face downward pressure.
Zone Break Tracking – Visualizes when a zone has been invalidated or broken.
Body-Based Detection – Option to base calculations on candle bodies instead of wicks for precision.
Zone Flips – Displays polarity shifts when zones transition from supportive to resistive behavior (and vice versa).
Custom Styling – Full control of zone and break colors for clear chart visualization.
🎯 How to Use
Select Your Mode
Scalp → Designed for fast intraday moves.
Swing → Medium-term setups, ideal for session trading.
Position → Long-term outlook, suitable for investors.
Watch the Alpha Zones
Highlighted bullish areas can serve as potential support or accumulation zones.
Watch the Beta Zones
Highlighted bearish areas may act as resistance or distribution zones.
Monitor Breaks & Flips
Alpha Breaks → Bullish zones failing.
Beta Breaks → Bearish zones failing.
Zone Flips → Polarity changes, often powerful signals.
🛠 Inputs & Customization
EWC Mode → Choose Scalp, Swing, or Position.
Show Last Alpha Zone → Set how many bullish zones to display.
Show Last Beta Zone → Set how many bearish zones to display.
Body-Based Detection → Toggle candle body vs. wick calculation.
EWC Alpha Zone / Beta Zone Styling → Customize zone colors.
Alpha Break / Beta Break Colors → Adjust break visuals.
Show Zone Flips → Enable/disable historical polarity labels.
Status Bar → Display inputs directly in the chart status line.
📈 Best Practices
Works across all timeframes and markets (forex, crypto, indices, stocks).
Combine with your existing strategy for confirmation.
Use in alignment with higher timeframe structure for maximum accuracy.
⚠ Disclaimer
EWC Precision Blocks is a market visualization tool provided for educational purposes only. It does not provide financial advice, signals, or guaranteed results. Always do your own research and manage risk responsibly.
🔹 About EWC
EWC (EastWave Capital) is dedicated to developing professional-grade trading tools and strategies for traders across forex, crypto, commodities, and indices. With over a decade of combined market experience, our mission is to empower traders with precision, clarity, and confidence in their decision-making.
EWC Precision Blocks is one of our flagship tools, reflecting our commitment to innovation, transparency, and trader-focused solutions.
📌 Published by Usama Manzoor — Founder of EastWave Capital (EWC)
Forex
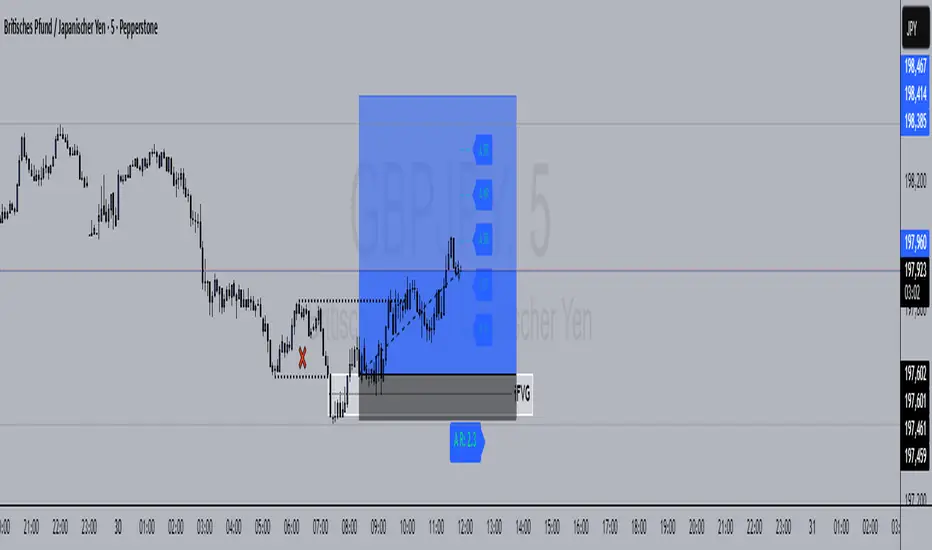
FVG Ultra Assertive - Individual Filters (mtbr)FVG Ultra Assertive - Individual Filters (mtbr)
What this script offers:
This strategy detects and highlights FVGs (Fair Value Gaps) on the chart, providing traders with a visual and systematic approach to identify potential price inefficiencies. The script plots bullish and bearish FVG zones using customizable boxes and labels, allowing users to easily spot high-probability trading areas. In addition, it opens and closes simulated trades based on the detected FVGs, enabling full backtesting and strategy performance evaluation. It integrates multiple independent filters to validate the strength of each FVG signal before entering a trade.
How it works:
The script identifies:
Bullish FVGs when the current low is higher than the high of two bars ago.
Bearish FVGs when the current high is lower than the low of two bars ago.
Once an FVG is detected, it applies three optional independent filters:
GAP/ATR Filter:
Measures the FVG size relative to the Average True Range (ATR). Only gaps exceeding a user-defined multiple of ATR are considered valid.
Support/Resistance (S/R) Filter:
Uses pivot points to check if the FVG overlaps with recent high/low pivot levels within a tolerance percentage. This ensures the gap aligns with meaningful market levels.
Stochastic Filter:
Applies a stochastic oscillator to confirm momentum. Bullish FVGs are validated when stochastic values are oversold, and bearish FVGs when overbought.
After passing the selected filters, the strategy opens trades:
LONG FVG for bullish signals (buy)
SHORT FVG for bearish signals (sell)
The strategy automatically closes positions when an opposite signal appears, generating a backtest report with trades, profits, and statistics. The final bullish or bearish FVG signals are plotted as colored boxes on the chart with labels “BULL FVG” or “BEAR FVG” for immediate visual reference.
How to configure it for use:
Use GAP/ATR Filter: Enable or disable the ATR-based filter and adjust the ATR period (ATR Length) and minimum gap multiplier (Minimum Gap x ATR).
Use S/R Filter: Enable or disable the pivot-based S/R filter. Configure the pivot lookback periods (Pivot Left and Pivot Right) and the tolerance percentage (Gap Tolerance %).
Use Stochastic Filter: Enable or disable stochastic confirmation. Adjust the K and D lengths (Stoch K Length and Stoch D Length) and the overbought/oversold thresholds (Stoch Overbought and Stoch Oversold).
Colors: Customize the colors for bullish and bearish FVGs (FVG Bull and FVG Bear) to match your chart preferences.
Usage Tips:
Apply this strategy to any timeframe; shorter timeframes generate more frequent FVGs, while higher timeframes highlight stronger gaps.
Combine FVG signals with other technical analysis tools for better trade confirmation.
Use the box and label visualization to quickly scan charts for trade opportunities without cluttering the chart.
The strategy’s trades (LONG and SHORT) provide backtesting results and performance statistics for each signal.

Forex Sessions(IST)📌 Forex Sessions (IST Version)
This indicator highlights the four major Forex market sessions — Asia, Frankfurt, London, and New York — automatically adjusted to Indian Standard Time (IST).
Session Timings in IST:
Asia: 02:30 – 10:30
🇩🇪 Frankfurt: 11:30 – 12:30
🇬🇧 London: 12:30 – 21:30
🇺🇸 New York: 17:30 – 02:30 (next day)
Trading Advantages:
Asia session → Spot the range high/low
Frankfurt → Detect inducement moves
London → Identify the main push/trend move
New York → Catch reversals & profit taking
Features:
Clean session highlights with custom colors
Optional tools: range, trendlines, mean, VWAP, max/min levels
Adjustable transparency and display settings
With this, you can easily track session overlaps, volatility shifts, and trade setups — all aligned with IST Forex timings.
Standardized Cumulative Deltas [LuxAlgo]The Standardized Cumulative Deltas tool allows traders to compare the cumulative standardized open-close difference for up to 10 different tickers, allowing them to visualize the general sentiment for all selected tickers.
These results allow the construction of two areas showing the average or extreme bullish and bearish cumulative change for all enabled tickers, providing a summarized view of the overall ticker group sentiment.
🔶 USAGE
This tool is meant to give a full picture of the individuals and/or overall selected tickers, and unlike classical indicators, the displayed series of values is not meant to be directly interpreted over time.
Given the selected lookback period, a majority of observations being above 0 indicate an overall bullish market for the asset.
By default, the auto lookback period feature is enabled, allowing the tool to use all the visible bars for its calculations. Traders can also set the lookback period manually. The above chart uses a fixed lookback period of 500.
Up to 10 tickers can be used. While major cryptocurrencies are set by default, the users can set a specific basket of assets, such as US equities, forex pairs, commodities, etc.
🔹 Densities
The provided areas, here called densities, can be used to get an overall sentiment of the selected tickers. The upper density (bullish) processes positive deltas, while the lower one (bearish) processes negative ones.
Interpretation is subject to the selected "Density Mode".
Average: Densities track the average bullish/bearish cumulative deltas for the selected tickers. For example, a more prominent bullish density would indicate that, on average, cumulative deltas were positive across the tickers.
Envelope: Densities track the extreme values made by bullish/bearish cumulative deltas for the selected tickers. Here, a more prominent density would indicate more volatile bullish/bearish movements, depending on the density.
🔹 Dashboard
The tool features a dashboard with active tickers and their respective colors for traders' convenience.
🔶 DETAILS
🔹 Densities
Densities are obtained by applying a forward-backward exponential moving average on the average, or the highest/lowest cumulative series, depending on the selected Density Mode.
The resulting densities are smoothed by the "Smoothing" parameter located in the Settings panel, with higher values returning smoother envelopes with less variability.
Do note that the smoothing method used here is subject to repainting.
🔶 SETTINGS
Lookback: Select the lookback period and enable/disable the Auto Lookback feature
Tickers: Enable/disable and select up to 10 tickers and their colors
Density Mode: Determine how densities are calculated
🔹 Dashboard
Show Dashboard: Enable/disable the dashboard
Position: Select the dashboard position
Size: Select the dashboard size
🔹 Style
Density: Enable/disable the density areas
Bullish Density: Select the color of the top density area
Bearish Density: Select the color of the bottom density area
Smoothing: Select the smoothing constant for the EMA calculation

DEE's Indicator v2 — Daily Range, Averages & Previous High/Low🇺🇸 English
This indicator is designed to help traders analyze market volatility and daily price ranges.
It includes the following features:
• 5-bar analysis: Shows high-low ranges and percentage changes of the last 5 bars.
• Daily Average Range: Calculates daily average ranges based on the last 5 bars.
• Daily AVG Lines: Plots expected top and bottom range levels based on the daily average.
• Previous Day High/Low: Automatically draws lines from the previous day's high and low.
• Timeframe Separators: Adds visual separators between days, months, and years.
• Optional arrows: Displays arrow markers for the last detected bars used in the calculation.
Use cases:
● Intraday traders can quickly measure daily progress compared to the average daily range.
● Swing traders can identify support/resistance levels from previous daily highs and lows.
● Risk managers can monitor when current volatility deviates significantly from the average.
⚠️ Notes:
The script does not generate buy/sell signals; it provides analytical tools only.
All displayed information is for visual/educational purposes and should be combined with your own trading strategy.
👉 Don’t forget to adjust the settings to suit your needs.
If you are using a multi-chart layout with different timeframes and apply this indicator to each chart, the 5-bar data will be calculated separately based on each chart’s TF. However, the “Daily AVG” section will always show the same value for the 1D timeframe.
🇺🇿 O‘zbekcha
Ushbu indikator treyderlarga bozor volatilligi va kundalik narx diapazonlarini tahlil qilishda yordam berish uchun mo‘ljallangan.
Unda quyidagi funksiyalar mavjud:
• 5-bar tahlili: So‘nggi 5 ta bar diapazoni (high–low) va foiz o‘zgarishini ko‘rsatadi.
• Kundalik o‘rtacha diapazon: So‘nggi 5 ta bar asosida o‘rtacha kundalik diapazonni hisoblaydi.
• AVG Lines: Daily AVGning yuqori va pastki diapazon darajalarini chizadi.
• Oldingi kunning High/Low darajalari: Avtomatik ravishda oldingi kunning high va low darajalarini chizadi.
• Vaqt ajratgichlari: Kunlar, oylar va yillar orasiga vizual ajratgich qo‘shadi.
• Ixtiyoriy strelkalar: Hisoblash uchun foydalanilgan so‘nggi barlarda strelka belgilarini ko‘rsatadi.
Qo‘llanilishi:
● Intraday treyderlar kundalik natijani o‘rtacha kundalik diapazon bilan tezda solishtira olishadi.
● Swing treyderlar oldingi kunning high va low darajalaridan qo‘llab-quvvatlash/qarshilik darajalarini aniqlashlari mumkin.
● Risk-menejerlar hozirgi volatillik o‘rtachadan sezilarli darajada og‘ib ketganini kuzatishlari mumkin.
⚠️ Eslatma:
Ushbu indikator sotib olish/sotish signallarini bermaydi; u faqat tahliliy vosita sifatida ishlatiladi.
Ko‘rsatilgan barcha ma’lumotlar vizual/ta’limiy maqsadlarda mo‘ljallangan bo‘lib, o‘z strategiyangiz bilan birgalikda qo‘llanilishi lozim.
👉 Sozlamalarni ehtiyojlaringizga qarab moslashtirishni unutmang.
Agar siz multi-chart rejimida turli timeframelar bilan ishlasangiz va ushbu indikatorni har bir grafikda qo‘llasangiz, 5 ta bar haqidagi ma’lumotlar har bir grafikning o‘z TFiga qarab hisoblanadi. Ammo “Daily AVG” bo‘limida esa faqat 1D timeframe uchun bir xil qiymat ko‘rsatiladi.
🇷🇺 Русский
Этот индикатор предназначен для помощи трейдерам в анализе волатильности рынка и дневных ценовых диапазонов.
Он включает в себя следующие функции:
• Анализ 5 свечей: Показывает диапазон high–low и процентные изменения последних 5 свечей.
• Средний дневной диапазон: Рассчитывает средний дневной диапазон на основе последних 5 свечей.
• Линии среднего диапазона (AVG Lines): Строит ожидаемые верхние и нижние уровни диапазона на основе среднего дневного значения.
• Максимум/минимум предыдущего дня: Автоматически наносит линии с уровнями high и low предыдущего дня.
• Разделители временных интервалов: Добавляет визуальные разделители между днями, месяцами и годами.
• Опциональные стрелки: Показывает стрелки на последних свечах, использованных в расчётах.
Применение:
● Интрадей-трейдеры могут быстро измерять дневное движение по сравнению со средним дневным диапазоном.
● Свинг-трейдеры могут определять уровни поддержки/сопротивления по максимумам и минимумам предыдущего дня.
● Риск-менеджеры могут контролировать ситуации, когда текущая волатильность значительно отклоняется от среднего.
⚠️ Примечания:
Этот индикатор не генерирует сигналы на покупку/продажу; он предоставляет только аналитические инструменты.
Вся отображаемая информация предназначена для визуальных/образовательных целей и должна использоваться совместно с вашей торговой стратегией.
👉 Не забудьте настроить параметры под свои нужды.
Если вы работаете в режиме мульти-графика с разными таймфреймами и применяете этот индикатор на каждом графике, данные по 5 барам будут рассчитываться отдельно для каждого ТФ. Однако в разделе “Daily AVG” всегда отображается одно и то же значение для таймфрейма 1D.
© Dilshod Nurmatov Shuhratovich | deetradesonline | 2025

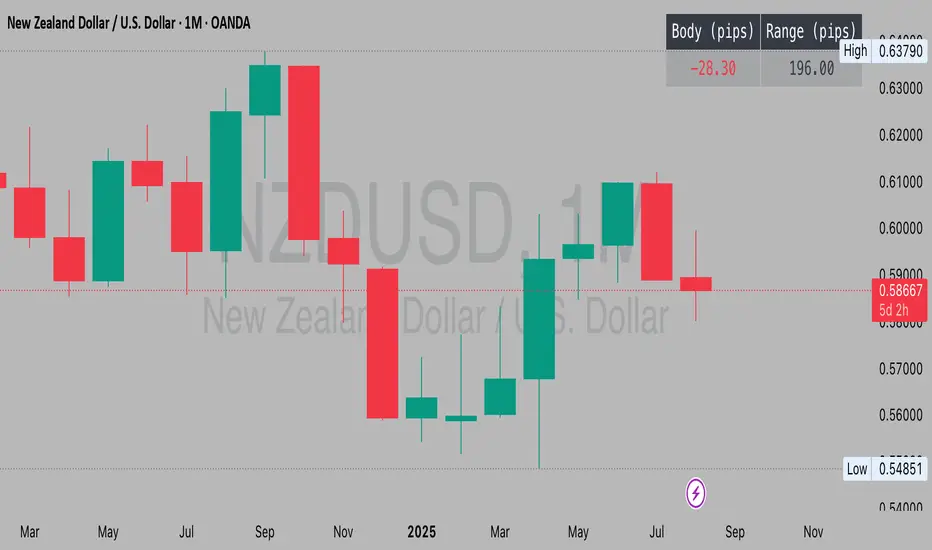
MATEOANUBISANTIDear traders, investors, and market enthusiasts,
We are excited to share our High-Low Indicator Range for on . This report aims to provide a clear and precise overview of the highest and lowest values recorded by during this specific hour, equipping our community with a valuable tool for making informed and strategic market decisions.

Current Bar Pips — Upper Right Quick pip counter for the active candle that shows the pip change in green if positive and red if negative. Also shows the range from wick to wick for the candle.

Current Bar Pips — Upper Right Quick pip counter for Forex pairs. Adds an indicator to top right to show the current candle's pip count in red if negative, green if positive. It will also show the total range of pips for the candle from wick to wick.
ICT Session High/Low LevelsThis indicator automatically plots the Highs and Lows of completed sessions and draws lines for the Asian session and London session. Levels are displayed only after each session has closed. A simple tool for liquidity work and intraday context (SMC/ICT).

samc's FX SESSIONS - on candles So, based on my 8 yrs of experience and over a 2 decade worth of back testing on FX majors pairs one thing i can univocally affirm to the fact that Timing is everything especially in the currency markets.
so i made this indicator to help reduce the noise and focus on signals which is coded by time,
now i made this as GMT+8 in focus but you can adjust based on your requirements.
I classified my indicator colors according to the inter-SESSION High Impact areas only as following :
Primary session colors:
ASIAN - YELLOW
EU - BLUE
US - Magenta (light)
and every first 10 mins of the hour (Great for scalping)
i marked them in a shade of grey.
secondary sessions i marked them as minor sessions.
PRE-EU 1hr of expected trend i marked in color green
and
after hours in a shade of color violet.
so i usually make my candles into light grey by default and remove the body and wicks to minimize the visual stimulus so that this indicator will work great with both dark and light themes and does not obstruct other indicators.
also i made an option to uncheck my naming scheme of session on the top right.

Dual Custom Index with SpreadDual Custom Index with Spread
Create powerful custom indices from any instruments and analyze their relative strength dynamics
Overview
This advanced indicator allows you to build two completely customizable indices from your choice of instruments and analyze their spread relationship. Perfect for inter-market analysis, sector rotation strategies, currency strength comparisons, and sophisticated relative performance studies.
Key Features
🔧 Fully Customizable Index Construction
Build each index from up to 6 instruments with individual weightings
Enable/disable instruments on the fly without losing settings
Automatic weight validation ensures mathematically accurate calculations
Invert functionality for instruments that move opposite to index strength
📊 Advanced ADX-Based Methodology
Uses sophisticated ADX +DI/-DI directional bias calculations
Normalized bias calculation for consistent scaling across different instruments
Optimized default settings for intraday trading with full customization options
Professional-grade smoothing and filtering options
📈 Dual Analysis Modes
Difference Mode: Shows absolute strength difference (Index1 - Index2)
Ratio Mode: Shows relative performance ratio (Index1 / Index2)
Additional spread smoothing for cleaner signals
🎨 Professional Display Options
Custom labels with full color, size, and positioning control
Dynamic "Follow Line" labels that move with your data
Static corner positioning for reference displays
Clean error messaging and validation feedback
Use Cases
Gold Trading: Create gold strength vs USD strength indices for precise market timing
Sector Analysis: Compare technology vs financial sector strength for rotation strategies
Currency Strength: Build custom currency baskets for advanced forex analysis
Commodity Spreads: Analyze relative strength between different commodity groups
Regional Markets: Compare strength between different geographical market indices
Crypto Analysis: Track relative performance between different cryptocurrency sectors
Technical Specifications
Instruments per Index: Up to 6 with individual enable/disable
Weight Validation: Automatic 100% total weight enforcement
Calculation Method: ADX-based directional bias with trend strength weighting
Smoothing Options: Multiple levels of customizable smoothing
Error Handling: Professional validation with clear user feedback
Optimization Tips
Intraday Trading: Use DI Length 3-7 for faster response
Daily Analysis: Use DI Length 10-14 for smoother signals
Noisy Markets: Increase Final Smoothing for cleaner signals
Trending Markets: Lower smoothing values for faster reaction
Perfect for traders who need sophisticated inter-market analysis tools beyond standard indicators. Whether you're analyzing gold vs dollar dynamics, sector rotation opportunities, or custom currency strength relationships, this indicator provides institutional-grade analysis capabilities with complete customization flexibility.

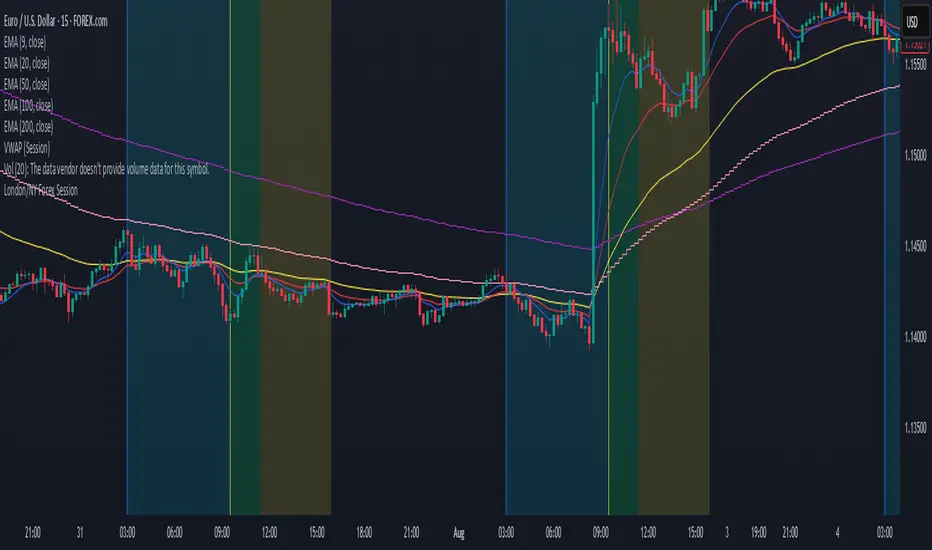
London/NY Forex SessionDesigned for Forex traders who want a clear view of market dynamics.
This tool highlights the most active trading windows of the day, helping you align with institutional moves and avoid low-liquidity periods.
Currency Strength v3.0Currency Strength v3.0
Summary
The Currency Strength indicator is a powerful tool designed to gauge the relative strength of major and emerging market currencies. By plotting the True Strength Index (TSI) of various currency indices, it provides a clear visual representation of which currencies are gaining momentum and which are losing it. This indicator automatically detects the currency pair on your chart and highlights the corresponding strength lines, simplifying analysis and helping you quickly identify potential trading opportunities based on currency dynamics.
Key Features
Comprehensive Currency Analysis: Tracks the strength of 19 currencies, including major pairs and several emerging market currencies.
Automatic Pair Detection: Intelligently identifies the base and quote currency of the active chart, automatically highlighting the relevant strength lines.
Dynamic Coloring: The base currency is consistently colored blue, and the quote currency is colored gold, making it easy to distinguish between the two at a glance.
Non-Repainting TSI Calculation: Uses the True Strength Index (TSI) for smooth and reliable momentum readings that do not repaint.
Customizable Settings: Allows for adjustment of the fast and slow periods for the TSI calculation to fit your specific trading style.
Clean Interface: Features a minimalist legend table that only displays the currencies relevant to your current chart, keeping your workspace uncluttered.
How It Works
The indicator pulls data from major currency indices (like DXY for the US Dollar and EXY for the Euro). For currencies that don't have a dedicated index, it uses their USD pair (e.g., USDCNY) and inverts the calculation to derive the currency's strength relative to the dollar. It then applies the True Strength Index (TSI) to this data. The TSI is a momentum oscillator that is less volatile than other oscillators, providing a more reliable measure of strength. The resulting values are plotted on the chart, allowing you to see how different currencies are performing against each other in real-time.
How to Use
Trend Confirmation: When the base currency's line is rising and above the zero line, and the quote currency's line is falling, it can confirm a bullish trend for the pair. The opposite would suggest a bearish trend.
Identifying Divergences: Look for divergences between the currency strength lines and the price action of the pair. For example, if the price is making higher highs but the base currency's strength is making lower highs, it could signal a potential reversal.
Crossovers: A crossover of the base and quote currency lines can signal a shift in momentum. A bullish signal occurs when the base currency line crosses above the quote currency line. A bearish signal occurs when it crosses below.
Overbought/Oversold Levels: The horizontal dashed lines at 0.5 and -0.5 can be used as general guides for overbought and oversold conditions, respectively. Strength moving beyond these levels may indicate an unsustainable move that is due for a correction.
Settings
Fast Period: The short-term period for the TSI calculation. Default is 7.
Slow Period: The long-term period for the TSI calculation. Default is 15.
Index Source: The price source used for the calculations (e.g., Close, Open). Default is Close.
Base Currency Color: The color for the base currency line. Default is Royal Blue.
Quote Currency Color: The color for the quote currency line. Default is Goldenrod.
Disclaimer
This indicator is intended for educational and analytical purposes only. It is not financial advice. Trading involves substantial risk, and past performance is not indicative of future results. Always conduct your own research and risk management before making any trading decisions.

Apex Edge – Liquidity RaiderApex Edge – Liquidity Raider
The Predator That Hunts Where Retail Never Looks
The Liquidity Raider is not your average liquidity line plotter.
This is an institutional-grade hunting system that tracks the pools of liquidity Smart Money algos stalk — and tells you exactly when price is circling in for the strike.
Where most retail tools simply mark lines, this one acts like a predator:
Scans the chart dynamically to detect clustered highs & lows (pivot-based liquidity zones).
Filters noise with sensitivity & price rounding so you only get real liquidity levels — not every random swing.
Plots live BSL (Buy-Side Liquidity) & SSL (Sell-Side Liquidity) lines in clean dotted format.
Auto-deletes levels when swept, so your chart stays clean and focused.
Triggers directional arrows when price comes within your specified % distance to the target liquidity pool — before the market moves.
EMA confluence layer lets you align with institutional flow (customizable Fast & Slow EMAs).
Core Power
Cluster Logic – Finds high-probability liquidity zones using repeated pivot levels.
Sweep Awareness – Lines vanish the moment liquidity is taken, keeping focus on the next pool.
Proximity Strike Detection – Arrow signals only when price is within striking range.
Directional Clarity – Red arrows = targeting BSL, Green arrows = targeting SSL.
Scalable Across Timeframes – Adapts to your chart’s timeframe with dynamic lookback scaling.
Institutional Flow Filter – Optional EMA confirmation keeps you aligned with the real trend.
How to Use
Identify liquidity pools – Dotted green = buy-side, dotted red = sell-side.
Watch proximity arrows – These mean price is in range and hunting that pool.
Align with EMA bias – Enter only in the direction of institutional momentum.
Target the sweep – Your take profit is where the liquidity is resting.
Why Liquidity Raider Wins
This is not a lagging signal system.
It’s a real-time, clean, predictive tool designed to mimic the targeting logic of high-frequency algos.
By removing swept levels and focusing only on the next available pools, Liquidity Raider keeps you one step ahead of the crowd — and perfectly positioned for the kill shot.

Correlation HeatMap [TradingFinder] Sessions Data Science Stats🔵 Introduction
n financial markets, correlation describes the statistical relationship between the price movements of two assets and how they interact over time. It plays a key role in both trading and investing by helping analyze asset behavior, manage portfolio risk, and understand intermarket dynamics. The Correlation Heatmap is a visual tool that shows how the correlation between multiple assets and a central reference asset (the Main Symbol) changes over time.
It supports four market types forex, stocks, crypto, and a custom mode making it adaptable to different trading environments. The heatmap uses a color-coded grid where warmer tones represent stronger negative correlations and cooler tones indicate stronger positive ones. This intuitive color system allows traders to quickly identify when assets move together or diverge, offering real-time insights that go beyond traditional correlation tables.
🟣 How to Interpret the Heatmap Visually ?
Each cell represents the correlation between the main symbol and one compared asset at a specific time.
Warm colors (e.g. red, orange) suggest strong negative correlation as one asset rises, the other tends to fall.
Cool colors (e.g. blue, green) suggest strong positive correlation both assets tend to move in the same direction.
Lighter shades indicate weaker correlations, while darker shades indicate stronger correlations.
The heatmap updates over time, allowing users to detect changes in correlation during market events or trading sessions.
One of the standout features of this indicator is its ability to overlay global market sessions such as Tokyo, London, New York, or major equity opens directly onto the heatmap timeline. This alignment lets traders observe how correlation structures respond to real-world session changes. For example, they can spot when assets shift from being inversely correlated to moving together as a new session opens, potentially signaling new momentum or macro flow. The customizable symbol setup (including up to 20 compared assets) makes it ideal not only for forex and crypto traders but also for multi-asset and sector-based stock analysis.
🟣 Use Cases and Advantages
Analyze sector rotation in equities by tracking correlation to major indices like SPX or DJI.
Monitor altcoin behavior relative to Bitcoin to find early entry opportunities in crypto markets.
Detect changes in currency alignment with DXY across trading sessions in forex.
Identify correlation breakdowns during market volatility, signaling possible new trends.
Use correlation shifts as confirmation for trade setups or to hedge multi-asset exposure
🔵 How to Use
Correlation is one of the core concepts in financial analysis and allows traders to understand how assets behave in relation to one another. The Correlation Heatmap extends this idea by going beyond a simple number or static matrix. Instead, it presents a dynamic visual map of how correlations shift over time.
In this indicator, a Main Symbol is selected as the reference point for analysis. In standard modes such as forex, stocks, or crypto, the symbol currently shown on the main chart is automatically used as the main symbol. This allows users to begin correlation analysis right away without adjusting any settings.
The horizontal axis of the heatmap shows time, while the vertical axis lists the selected assets. Each cell on the heatmap shows the correlation between that asset and the main symbol at a given moment.
This approach is especially useful for intermarket analysis. In forex, for example, tracking how currency pairs like OANDA:EURUSD EURUSD, FX:GBPUSD GBPUSD, and PEPPERSTONE:AUDUSD AUDUSD correlate with TVC:DXY DXY can give insight into broader capital flow.
If these pairs start showing increasing positive correlation with DXY say, shifting from blue to light green it could signal the start of a new phase or reversal. Conversely, if negative correlation fades gradually, it may suggest weakening relationships and more independent or volatile movement.
In the crypto market, watching how altcoins correlate with Bitcoin can help identify ideal entry points in secondary assets. In the stock market, analyzing how companies within the same sector move in relation to a major index like SP:SPX SPX or DJ:DJI DJI is also a highly effective technique for both technical and fundamental analysts.
This indicator not only visualizes correlation but also displays major market sessions. When enabled, this feature helps traders observe how correlation behavior changes at the start of each session, whether it's Tokyo, London, New York, or the opening of stock exchanges. Many key shifts, breakouts, or reversals tend to happen around these times, and the heatmap makes them easy to spot.
Another important feature is the market selection mode. Users can switch between forex, crypto, stocks, or custom markets and see correlation behavior specific to each one. In custom mode, users can manually select any combination of symbols for more advanced or personalized analysis. This makes the heatmap valuable not only for forex traders but also for stock traders, crypto analysts, and multi-asset strategists.
Finally, the heatmap's color-coded design helps users make sense of the data quickly. Warm colors such as red and orange reflect stronger negative correlations, while cool colors like blue and green represent stronger positive relationships. This simplicity and clarity make the tool accessible to both beginners and experienced traders.
🔵 Settings
Correlation Period: Allows you to set how many historical bars are used for calculating correlation. A higher number means a smoother, slower-moving heatmap, while a lower number makes it more responsive to recent changes.
Select Market: Lets you choose between Forex, Stock, Crypto, or Custom. In the first three options, the chart’s active symbol is automatically used as the Main Symbol. In Custom mode, you can manually define the Main Symbol and up to 20 Compared Symbols.
Show Open Session: Enables the display of major trading sessions such as Tokyo, London, New York, or equity market opening hours directly on the timeline. This helps you connect correlation shifts with real-world market activity.
Market Mode: Lets you select whether the displayed sessions relate to the forex or stock market.
🔵 Conclusion
The Correlation Heatmap is a robust and flexible tool for analyzing the relationship between assets across different markets. By tracking how correlations change in real time, traders can better identify alignment or divergence between symbols and gain valuable insights into market structure.
Support for multiple asset classes, session overlays, and intuitive visual cues make this one of the most effective tools for intermarket analysis.
Whether you’re looking to manage portfolio risk, validate entry points, or simply understand capital flow across markets, this heatmap provides a clear and actionable perspective that you can rely on.

Ultimate Precision Buy/Sell with SL - Clean Labels FIXThis is a premium indicator designed for traders who demand accuracy, simplicity, and clean visual signals.
✅ Key Features:
📈 Precise Buy/Sell entries based on trend confirmation (EMA) and momentum (RSI)
🛡️ Automatic Stop Loss (SL) drawn for every trade, calculated from ATR
🔄 SL line dynamically moves with each new candle to reflect live action
❗ Only one active signal at a time – no clutter, no repaints
⏱ Optimized for 1H timeframe
💰 Best for Forex pairs, Gold (XAUUSD), Silver (XAGUSD), Platinum (XPTUSD)
🧠 How it works:
Buy Signal: When fast EMA > slow EMA & RSI crosses above 30
Sell Signal: When fast EMA < slow EMA & RSI crosses below 70
A single SL line is drawn per trade and remains until either:
Opposite signal appears, or
SL is hit
⚠️ No repainting. No noise. Just precision.
If you want to trade smart, clean and with confidence – this indicator is built for you.

Perfect Order Swing Signals✅ Pullback = Setup
✅ Perfect order = Filter
✅ Candle closing back through 20 EMA = Trigger
- Add other confirmations to your analysis before you enter a trade, dont go based just off the long & short signals.
- Now go make some bread $$

Fractal Market Model [BLAZ]Version 1.0 – Published August 2025: Initial release
1. Overview & Purpose
1.1. What This Indicator Does
The Fractal Market Model is an original multi-timeframe technical analysis tool that bridges the critical gap between macro-level market structure and micro-level price execution. Designed to work across all financial markets including Forex, Stocks, Crypto, Futures, and Commodities. While traditional Smart Money Concepts indicators exist, this implementation analyses multi-timeframe liquidity zones and price action shifts, marking potential reversal points where Higher Timeframe (HTF) liquidity sweeps coincide with Low Timeframe (LTF) price action dynamics changes.
Snapshot details: NASDAQ:GOOG , 1W Timeframe, Year 2025
1.2. What Sets This Indicator Apart
The Fractal Market Model analyses multi-timeframe correlations between HTF structural events and LTF price action. This creates a dynamic framework that reveals patterns observed historically in price behaviour that are believed to reflect institutional activity across multiple time dimensions.
The indicator recognizes that markets move in fractal cycles following the AMDX pattern (Accumulation, Manipulation, Distribution, Continuation/Reversal). By tracking this pattern across timeframes, it flags zones where price action dynamics characteristics have historically shown shifts. In the LTF, the indicator monitors for price closing through the open of an opposing candle near HTF swing highs or lows, marking this as a Change in State of Delivery (CISD), a threshold event where price action historically transitions direction.
Practical Value:
Multi-Timeframe Integration: Connects HTF structural events with LTF execution patterns.
Fractal Pattern Recognition: Identifies AMDX cycles across different time dimensions.
Price Behavior Analysis: Tracks CISD patterns that may reflect historical shifts in order flow commonly associated with institutional activity.
Range-Based Context: Analyses price action within established HTF liquidity zones.
1.3. How It Works
The indicator employs a systematic 5-candle HTF tracking methodology:
Candles 0-1: Accumulation phase identification.
Candle 2: Manipulation detection (raids previous highs/lows).
Candle 3: Distribution phase recognition.
Candle 4: Continuation/reversal toward opposite liquidity.
The system monitors for CISD patterns on the LTF when HTF manipulation candles close with confirmed sweeps, highlighting zones where order flow dynamics historically shifted within the established HTF range.
Snapshot details: FOREXCOM:AUDUSD , 1H Timeframe, 17 to 28 July 2025
Note: The Candle 0-5 and AMDX labels shown in the accompanying image are for demonstration purposes only and are not part of the indicator’s actual functionality.
2. Visual Elements & Components
2.1. Complete FMM Setup Overview
A fully developed Fractal Market Model setup displays multiple analytical components that work together to provide comprehensive market structure analysis. Each visual element serves a specific purpose in identifying and tracking the AMDX cycle across timeframes.
2.2. Core Visual Components
Snapshot details: FOREXCOM:EURUSD , 5 Minutes Timeframe, 27 May 2025.
Note: The numbering labels 1 to 14 shown in the accompanying image are for demonstration purposes only and are not part of the indicator’s actual functionality.
2.2.1. HTF Structure Elements
(1) HTF Candle Visualization: Displays the 5-candle sequence being tracked (configurable quantity up to 10).
(2) HTF Candle Labels (C2-C4): Numbered identification for each candle in the AMDX cycle.
(3) HTF Resolution Label: Shows the higher timeframe being analysed.
(4) Time Remaining Indicator: Countdown to HTF candle closure.
(5) Vertical Separation Lines: Clearly delineates each HTF candle period.
2.2.2. Key Price Levels
(6) Liquidity Levels: High/low levels from HTF candles 0 and 1 representing potential target zones.
(7) Sweep Detection Lines: Marks where previous HTF candle extremes have been breached on both HTF and LTF.
(8) HTF Candle Mid-Levels: 50% retracement levels of previous HTF candles displayed on current timeframe.
(9) Open Level Marker: Shows the opening price of the most recent HTF candle.
2.2.3. Institutional Analysis Tools
(10) CISD Line: Marks the Change in State of Delivery pattern identification point.
(11) Consequent Encroachment (CE): Mid-level of identified institutional order blocks.
(12) Potential Reversal Area (PRA): Zone extending from previous candle close to the mid-level.
(13) Fair Value Gap (FVG): Identifies imbalance areas requiring potential price revisits.
(14) HTF Time Labels: Individual time period labels for each HTF candle.
2.3. Interactive Features
All visual elements update dynamically as new price data confirms or invalidates the tracked patterns, providing real-time market structure analysis across the selected timeframe combination.
3. Input Parameters and Settings
3.1. Alert Configuration
Setup Notifications: Users can configure alerts to receive notifications when new FMM setups form based on their selected bias, timeframes, and filters. Enable this feature by:
Configure the bias, timeframes and filters and other settings as desired.
Toggle the "Alerts?" checkbox to ON in indicator settings.
On the chart, click the three dots menu beside the indicator's name or press Alt + A.
Select "Add Alert" and click “Create” to activate the alert.
3.2. Display Control Settings
3.2.1. Historical Setup Quantity
Setup Display Control: Customize how many historical setups appear on the chart, with support for up to 50 combined entries. The indicator displays both bullish and bearish FMM setups within the selected limit, including invalidated scenarios. For example, selecting "3 setups" will display the most recent combination of bullish and bearish patterns based on the model's detection logic.
Snapshot details: BINANCE:BTCUSD , 1H Timeframe, 27-Feb to 11-Mar 2025
Note: The labels “Setup 1, 2 & 3: Bullish or Bearish” shown in the accompanying image are for demonstration purposes only and are not part of the indicator’s actual functionality.
3.2.2. Directional Bias Filter
Bias Filter: Control which setups are displayed based on directional preference:
Bullish Only: Shows exclusively upward bias setups.
Bearish Only: Shows exclusively downward bias setups.
Balanced Mode: Displays both directional setups.
This flexibility helps align the indicator's output with broader market analysis or trading framework preferences. The chart below illustrates the same chart in 3.2.1. but when filtered to show only bullish setups.
Snapshot details: BINANCE:BTCUSD , 1H Timeframe, 27-Feb to 11-Mar 2025
Note: The labels “Setup 1, 2 & 3: Bullish” shown in the accompanying image are for demonstration purposes only and are not part of the indicator’s actual functionality.
3.2.3. Invalidated Setup Display
Invalidation Visibility: A setup becomes invalidated when price moves beyond the extreme high or low of the Manipulation candle (C2), indicating that the expected fractal pattern has been disrupted. Choose whether to display or hide setups that have been invalidated by subsequent price action. This feature helps maintain chart clarity while preserving analytical context:
Amber Labels: Setups invalidated at Candle 3 (C3).
Red Labels: Setups invalidated at Candle 4 (C4).
Count Preservation: Invalidated setups remain part of the total setup count regardless of visibility setting.
Below image illustrates balanced setups:
Left side: 1 bearish valid setup, with 2 invalidated setups visible.
Right side: 1 bearish valid setup, with 2 invalidated setups hidden for chart clarity.
Snapshot details: FOREXCOM:GBPJPY , 5M Timeframe, 30 July 2025
3.3. Timeframe Configuration
3.3.1. Multi-Timeframe Alignment
Custom Timeframe Selection: Configure preferred combinations of Higher Timeframe (HTF) and Lower Timeframe (LTF) for setup generation. While the indicator includes optimized default alignments (1Y –1Q, 1Q –1M, 1M –1W, 1M –1D, 1W–4H, 1D–1H, 4H-30m, 4H –15m, 1H –5m, 30m –3m, 15m –1m), users can define custom HTF-LTF configurations to suit their analysis preferences and market focus.
The image below illustrates two different HTF – LTF configuration, both on the 5 minutes chart:
Right side: Automatic multi-timeframe alignment, where the indicator autonomously sets the HTF pairing to 1H when the current chart timeframe is the 5 minutes.
Left side: Custom Timeframe enabled, where HTF is manually set to 4H, and LTF is manually set to 15 minutes, while being on the 5 minutes chart.
Snapshot details: FOREXCOM:GBPJPY , 5 minutes timeframe, 30 July 2025
3.3.2. Session-Based Filtering
Visibility Filters: Control when FMM setups appear using multiple filtering options:
Time-Based Controls:
Show Below: Limit setup visibility to timeframes below the selected threshold.
Use Session Filter: Enable session-based time window restrictions.
Session 1, 2, 3: Configure up to three custom time sessions with start and end times.
These filtering capabilities help concentrate analysis on specific market periods or timeframe contexts.
The image below illustrates the application of session filters:
Left side: The session filter is disabled, resulting in four setups being displayed throughout the day—two during the London session and two during the New York session.
Right side: The session filter is enabled to display setups exclusively within the New York session (8:00 AM – 12:00 PM). Setups outside this time window are hidden. Since the total number of setups is limited to four, the indicator backfills by identifying and displaying two qualifying setups from earlier price action that occurred within the specified New York session window.
Snapshot details: COMEX:GC1! , 5 minutes Timeframe, 29 July 2025
3.4. Annotation Systems
3.4.1. Higher Timeframe (HTF) Annotations
HTF Display Control: Enable HTF visualization using the "HTF candles" checkbox with quantity selector (default: 5 candles, expandable to 10). This displays all HTF elements detailed in the Visual Components section 2.2. above.
Customisation Categories:
Dimensions: Adjust candle offset, gap spacing, and width for optimal chart fit.
Colours: Customize body, border, and wick colours for bullish/bearish candle differentiation.
Style Options: Control line styles for HTF opens, sweep lines, and equilibrium levels.
Feature Toggles: Enable/disable Fair Value Gaps, countdown labels, and individual candle labelling.
All HTF annotation elements support individual styling controls to maintain visual clarity while preserving analytical depth. The image below shows two examples: the left side has customized styling applied, while the right side shows the default appearance.
Snapshot details: CME_MINI:NQ1! , 5 minutes Timeframe, 29 July 2025
3.4.2. Lower Timeframe (LTF) Annotations
LTF Display Control: Comprehensive annotation system for detailed execution analysis, displaying all LTF elements outlined in the Visual Components section 2.2. above.
Customization Categories:
Core Elements: Control HTF separation lines, sweep markers, CISD levels, and candle phase toggles (C2, C3, C4) to selectively show or hide the LTF annotations for each of these specific HTF candle phases.
Reference Levels: Adjust previous equilibrium lines, CISD consequent encroachment, and HTF liquidity levels.
Analysis Tools: Enable potential holding area (PHA) markers.
Styling Options: Individual visibility toggles, colour schemes, line styles, and thickness controls for each element.
All LTF components support full customization to maintain chart clarity while providing precise execution context. The image below shows two examples: the left side has customized styling applied, while the right side shows the default appearance.
Snapshot details: TVC:DXY , 5 minutes Timeframe, 28 July 2025
3.5. Performance Considerations
Higher setup counts and extended HTF displays may impact chart loading times. Adjust settings based on device performance and analysis requirements.
4. Closed-Source Protection Justification
4.1. Why This Indicator Requires Protected Source Code
The Fractal Market Model is the result of original research, development, and practical application of advanced price action frameworks. The indicator leverages proprietary algorithmic systems designed to interpret complex market behavior across multiple timeframes. To preserve the integrity of these innovations and prevent unauthorized replication, the source code is protected.
4.1.1. Key Proprietary Innovations
Real-Time Multi-Timeframe Correlation Engine: A dynamic logic system that synchronizes higher timeframe structural behaviour with lower timeframe execution shifts using custom correlation algorithms, adaptive thresholds, and time-sensitive conditions, supporting seamless fractal analysis across nested timeframes.
CISD Detection Framework: A dedicated mechanism for identifying Change in State of Delivery (CISD), where price closes through the open of an opposing candle at or near HTF swing highs or lows after liquidity has been swept. This is used to highlight potential zones of directional change based on historical order flow dynamics.
Fractal AMDX Cycle Recognition: An engineered structure that detects and classifies phases of Accumulation, Manipulation, Distribution, and Continuation/Reversal (AMDX) across configurable candle sequences, allowing traders to visualize market intent within a repeatable cycle model.
Dynamic Invalidation Logic: An automated monitoring system that continually evaluates the validity of active setups. Setups are invalidated in real time when price breaches the extreme of the manipulation phase (C2), ensuring analytical consistency and contextual alignment.
4.1.2. Community Value
The closed-source nature of this tool protects the author’s original intellectual property while still delivering value to the TradingView community. The indicator offers a complete, real-time visual framework, educational annotations, and intuitive controls for analysing price action structure and historically observed patterns commonly attributed to institutional behaviour across timeframes.
5. Disclaimer & Terms of Use
This indicator, titled Fractal Market Model , has been independently developed by the author based on their own study, interpretation, and practical application of the smart money concepts. The code and structure of this indicator are original and were written entirely from scratch to reflect the author's unique understanding and experience. This indicator is an invite-only script. It is closed-source to protect proprietary algorithms and research methodologies.
This tool is provided solely for educational and informational purposes. It is not intended—and must not be interpreted—as financial advice, investment guidance, or a recommendation to buy or sell any financial instrument. The indicator is designed to assist with technical analysis based on market structure theory but does not guarantee accuracy, profitability, or specific results.
Trading financial markets involves significant risk, including the possibility of loss of capital. By using this indicator, you acknowledge and accept that you are solely responsible for any decisions you make while using the tool, including all trading or investment outcomes. No part of this script or its features should be considered a signal or assurance of success in the market.
By subscribing to or using the indicator, you agree to the following:
You fully assume all responsibility and liability for the use of this product.
You release the author from any and all liability, including losses or damages arising from its use.
You acknowledge that past performance—real or hypothetical—does not guarantee future outcomes.
You understand that this indicator does not offer personalised advice, and no content associated with it constitutes a solicitation of financial action.
You agree that all purchases are final. Once access is granted, no refunds, reimbursements, or chargebacks will be issued under any circumstance.
You agree to not redistribute, resell, or reverse engineer the script or any part of its logic.
Users are expected to abide by all platform guidelines while using or interacting with this tool. For access instructions, please refer to the Author's Instructions section or access the tool through the verified vendor platform.

Multi-Timeframe Confluence Indicator - 4 Timeframes, No Guessing🎯 Multi-Timeframe Confluence Indicator (FREE)
Stop Trading Blind - See All Timeframes at Once!
Why do 87% of traders fail? They trade against the bigger trend. This indicator changes that.
✨ What You Get:
- 4 Timeframe Analysis (Current/15m/1H/4H) in ONE view
- Smart Confluence Zones - Know exactly where to trade
- Non-Repainting Signals - What you see stays
- Live Confluence Table - All timeframes at a glance
- Professional Alerts - Never miss high-probability setups
📊 How It Works:
1. TREND: 50/200 EMA across timeframes
2. MOMENTUM: RSI confirmation
3. SCORE: -8 to +8 confluence rating
Strong signals only appear when MULTIPLE timeframes agree!
🎯 Signal Types:
- 💚 STRONG BUY (Score 6+)
- 🟢 BUY (Score 3-5)
- 🔴 SELL (Score -3 to -5)
- ❤️ STRONG SELL (Score -6 or less)
⚡ Perfect For:
- Beginners (simple, visual)
- Scalpers (avoid counter-trend trades)
- Swing traders (catch big moves)
- All markets (Crypto/Forex/Stocks)
🎁 100% FREE - No Hidden Fees!
Professional-grade tool. No strings attached.
Add now and trade with the confidence of seeing the complete market picture!
---
Works on: BTC, ETH, ES, NQ, Major FX Pairs
Best results on liquid instruments
⬇️ FOLLOW for more free indicators!
Quality Buy/Sell Indicator with Scalping Mode + SL OnlyQuality Buy/Sell Indicator with Scalping Mode + SL Only is designed for traders who want clean and reliable signals for both swing and scalping strategies.
✅ Features:
Buy & Sell signals based on EMA and MACD logic
Scalping Mode (switch ON for faster, more frequent signals)
SL (Stop Loss) line displayed for every trade for easy risk management
Clean chart – no TP1, TP2, TP3 clutter
Option to show only the latest signal or the entire signal history
✅ How it works:
In normal mode you get fewer, more reliable signals – perfect for intraday or swing trading.
In scalping mode the indicator generates more signals for short-term trades (1–15m charts).
The Show All Signals switch allows you to keep the entire history visible, or only the latest trade setup for maximum clarity.
✅ Best suited for:
Traders who want clean charts without TP lines
Intraday and scalping traders looking for multiple setups per session
Swing traders who prefer clear Buy/Sell with risk control

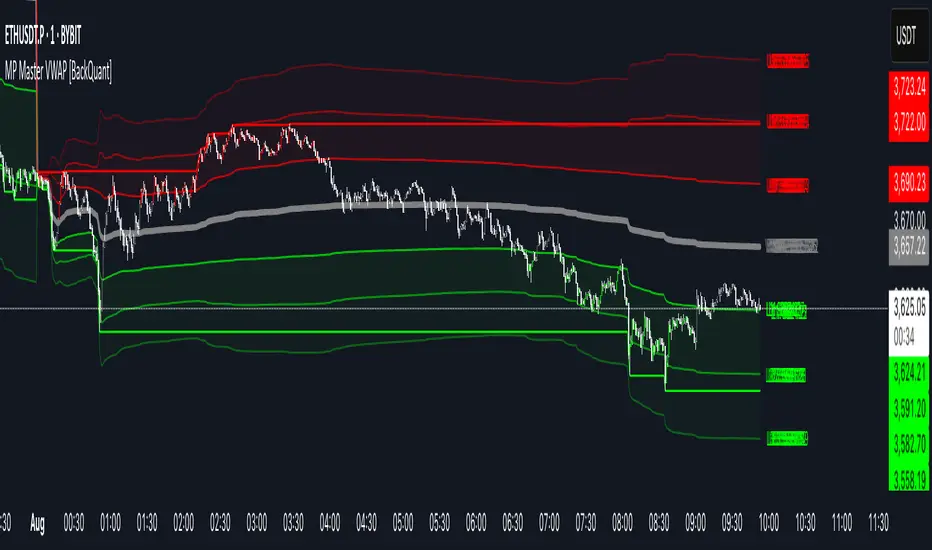
MP Master VWAP [BackQuant]MP Master VWAP
Overview
MP Master VWAP is an, volume-weighted average price suite. It re-anchors automatically to any time partition you select—Day, Week, Month, Quarter or Year—and builds an adaptive standard-deviation envelope, optional pivot clusters and context-aware candle colouring so you can read balance, imbalance and auction edges in a single glance. We use private methods on calculating key levels, making them adaptive and more responsive. This is not just a plain VWAP.
Key Components
• Anchored VWAP core – The engine resets VWAP the instant a new session for the chosen anchor begins. Separator lines and a live high–low box make those rotations obvious.
• Dynamic sigma bands – Three upper and three lower bands, scaled by real-time standard deviation. 1-σ filters noise, 2-σ marks momentum, 3-σ flags exhaustion.
• Previous-period memory – The prior session’s VWAP and bands stay on-screen in a muted style so you can trade retests of last month’s value without clutter.
• High-precision price labels – VWAP and every active band print their prices on the hard right edge; labels vanish if you want a cleaner chart.
• Pivot package – Choose Traditional, Fibonacci or Camarilla calculations on a Daily, Weekly or Monthly look-back. Levels plot as subtle circles that complement, not compete with, the VWAP map.
• Context candles – Bars tint relative to their location: vivid red above U2, soft red between U1-U2, neutral grey inside value, soft green between L2-L1, vivid green below L2.
Customisation Highlights
Period section
• Anchor reset drop-down
• Toggles for separator lines and period high/low
Band section
• Independent visibility for L1/U1, L2/U2, L3/U3
• Individual multipliers to fit any volatility profile
• Optional real-time price labels
Pivot section
• Three formula choices
• Independent timeframe—mix a Monthly VWAP with Weekly Camarilla for confluence
Visual section
• Separate switches for current vs previous envelopes
• Candle-colour toggle for traders who prefer raw price bars
Colour section
• Full palette selectors to match dark or light themes instantly
Some Potential Ways it can be used:
Mean-reversion fade – Price spikes into U2 or U3 and stalls (especially at a pivot). Fade back toward VWAP; scale out at U1 and VWAP.
Trend continuation – Close above U1 on rising volume; trail a stop behind U1. Mirror setup for shorts under L1.
Breakout validation – Session gaps below previous VWAP but quickly reclaims it. Use the cross-above alert to automate entry and target U1 / U2.
Overnight inventory flush – Globex extremes that tag L2 / U2 often reverse at the cash open; scalp rotations back to VWAP.
Risk framing – Let the gap between VWAP and L2 / U2 dictate position size, keeping reward-to-risk consistent across assets.
Alerts Included
• Cross above / below current VWAP
• Cross first sigma bands (U1 / L1)
• Break above second sigma bands (U2) or below L2
• Touch of third sigma bands (U3 / L3)
• Cross of previous-period VWAP
• New period high or low
Best Practices
• Tighten sigma multipliers on thin-liquidity symbols; widen them on index futures or high-cap crypto.
• Pair the envelope with order-flow or footprint tools to confirm participation at band edges.
• On intraday charts, anchor a higher-timeframe VWAP (e.g., Monthly on a 15-minute) to reveal institutional accumulation.
• Treat the previous period’s VWAP as yesterday’s fair value—gaps that never revisit it often morph into trend days.
Final Notes
MP Master VWAP condenses auction-market theory into one readable overlay: automatic period resets, adaptive deviation bands, historical memory, multi-style pivots and self-explanatory colour coding. You can deploy it on equities, futures, crypto or FX—wherever volume meets time, VWAP remains the benchmark of true price discovery.
Official USD Staggered Bands - ArgentinaOfficial USD Staggered Bands - Argentina
The Central Bank, under the administration of Javier Milei (La Libertad Avanza), announced on Friday, April 11, 2025, a series of measures to eliminate the so-called "exchange rate restriction."
In this new phase, the dollar's exchange rate on the Free Exchange Market (MLC) will be able to fluctuate within a band between $1,000 and $1,400 , the limits of which will be expanded at a rate of 1% monthly.
The lines evolve daily, increasing as the public administration predicts. This way, you can know the likelihood of a Central Bank intervention to correct the variation and return the peso to a price within the band.
The script runs under the ticker USDARS

R Manager PRO++ – Multi-Setup Risk/Reward ToolDescription
The R Manager PRO++ V1.3d is an advanced risk/reward management tool designed for traders who want to visually plan, track, and manage multiple trade setups directly on their charts.
This script allows you to plot up to three independent setups (A, B, and C) simultaneously. For each setup, you can manually input your Entry and Stop Loss levels, and the tool will automatically calculate and display R-multiple levels (1R to 5R), providing a clear overview of your potential profit targets.
Key Features
Multi-Setup Management (A, B, C)
Track up to three separate trades at the same time, each with individual colors and controls.
Manual Entry & Stop Loss Input
Enter your trade levels manually for flexible usage across any market or strategy.
Automatic R-Multiple Calculation (1R to 5R)
The indicator automatically draws lines and labels for 1R to 5R targets based on your risk distance.
Live R Display
Real-time calculation of your current R multiple, updating with every price move.
Custom Symbol Selection
Link each setup to a specific symbol (e.g., EURUSD, XAUUSD, NAS100) to manage multiple markets without clutter.
Reset Function
One-click reset button to quickly clear individual setups.
Alerts for Reached R-Levels
Receive alerts when price reaches each R level (1R to 5R) to monitor trades without constant chart-watching.
How to Use
- Select Entry and Stop Loss levels manually in the input panel.
- Choose the symbol for each setup (supports Forex, Indices, Gold).
- Enable or disable setups individually with the Activate checkbox.
- Optional: Use the Reset button to clear a setup quickly.
- Monitor R-multiples visually and via alerts as price evolves.
Suitable For
- Swing traders
- Day traders
- Risk-based trading strategies (R-multiples)
- Multi-market portfolio management