PpSignal Trazan MT4 System TARZAN -
indicator for MetaTrader 4 is now in tradingview version indicator and the essence of the Forex indicator is to transform the accumulated history data.
TARZAN - provides an opportunity to detect various peculiarities and patterns in price dynamics that are invisible to the naked eye. Based on this information, traders can further take on the price movement and adjust their strategy accordingly.
Buy when the rsi cross above move average (ma lime color).
Sell when the price cross below move average (red MA)
we ade additional tips like rsi in candle mode, oversold and overbought level.
Forex

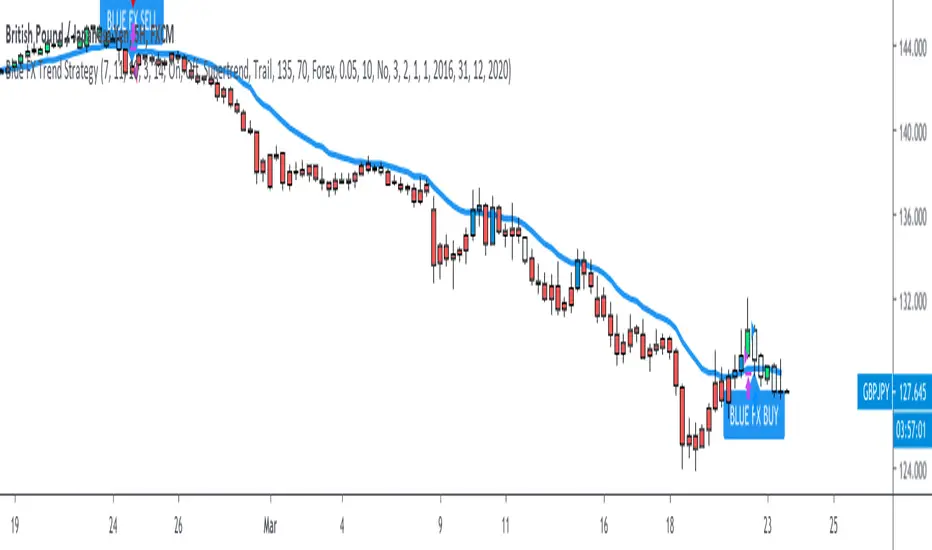
Blue FX Trend StrategyHi, welcome to the Blue FX Trend Strategy Script.
What does it do?
Our strategy will help you identify the current trend in the markets and highlight when this is changing. The strategy itself is based upon 4 indicators lining up in total confluence to increase the probability of the trade being a success, this is specifically an EMA, MACD settings, Supertrend criteria and also Momentum.
Absolutely no technical analysis is needed to trade this successfully - this can be used on all time frames and all pairs - obviously with varying profitability as all pairs work differently - this can be reviewed quickly in 'Strategy Tester' to hone in on your own desired settings.
When all criteria is in alignment the strategy will convert all candles to the relevant colour - Green for an uptrend and Red for a downtrend; a candle that is printed normally simply shows that no current trend is in place to warrant a colour change. A normal coloured candle could possibly indicate a change in current market direction or the market consolidating before a further move in the initial direction. When a new signal is valid 'Blue FX Buy'' or 'Blue FX Sell' will be displayed and the small arrow shown on candle open for entry.
How do I use it?
Our strategy is invite only - upon joining our group we will allow you access to the script. This will then simply display on your device ready for you to start trading from. There is substantial functionality within the strategy, you can;
See the success of the default settings in the past using the 'Strategy Tester' Function for numerous settings
1. Following the settings 'Trail'
2. Changing your TP function with the other criteria listed
3. Using a Fixed TP or SL function
Upon changing the Script to 'Fixed' you will see numerous trades on the chart displayed differently.
Scaling into a profitable position is also possible - this is ideally done when the candle colour confirms the trend is continuing after rejection/support from the EMA; we show this below;
You could also enter here if you missed the initial sell signal, we have MA rejection and a red printed candle indicating all confluences are in play and we have high probability for the move to continue.
How do I know its profitable?
We have built numerous customisable settings into the strategy for you to see that this is profitable - you can visually see this too. The settings are also customisable to find the right criteria for the right pair on the right time-frame. Ultimately, with the strategy confluences in place, you are putting probability in your favour and can quickly determine the trend in place if there is one. Within the customisable settings there is a compound function too, so if you were to compound your profit the results can be exceptional.
We have also added an H4 confluence, so you can ensure if trading on a lower time-frame you are in the overall direction of the H4 trend too, a useful setting for more confluence again.
Where do I set my Stop loss or Take Profit?
There is no right or wrong to this and we have attempted to build numerous ways of doing this into the strategy for reference.
For setting a SL you could;
1. Use a fixed SL.
2. Place the SL below the last high or low in the trend.
3. Use an ATR function.
4. Place the SL 5 pips below the last 3 candles.
5. Or, trail the price if you are on screen until the next signal is given and a new trend starts - although unless a big trend, you may miss out on some profit by the time price has pulled back.
For placing a Take Profit, you could;
1. Use a fixed TP.
2. Look for the next supply/demand area on the chart (if it breaks and candle colour supports direction - you could enter again).
3. Use an ATR function.
5. Or, trail the price if you are on screen until the next signal is given and a new trend starts - although unless a big trend, you may miss out on some profit by the time price has pulled back.
6. Secure multiple TPs - 20/50/100 pips with Stop loss to entry after the first target is hit.
Here are some examples of the Buy and Sell signals in action;
Will also work on Commodities and Indices as shown below too;
Our recommended visual settings are below;
1. Set to'Trail' Strategy
2. Under 'Style' tab, select Trades on Chart, but un-select both Signal Labels and Quantity to clean up the chart - these settings are useful when testing to see where the trades are opened and closed.
3. We like the candles changing colour to the trend and criteria set however, these can be turned off to display normal bullish and bearish candles.
When reviewing profitability you can do this by selecting 'Overview' 'Performance Summary' and 'List of Trades'.
Please consider that the settings based into the strategy could differ to your own money management rules and your management of your SL and TP as outlined above - we have tried to cover as many bases as possible here.
We look forward to you using this strategy to profit from the market, please share your feedback and results with us.
Kind regards
Blue FX Team
Uber Kuskus Starlight [UTS]General Usage
The Kuskus Starlight is a Zero-Line Indicator that produces signals based on zero line cross.
It is designed to offer traders the much needed information on trend direction. Just like the name suggests, the indicator produces starlight shaped bodies to form a slope that runs above or below the zero reference level.
Interestingly, the starlight shaped bodies are seen to alter their color between blue (when the starlight shaped bodies are above the zero reference level) and red (when the starlight shaped bodies are below the zero signal level).
Buy Signal
Buy Signal
Go long when the blue starlights get above the zero signal level.
Sell Signal
Go short when the red starlights go below the zero signal level.
Exit buy trade
Close all buy orders if while a bullish trend is ongoing, the Kuskus Starlight Indicator pops up a red starlight slightly below the zero level.
Exit sell trade
Close all sell orders if while a bearish trend is running, the Kuskus Starlight Indicator displays a blue starlight somewhat above the zero level.
Styles
Four different styles are available:
Original Starlight
Area Chart
Histograms
Line Chart
Line Chart
Signals
The (alert-) signal generating line crosses can optionally be shown.
Alerts
Traders can easily use the trend change signals to trigger alerts from:
Up Signal
Down Signal
Those values are > zero if a condition is triggered.
Alert condition example: "Up Signal" - "GreaterThan" - "0"

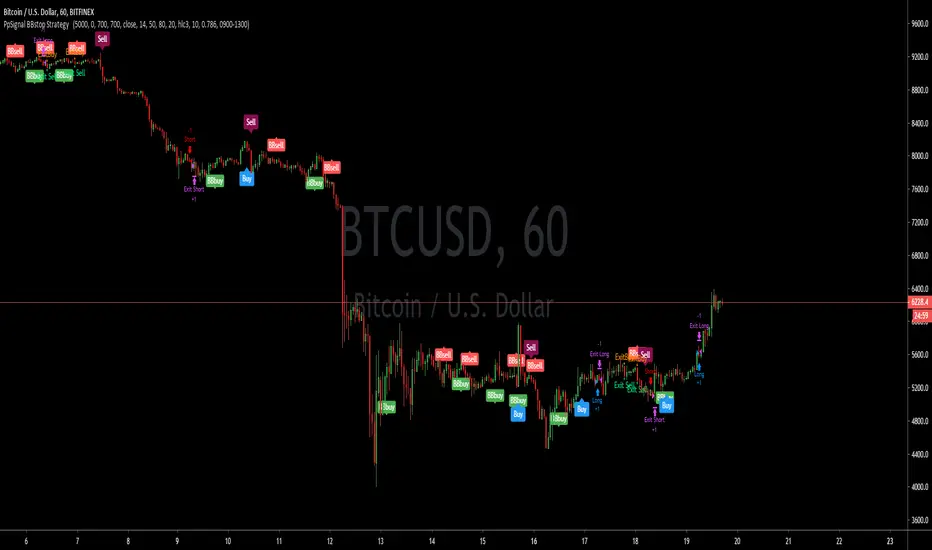
PpSignal BBstop Strategy strategy based on rsi of ma, in the example with btc usd we have as tp 1000 trailing stop 700, but you should adopt the money management to your criteria.
it has an alarm system when you see bbbuy or bbsell is a pre-notice only buy when the signal is Buy in blue or sell in maroon, it also has a buy exit and sell exit warning.
Reticulata Enhanced - StudyBuilding on our core script - Reticulata, the enhanced version features several requested extras to give you more flexibility with your trading style.
What is Reticulata Enhanced?
The Reticulata core leverages a blend of MA/RSI strategies mixed with the BBB optimised logic for risk management. This enhanced version takes it a step further with additional risk management features:
Trailing Stop
Fixed Stop
Fixed Stop, but move at TP
Trend confirmation
Usage
Using the indicator is as simple as:
1. Select the strategy, or combination of strategies you want to use
2. If desired, select one or more of the available trend filters
3. Adjust your stop options
4. Review backtest results
Markets
Like the core, the enhanced algo also supports a range of markets and timeframes, including the majors ( EURUSD , etc...) in Forex and a variety of Cryptocurrencies including Bitcoin (BTC/XBT etc...).
All of our scripts are designed for manual traders but are ready to use with automated trading bots.
PM us to obtain access.

Reticulata Enhanced - StrategyThis script is the backtesting for Reticulata Enhanced.
Building on our core script - Reticulata, the enhanced version features several requested extras to give you more flexibility with your trading style.
What is Reticulata Enhanced?
The Reticulata core leverages a blend of MA/RSI strategies mixed with the Bull Bear Bots optimised logic for risk management. This enhanced version takes it a step further with additional risk management features:
Trailing Stop
Fixed Stop
Fixed Stop, but move at TP
Trend confirmation
Usage
Using the indicator is as simple as:
1. Select the strategy, or combination of strategies you want to use
2. If desired, select one or more of the available trend filters
3. Adjust your stop options
4. Review backtest results
Markets
Like the core, the enhanced algo also supports a range of markets and timeframes, including the majors (EURUSD, etc...) in Forex and a variety of Cryptocurrencies including Bitcoin (BTC/XBT etc...).
All of our scripts are designed for manual traders but are ready to use with automated trading bots.

PpSignal drake delay oscillator GritasIt is a technique, when the drake oscillator moving averages (Drake Daly Statocastico) cross up you must buy and the histogram is painted in a green color .... when the drake oscillator crosses down and the histogram is painted red you must to sell.

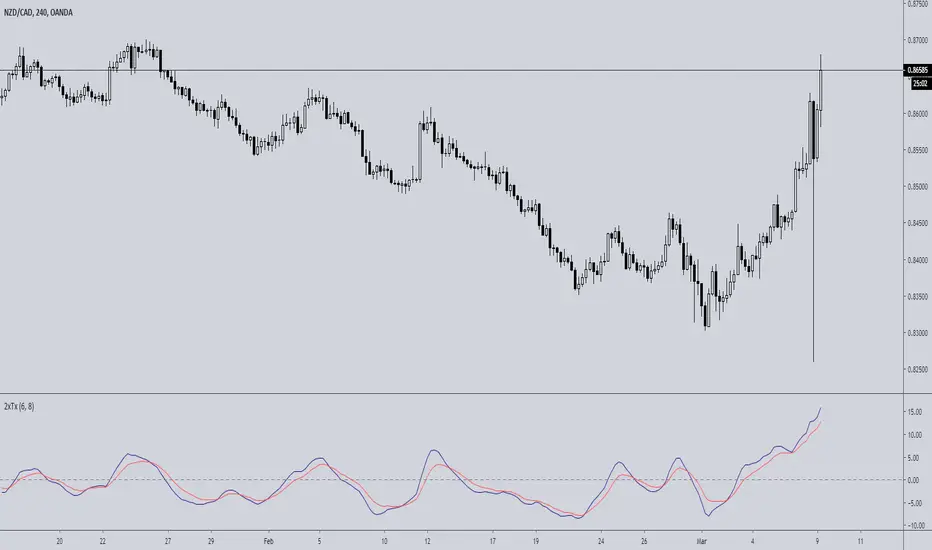
Double TRIX CrossoverTRIX is a great indicator to use on zero cross setups.... know what's even better? TRIX CROSS setups!!!
Faster in-and-out on trends, safer entry and exit signals in chop or consolidation. Base setup is 6 & 8 TRIX for longer time frames such as 4hr or 8hr; ideal or FX, Crypto, or volatile instruments. I haven't experimented with using this on lower time charts and adjusting the trix settings; if you do, drop a comment.
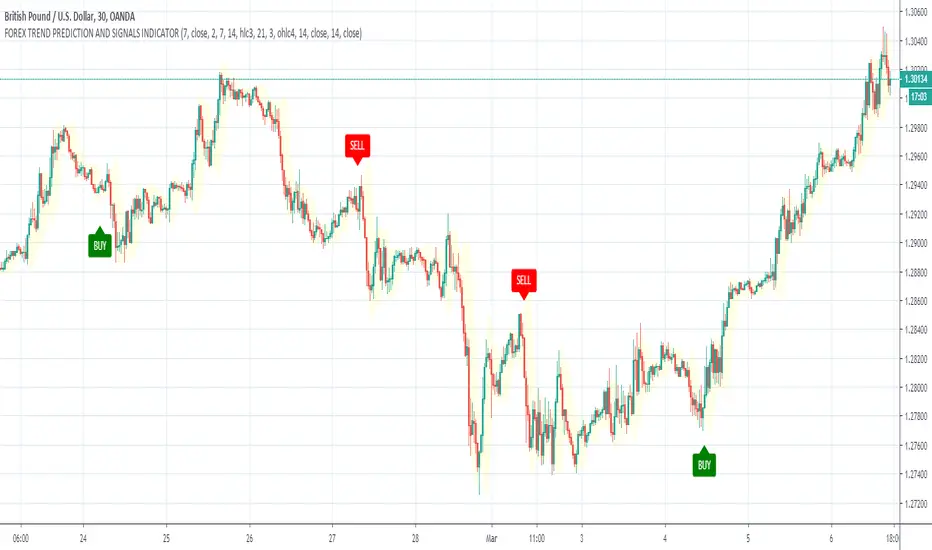
GBPUSD TREND DETECTION AND BUY/SELL ARROW SIGNALS INDICATORGBPUSD TREND DETECTION AND BUY/SELL ARROW SIGNALS INDICATOR
This script developed for active forex traders and based on Trend Analysis Indicators.
It used combination of Moving Averages, Volatility Indicator and Fractals and try to
detect reversal points of trends and generates buy/sell signals.
Works for all Forex currency pairs and time frames: 15MIN, 1H, 1DAY.
Can be used for swing trading and trend trading.
Advantage of this script indicator that all noise is filtered and signals detects long trends.
This make it useful as stand-alone trading strategy indicator or in combination with other indicators,
It is useful for day and intraday forex traders.
Main features of this indicator are:
✅ Forex Trend Reverse Points
✅ Forex breakout indicator
✅ Forex trend Signals
FRAMA - Supertrend strategyFRAMA Strategy
I found this strategy on internet, in a well-known forex forum.
I have translated the two indicators mentioned in that strategy (originally in mq4) in pine script.
Thanks to Fractured and Shizaru for the FRAMA snippets, to mejialucas for Supertrend snippet, to JayRogers for trade management snippet and to Trost for backtesting snippet.
I also added some code to have FRAME with a deiiferent timeframe
Indicators set-up:
FRAMA period 24 (it was originally 25 but it's better to use an even number)
FRAMA timefarme lower then chart timeframe (e.g. daily chart and weekly FRAMA)
Supertrend indicator as it is.
Of course, it is better to adapt above setting to traded instrument.
Long/Buy rules:
1 - Enter at crossover between FRAMA and its signal
2 - Option to filter entries based on supertrend signal
3 - Exit when Supertrend change direction;
4 - Exit long when short signal occurs;
Short/Sell rules:
1 - Enter at crossunder between FRAMA and its signal
2 - Option to filter entries based on supertrend signal
3 - Exit when Supertrend change direction;
4 - Exit short when long signal occurs;
VERY IMPORTANT NOTE: this is a trend following strategy, so the target is to stay in the trade as much as possible (drawdown my be high). If your trading style is more focused on scalping and/or pullbaks, this strategy is not for you.
Credits to who developed this startegy (google it).
Thanks to all pinescripters mentined in the code for their snippets.
I have also a study with alerts.
Please use comment section for any feedback or contact me if you need support.

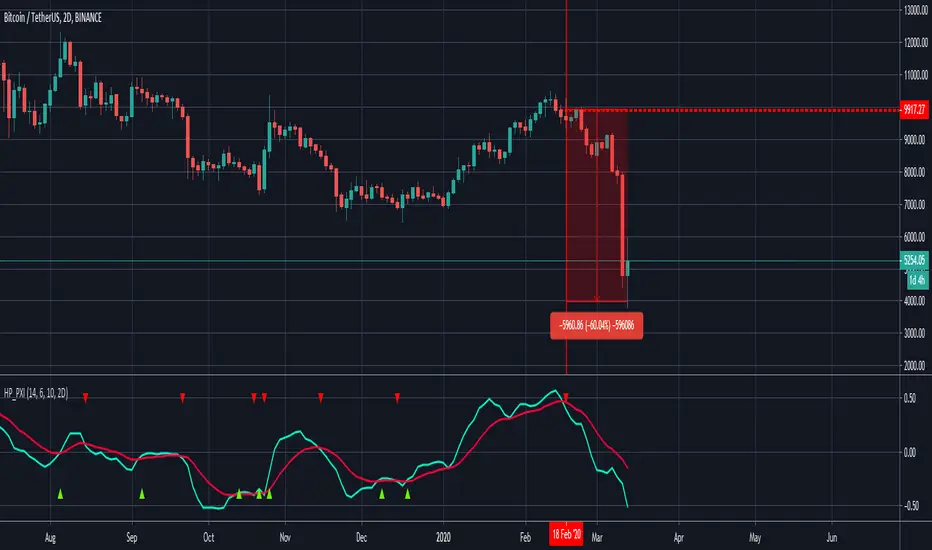
Plutus eXploration Index - PXIGreetings Fellow Traders!
We have developed this simple and easy to use indicator so that all users can benefit from it by:
• Reducing the amount of time spent trading.
• Minimizing the risk of loss.
• Accurate timing on entries and exits.
• Signals are accurate in volatile market conditions.
What is the PXI?
The Plutus eXploration Index falls under the centred momentum oscillator category which means that it fluctuates above and below a central point or line. Apex levels exist, where the indicator will reach a peak, and start moving in the opposite direction. Two lines move in unison and crossovers will signal a buy and a sell.
Setting up the indicator:
Once you have received your invite, the indicator will appear under your "my invite only" scripts in trading view detailed charts screen. Select PXI and add it to your chart. For free accounts on TradingView, the indicator limit is set to x3, so please de-activate something if you hit this limit.
You can access the PXI setting in the string of icons that follow after the indicators name in the top left corner of the indicator chart. In order:
Name | Visibility | Settings | Show source code | Delete | More
Under the settings, there are two tabs. One for the style, which you may freely change to suit your preferences. And then the first tab, for Inputs. The default settings for Long Minima, Short Maxima and Integrated EMA should not be changed.
The critical change to make in the input settings is the time frame !
The time frame on the price chart and the time frame on the indicator have to match! The range of allowable time frames is as follows:
15min | 30min | 1h | 4h | 12h | 1d | 2d | 1week
How to use the PXI:
The apex levels on the oscillator differ for each asset and vary depending on the selected time frame. The signals provided near apex points shall hold more weight. We recommend that traders assess these levels properly before considering a position.
Sell signal: Sell signals occur when the quick line (default blue) crosses over the slow line (default orange) from above.
A red arrow down will mark this point in time out on the chart.
Buy signal: Buy signals occur when the quick line (default blue) crosses the slow line (default orange) from bellow.
A green arrow down will mark this point in time out on the chart.
Maximizing Risk/Reward and profitability:
The indicator strives to keep positions open long enough to reap real rewards in the market. Maximum profit levels naturally occur around the apex points on the indicator chart, and the onus is on the trader to attempt an early exit once these levels are achieved.
Addition points to consider:
Most profitable trading signals occur on the daily time frames while considering the duration of trades and timing of the signals. For the lowest risk levels, weekly time frames are most suitable. From the weekly time frame down, the risk increases incrementally until you reach the 15min time frame. Signals at the lower levels occur more often and they are effective but, they should, however, be monitored closely. Also, the lower the time frame, the higher the chances of false-positive signals.
will not be liable for damages of any kind resulting from your use of or inability to use the indicator or content.
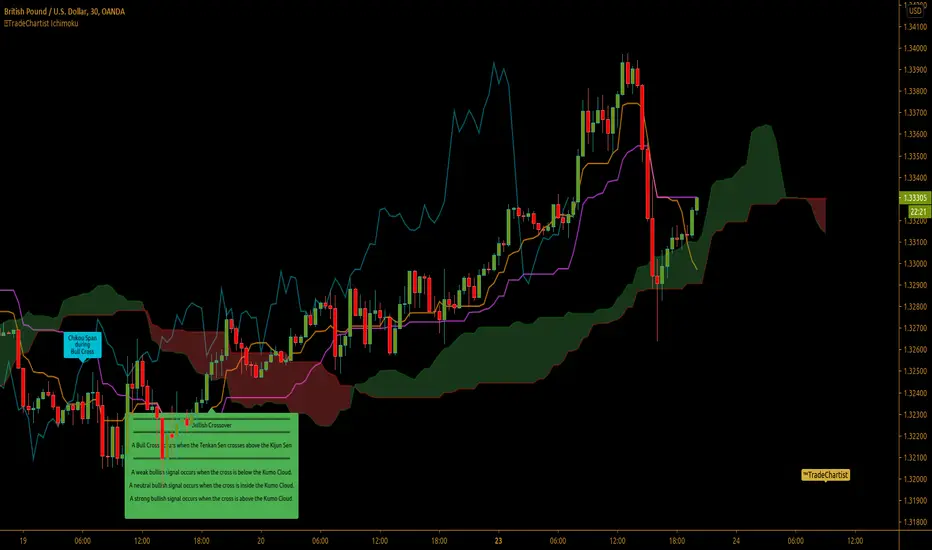
™TradeChartist - Show and Tell - Ichimoku Cloud™TradeChartist Show and Tell - Ichimoku Cloud is a free and easy to use script that helps anyone learn and understand the Ichimoku cloud by using the 'Show and Tell' option from the indicator settings and by choosing the Ichimoku component/Signal from the dropdown box. For individuals new to Ichimoku Cloud , Show and Tell option will help explain the components and signals of Ichimoku Cloud on the chart without having to navigate away from price action, thus making it easier to learn and understand Ichimoku cloud with respect to chart price action on the corresponding time frame.
The indicator automatically detects cryptocurrencies as it uses different settings specific to cryptocurrencies market - (20,60,120,30) respectively as opposed to classic - (9,26,52,26).
When 'Show and Tell' is unchecked from indicator settings, the script detects signals and important Ichimoku events like Bull/Bear crosses, Bullish/Bearish Kumo Twists, Bullish/Bearish Kumo Breakouts etc and plots labels on chart. To turn off this feature, just uncheck 'Labels' from the styles tab under the indicator settings.
This is a free to use indicator. Give a thumbs up or leave a comment if you like the script.
On Balance Volume with CrossOBV indicator with a few key changes that can turn it into a filter or trading indicator as-is.
Volume calculation given a look-back to help clarify trends without smoothing lag
Change the source (HLC3 indicates a little faster in backtesting)
Smooth the signal if desired
Moving average (MA) added for crossover indication in trend change
MA can be either EMA or HMA**
** My personal use:
EMA for trend filtering trades: Trade long signals if OBV is above the MA, trade short signals if OBV is below the MA.
HMA for scalping and chop: Normally set the HMA to 20 or 15 and trade the crosses. Works on most time frames and generates a lot of noise. 5 min and 15 min seems best for me in day trading
Example of trend trading using only the OBV-C and no other indicators, stops, or trailing stops:
This could obviously be improved using stops, trailing stops, or other indicators to filter when to enter & exit trades or mitigate loss.
Example of trading using the HMA and lower time frames with Elder's Force Index (EFI) used as a filter. Trade with both cross at or very near the same time. Winning trades in green:

PpSignal volatility strength Indicator this bollinger band is calculated with rsi wilder ...
You can also see the smoothed ATR with the elder formula and a Tilson t3. All indicators have alarms. So you can see the right moment of entry.
When tilson is green, and atr is blue and the price crossed the upper band is a BUYsignal and and invese color (red) and the prece cross the down ban.
You also have the option of seeing the RSI Wilder as a line or as haiken ashimode.
keep in mind the trend and divergences of macd ewo or rsi to make your tickets more effective.

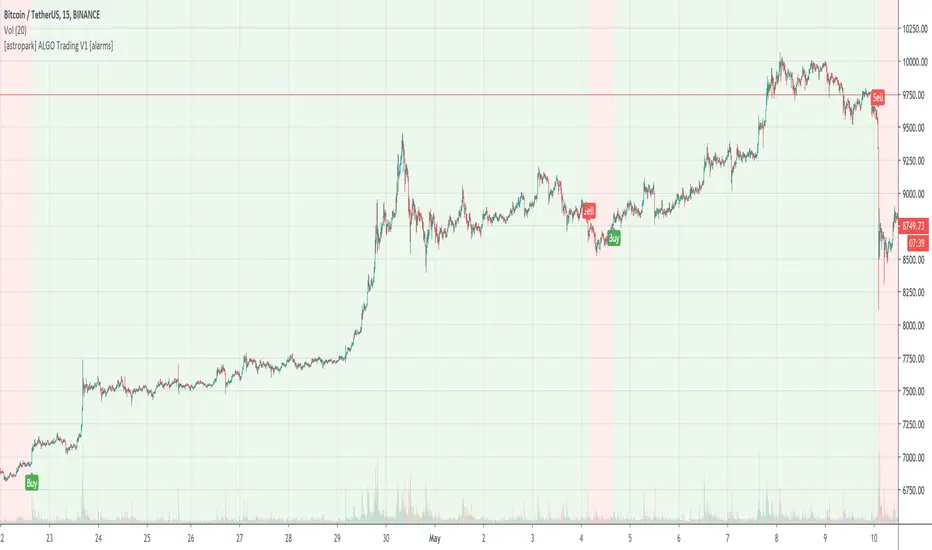
[astropark] ALGO Trading V3 [alarms]Dear Followers,
today another awesome Swing and Scalping Trading Strategy indicator, runnable on a bot , which works great on many timeframes (from 1h and above is suggested), just write me in order to help you find correct settings).
It must be said that this strategy works even better on 1m Renko chart!
If you are a scalper or you are a swing trader, you will love suggested entries for fast and long-lasting profit.
Keep in mind that a proper trailing stop strategy and risk management and money management strategies are very important (DM me if you need any clarification on these points).
This is not an evolution of "ALGO Trading V1" or "ALGO Trading V2" , but a twin sister of them.
For your reference, here it is the "ALGO Trading V1" indicator
and here the "ALGO Trading V2"
This strategy has the following options:
enable/disable signals on chart
enable/disable bars and background coloring based on trend
enable/disable a "filter noise" option , which try to reduce overtrading (you can easily check it on backtesting)
enable/disable a Take Profit / Stop Loss option (you can easily check it on backtesting too)
enable/disable a secret SmartOption which may improve profit on your chart (again, check it on you chart if it helps or not)
This strategy only trigger 1 buy or 1 sell. If you enable Take Profit / Stop Loss option, consider that many TP can be triggered before trend reversal, so take partial profit on every TP an eventually buy/sell back lower/higher to maximize your profit.
This script will let you set all notifications you may need in order to be alerted on each triggered signals.
The one for backtesting purpose can be found by searching for the astropark's "ALGO Trading V3" and then choosing the indicator with "strategy" suffix in the name, or you can find here below
Strategy results are calculated on the time window from 1995 to now, so on more than 15 years, using 1000$ as initial capital and working at 1x leverage (so no leverage at all! If you like to use leverage, be sure to use a safe option, like 3x or 5x at most in order to have liquidation price very far).
This is not the "Holy Grail", so use a proper risk management strategy.
This script will let you backtest how the indicator will perform on any chart and timeframe you may like to test and/or trade. Of course results will be very different depending on the chart and timeframe you will open. I tested a lot of charts and always you can find a combination that keep this strategy in profit on swing trading style (and this means that if you can have a daily look at the chart you can always manage to maximize your profit on each trade!)
This is a premium indicator , so send me a private message in order to get access to this script.

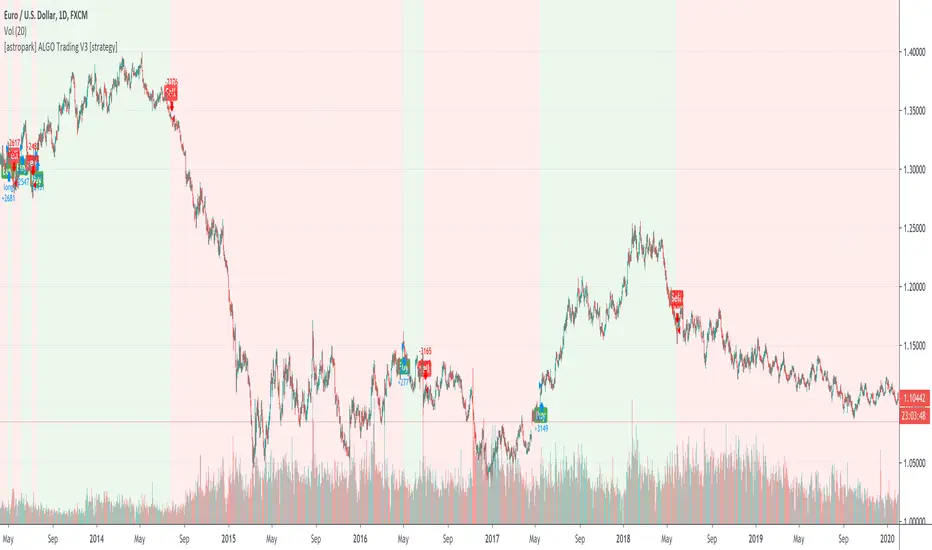
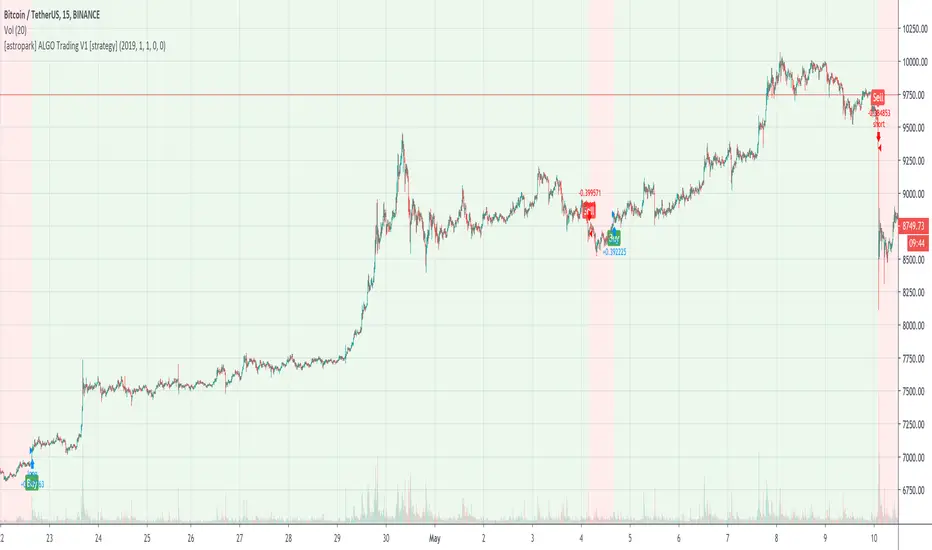
[astropark] ALGO Trading V3 [strategy]Dear Followers,
today another awesome Swing and Scalping Trading Strategy indicator, runnable on a bot , which works great on many timeframes (from 1h and above is suggested), just write me in order to help you find correct settings).
It must be said that this strategy works even better on 1m Renko chart!
If you are a scalper or you are a swing trader, you will love suggested entries for fast and long-lasting profit.
Keep in mind that a proper trailing stop strategy and risk management and money management strategies are very important (DM me if you need any clarification on these points).
This is not an evolution of "ALGO Trading V1" or "ALGO Trading V2" , but a twin sister of them.
For your reference, here it is the "ALGO Trading V1" indicator
and here the "ALGO Trading V2"
This strategy has the following options:
enable/disable signals on chart
enable/disable bars and background coloring based on trend
enable/disable a "filter noise" option , which try to reduce overtrading (you can easily check it on backtesting)
enable/disable a Take Profit / Stop Loss option (you can easily check it on backtesting too)
enable/disable a secret SmartOption which may improve profit on your chart (again, check it on you chart if it helps or not)
This strategy only trigger 1 buy or 1 sell. If you enable Take Profit / Stop Loss option, consider that many TP can be triggered before trend reversal, so take partial profit on every TP an eventually buy/sell back lower/higher to maximize your profit.
In order to get notified when a signal is triggered, you need to use the "alarms" version of this indicator (just search for astropark's "ALGO Trading V3" indicator and choose the one with "alarms" suffix).
Strategy results are calculated on the time window from 1995 to now, so on more than 15 years, using 1000$ as initial capital and working at 1x leverage (so no leverage at all! If you like to use leverage, be sure to use a safe option, like 3x or 5x at most in order to have liquidation price very far).
This is not the "Holy Grail", so use a proper risk management strategy.
This script will let you backtest how the indicator will perform on any chart and timeframe you may like to test and/or trade. Of course results will be very different depending on the chart and timeframe you will open. I tested a lot of charts and always you can find a combination that keep this strategy in profit on swing trading style (and this means that if you can have a daily look at the chart you can always manage to maximize your profit on each trade!)
This is a premium indicator , so send me a private message in order to get access to this script.
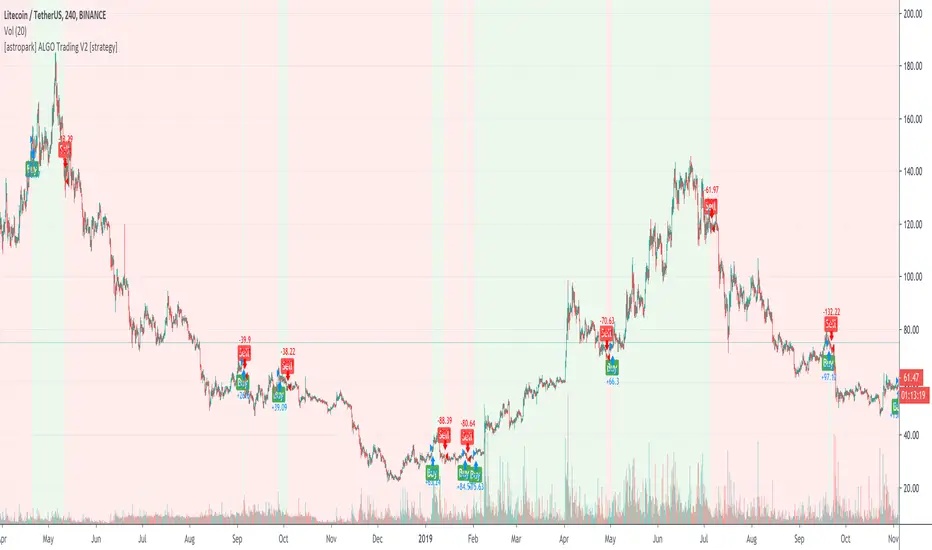
[astropark] ALGO Trading V2 [alarms]Dear Followers,
today another awesome Swing and Scalping Trading Strategy indicator, runnable on a bot , which works great on many timeframes (ones between 1h and 1D are suggested, but just write me in order to help you find correct settings).
It must be said that this strategy works even better on 1m Renko chart!
If you are a scalper or you are a swing trader, you will love suggested entries for fast and long-lasting profit.
Keep in mind that a proper trailing stop strategy and risk management and money management strategies are very important (DM me if you need any clarification on these points).
This is not an evolution of "ALGO Trading V1" or "ALGO Trading V3" , but a twin sister of them. Search them on TradingView to know them better.
Here you can find ALGO Trading V1
This strategy has the following options:
enable/disable signals on chart
enable/disable bars and background coloring based on trend
enable/disable a "filter noise" option , which try to reduce overtrading (you can easily check it on backtesting)
enable/disable a Take Profit / Stop Loss option (you can easily check it on backtesting too)
enable/disable a secret SmartOption which may improve profit on your chart (again, check it on you chart if it helps or not)
This strategy only trigger 1 buy or 1 sell. If you enable Take Profit / Stop Loss option, consider that many TP can be triggered before trend reversal, so take partial profit on every TP an eventually buy/sell back lower/higher to maximize your profit.
This script will let you set all notifications you may need in order to be alerted on each triggered signals.
The one for backtesting purpose can be found by searching for the astropark's "ALGO Trading V2" and then choosing the indicator with "strategy" suffix in the name, or you can find here below
Strategy results are calculated on the time window from January 2018 to now, so on more than 2 years, using 1000$ as initial capital and working at 1x leverage (so no leverage at all! If you like to use leverage, be sure to use a safe option, like 3x or 5x at most in order to have liquidation price very far).
This is not the "Holy Grail", so use a proper risk management strategy.
This is a premium indicator , so send me a private message in order to get access to this script.

[astropark] ALGO Trading V2 [strategy]Dear Followers,
today another awesome Swing and Scalping Trading Strategy indicator, runnable on a bot , which works great on many timeframes (ones between 1h and 1D are suggested, but just write me in order to help you find correct settings).
It must be said that this strategy works even better on 1m Renko chart!
If you are a scalper or you are a swing trader, you will love suggested entries for fast and long-lasting profit.
Keep in mind that a proper trailing stop strategy and risk management and money management strategies are very important (DM me if you need any clarification on these points).
This is not an evolution of "ALGO Trading V1" or "ALGO Trading V3" , but a twin sister of them. Search them on TradingView to know them better.
Here you can find ALGO Trading V1
This strategy has the following options:
enable/disable signals on chart
enable/disable bars and background coloring based on trend
enable/disable a "filter noise" option , which try to reduce overtrading (you can easily check it on backtesting)
enable/disable a Take Profit / Stop Loss option (you can easily check it on backtesting too)
enable/disable a secret SmartOption which may improve profit on your chart (again, check it on you chart if it helps or not)
This strategy only trigger 1 buy or 1 sell. If you enable Take Profit / Stop Loss option, consider that many TP can be triggered before trend reversal, so take partial profit on every TP an eventually buy/sell back lower/higher to maximize your profit.
In order to get notified when a signal is triggered, you need to use the "alarms" version of this indicator (just search for astropark's "ALGO Trading V2" indicator and choose the one with "alarms" suffix).
Strategy results are calculated on the time window from January 2019 to now, so on more than 1 year, using 1000$ as initial capital and working at 1x leverage (so no leverage at all! If you like to use leverage, be sure to use a safe option, like 3x or 5x at most in order to have liquidation price very far).
This is not the "Holy Grail", so use a proper risk management strategy.
This script will let you backtest how the indicator will perform on any chart and timeframe you may like to test and/or trade. Of course results will be very different depending on the chart and timeframe you will open. I tested a lot of charts and always you can find a combination that keep this strategy in profit on swing trading style (and this means that if you can have a daily look at the chart you can always manage to maximize your profit on each trade!)
This is a premium indicator , so send me a private message in order to get access to this script.
[astropark] ALGO Trading V1 [alarms]Dear Followers,
today another awesome Swing and Scalping Trading Strategy indicator, runnable on a bot , which works great on Low Timeframes (1h is suggested) but also on even lower ones (till 15m) and on higher ones (no further than 1D), just write me in order to help you find correct settings).
It must be said that this strategy works even better on 1m Renko chart!
If you are a scalper or you are a swing trader, you will love suggested entries for fast and long-lasting profit.
Keep in mind that a proper trailing stop strategy and risk management and money management strategies are very important (DM me if you need any clarification on these points).
This is not an evolution of "ALGO Trading V2" or "ALGO Trading V3" , but a twin sister of them. Search them on TradingView to know them better.
This strategy has the following options:
enable/disable signals on chart
enable/disable bars and background coloring based on trend
enable/disable a "filter noise" option , which try to reduce overtrading (you can easily check it on backtesting)
enable/disable a Take Profit / Stop Loss option (you can easily check it on backtesting too)
enable/disable a secret SmartOption which may improve profit on your chart (again, check it on you chart if it helps or not)
This strategy only trigger 1 buy or 1 sell. If you enable Take Profit / Stop Loss option, consider that many TP can be triggered before trend reversal, so take partial profit on every TP an eventually buy/sell back lower/higher to maximize your profit.
This script will let you set all notifications you may need in order to be alerted on each triggered signals.
The one for backtesting purpose can be found by searching for the astropark's "ALGO Trading V1" and then choosing the indicator with "strategy" suffix in the name, or you can find here below
Strategy results are calculated on the time window from January 2019 to now, so on more than 1 year, using 1000$ as initial capital and working at 1x leverage (so no leverage at all! If you like to use leverage, be sure to use a safe option, like 3x or 5x at most in order to have liquidation price very far).
This is not the "Holy Grail", so use a proper risk management strategy.
This is a premium indicator , so send me a private message in order to get access to this script.
[astropark] ALGO Trading V1 [strategy]Dear Followers,
today another awesome Swing and Scalping Trading Strategy indicator, runnable on a bot , which works great on Low Timeframes (1h is suggested) but also on even lower ones (till 15m) and on higher ones (no further than 1D), just write me in order to help you find correct settings).
It must be said that this strategy works even better on 1m Renko chart!
If you are a scalper or you are a swing trader, you will love suggested entries for fast and long-lasting profit.
Keep in mind that a proper trailing stop strategy and risk management and money management strategies are very important (DM me if you need any clarification on these points).
This is not an evolution of "ALGO Trading V2" or "ALGO Trading V3" , but a twin sister of them. Search them on TradingView to know them better.
This strategy has the following options:
enable/disable signals on chart
enable/disable bars and background coloring based on trend
enable/disable a "filter noise" option, which try to reduce overtrading (you can easily check it on backtesting)
enable/disable a Take Profit / Stop Loss option (you can easily check it on backtesting too)
enable/disable a secret SmartOption which may improve profit on your chart (again, check it on you chart if it helps or not)
This strategy only trigger 1 buy or 1 sell. If you enable Take Profit / Stop Loss option, consider that many TP can be triggered before trend reversal, so take partial profit on every TP an eventually buy/sell back lower/higher to maximize your profit.
In order to get notified when a signal is triggered, you need to use the "alarms" version of this indicator (just search for astropark's "ALGO Trading V1" indicator and choose the one with "alarms" suffix).
Strategy results are calculated on the time window from January 2019 to now, so on more than 1 year, using 1000$ as initial capital and working at 1x leverage (so no leverage at all! If you like to use leverage, be sure to use a safe option, like 3x or 5x at most in order to have liquidation price very far).
This is not the "Holy Grail", so use a proper risk management strategy.
This script will let you backtest how the indicator will perform on any chart and timeframe you may like to test and/or trade. Of course results will be very different depending on the chart and timeframe you will open. I tested a lot of charts and always you can find a combination that keep this strategy in profit on swing trading style (and this means that if you can have a daily look at the chart you can always manage to maximize your profit on each trade!)
This is a premium indicator , so send me a private message in order to get access to this script.
VWAP Standard DeviationsVWAP Standard Deviations
VWAPSD is an indicator that can be used to identify Support & Resistance lines based on Volume per Price.
Such an indicator can be easily used to place a limit order on the SR levels

Best Volatility Calculator (Multi Instruments)Hello traders
A bit of context
Definition: Volatility is defined as the close of current candle - close of the previous N candle
This is an alternative version of my Best Volatility Calculator
The other version is displayed on a panel below. This one overlays on the chart using the "overlay=true" setting
This indicator shows the average volatility, of last N Periods, for the selected time frames and for 2 selected instruments.
You can select up to 2 timeframes with this version
Presented as Currency, Pip, percentage labels in a panel below.
Will calculate in real-time only for the current instrument on the chart.
The indicator is coded to not be repainting
Example
In the indicator screenshot, I used a lookback period of 1.
That compares the current candle close versus the previous one for the daily and weekly timeframe
Showing how the results look like using FOREX instruments (where using the PIPS labels make more sense than with cryptocurrency assets)
Best regards
Dave

[astropark] I love Fibonacci V1Dear Followers,
I Love Fibonacci is a tool designed to have a professional market momentum perspective to help you get rid of your emotions and trade more securely!
Don't let FOMO, fear and indecision take control of your trading actions!
Use it together with my 21 days EMA indicator
and EMA Ribbons
Here some examples on how to use them all together on EURUSD trading pair
and on BTCUSD trading pair
This is a free indicator, direct message me if you need further help.
