Volume Indıcator [JP & Dia]The volume indicator refers to the total amount of a financial instrument that has been traded within a specific time frame. This can include shares, contracts, or lots. Market exchanges track and provide this data. The volume indicator is one of the oldest and most widely used indicators in trading. It is typically represented by colored columns, with green indicating up volume and red indicating down volume, along with a moving average. Unlike other indicators, the volume indicator is not based on price. A high volume suggests a strong interest in a particular instrument at its current price, while a low volume suggests the opposite.
When there is a sudden increase in trading volume, it indicates a higher likelihood of the price changing. This often occurs during news events. Strong trending movements are often accompanied by increased trading volume, which can be seen as a measure of strength. Traders would typically expect to see high buying volume at a support level and high selling volume at a resistance level. There are various ways to incorporate volume into a trading strategy, and many traders combine it with other analysis techniques.
USECASE :
Timeframe Selection: Choose the timeframe for which you want to analyze the volume.
Volume Display Options: Toggle the display of today’s, yesterday’s, and the day before yesterday’s volume data.
Text Color: Select the color for the text in the volume table.
Volume Data Retrieval: The script fetches volume data for the selected timeframe and the daily volume for the current and previous two days.
Percentage Change Calculation: Calculates the percentage change in volume between days to identify significant increases or decreases.
Volume Table: A table is created to display the volume data and percentage changes, updating in real-time with each new bar.
Cerca negli script per "volume"

Volume Surge Analysis [UAlgo]The "Volume Surge Analysis " indicator is designed to detect significant volume surges in the market. By analyzing volume relative to its moving average and incorporating a comparison of the true range of price movements, this script highlights potential bullish and bearish volume spikes. Traders can utilize these signals to identify moments of heightened market activity that may indicate strong buying or selling pressure.
🔶Features
Volume Multiplier: Customizable setting to define the threshold for what constitutes a volume surge.
Volume SMA Length: Adjustable length for the Simple Moving Average (SMA) of volume.
Price Movement Analysis
Enhances the volume analysis by adding an additional layer of context, helping to confirm whether a volume surge is associated with buying or selling pressure.
True Range Calculation: Measures the range of price movement to understand volatility.
Positive Movement (DM+): Calculated when the current high minus the previous high is greater than the previous low minus the current low. This helps identify strong upward movements.
Negative Movement (DM-): Calculated when the previous low minus the current low is greater than the current high minus the previous high. This helps identify strong downward movements.
Integration with Volume Analysis: By combining the volume analysis with price movement analysis, the script can more accurately determine whether a volume surge is likely driven by bullish or bearish sentiment. This integration helps filter out false signals and provides more reliable indications of market activity.
Median Volume Comparison: Compares the current volume against the median volume multiplied by the volume multiplier to identify significant volume spikes.
Bullish and Bearish Surge Signals: Plots circles above or below bars where significant volume surges occur, indicating potential bullish or bearish movements.
Color Customization: Options to set specific colors for bullish and bearish signals to enhance visual clarity.
Bar Coloring: Optional feature to change the color of bars based on detected volume surges.
Alerts: Configurable alerts for bullish and bearish volume spikes to notify traders in real-time.
🔶Interpretation:
Bullish Volume Surges ( Teal Circles ): These circles appear above the bar when the current volume exceeds the median volume by the specified Volume Multiplier, and the smoothed Positive Directional Index (PDI) is greater than the smoothed Negative Directional Index (NDI). This suggests a potential uptrend with strong buying pressure.
Bearish Volume Surges ( Red Circles ): These circles appear below the bar when the current volume exceeds the median volume by the specified Volume Multiplier, and the smoothed NDI is greater than the smoothed PDI. This suggests a potential downtrend with strong selling pressure.
Overall, the "Volume Surge Analysis " indicator serves as a valuable tool for traders seeking to identify potential trend reversals or strong continuations based on with an above-average rise in volume and directional momentum.
🔶Disclaimer
This indicator is intended for informational and educational purposes only and should not be construed as financial or investment advice. Trading involves substantial risk, and it is essential to conduct your own research and consult with a qualified financial advisor before making any trading decisions.

Volume HeatMap With Profile [ChartPrime]The Volume Heatmap with Profile indicator is a tool designed to provide traders with a comprehensive view of market activity through customizable visualizations. This indicator goes beyond traditional volume analysis by offering a range of adjustable parameters and features that enhance analysis of volume and give a cleaner experience when analyzing it.
To get started click the start and end time for the profile.
Key Features:
Extended Calculation: This indicator extends its calculation to the last bar, ensuring that the user has insights into current market dynamics.
Point of Control (POC): Easily identify the price level at which the highest trading activity has occurred, helping the user pinpoint potential reversal points and significant support/resistance zones.
VWAP Point of Control: Display the Volume Weighted Average Price (VWAP) Point of Control, giving the user a clear reference for determining the average price traders are paying and potential price reversals.
Adjustable Colors for Heatmap: Change the heatmap colors to the users preference, allowing the user to match the indicator's appearance to their chart style and personal visual preferences.
Forecasted Zone: This feature allows traders to forecast areas of high activity by providing the option to adjust colors within this zone. This feature assists in identifying potential breakouts or areas where increased trading volume is anticipated.
Volume Profile: Customize the colors of the volume profile to make it distinct and easily distinguishable on the chart.
Adjustable Volume Levels: Specify the number volume levels that are most relevant to your trading strategy.
Adjustable Placement for Volume Profile: Position the volume profile on the chart. Whether the user prefers it on the left, right, or at the center of the chart, this indicator offers placement flexibility.
The ratio of bull vs bear volume is plotted on the outside of the range indicating how bullish or bearish price action is in a given range.

Volume Delta Trailing Stop [LuxAlgo]The ' Volume Delta Trailing Stop ' indicator uses Lower Time Frame (LTF) volume delta data which can provide potential entries together with a Volume-Delta based Trailing Stop-line .
🔶 USAGE
Our 'Volume Delta Trailing Stop' script can show potential entries/Stop Loss lines
A trigger line needs to be broken before a position is taken, after which a Volume Delta-controlled Trailing Stop-line is created:
🔶 DETAILS
🔹 Volume rises when bought or sold
🔹 When the opening price appears on the chart, a buy/sell order has been executed.
If that order is less than the available supply of that particular price, volume will rise, without moving the price.
🔹 When the opening price is the same as the closing price, the volume of that bar can be seen as "neutral volume" (nV); nor "up", nor "down" volume.
Example
A buy order doesn't fill the first available supply in the order book. This price will be the opening price with a certain volume.
When at closing time, price still hasn't moved (the first available supply in the order book isn't filled, or no movement downwards),
the closing price will be equal to the opening price, but with volume. This can be seen as "neutral volume (nV)".
🔹 Delta Volume (ΔV): this is "up volume" minus "down volume"
🔹 Standard volume is colored red when closing price is lower than opening price ( = "down volume").
🔹 Standard volume is colored green when closing price is higher OR equal (nV) than opening price ( = "up volume").
🔹 Neutral Volume
The "Neutral-Volume" is considered "Up-Volume" - setting will dictate whether nV is considered as green 'buy' volume or not.
🔶 EXAMPLE
29 July 10:00 -> 10:05, chart timeframe 5 minutes, open 29311.28, close 29313.89
close > open, so the volume (39.55) is colored green ("up volume").
(The Volume script used in the following examples is the open-source publication Volume Columns w. Alerts (V) from LucF )
Let's zoom to the 1-minute TF:
The same period is now divided into more bars, volume direction (color) is dependable on the difference between open and close.
Counting up and down volume gives a more detailed result, it remains in an upward direction though):
(ΔV = +15.51)
Let's further zoom in to the 1-second TF:
The same period is now divided into even more bars (more possibility for changing direction on each bar)
Here we see several bars that haven't moved in price, but they have volume ("neutral" volume).
(neutral volume is coloured light green here, while up volume is coloured darker green)
When we count all green and red volume bars, the result is quite different:
(ΔV = -0.35)
In total more volume is found when price went downwards, yet price went up in these 5 minutes.
-> This is the heart of our publication, when this divergence occurs, you can see a barcolor changement:
• orange: when price went up, but LTF Volume was mainly in a downward direction.
• blue: when price went down, but LTF Volume was mainly in an upwards direction.
When we split the green "up volume" into "up" and "neutral", the difference is even higher
(here "neutral volume" is colored grey):
(ΔV = -12.76; "up" - "down")
🔶 CONCEPTS
bullishBear = current bar is red but LTF volume is in upward direction -> blue bar
bearishBull = current bar is green but LTF volume is in downward direction -> orange bar
🔹 Potential positioning - forming of Trigger-line
When not in position, the script will wait for a divergence between price and volume direction. When found, a Trigger-line will appear:
• at high when a blue bar appears ( bullishBear ).
• at low when an orange bar appears ( bearishBull ).
Next step is when the Trigger-line is broken by close or high/low (settings: Trigger )
Here, the closing price went under the grey Trigger-line -> bearish position:
🔹 Trailing Stop-line
When the Trigger-line is broken, the Trailing Stop-line (TS-line) will start:
• low when bullish position
• high when bearish position
You can choose (settings -> Trigger -> Close or H/L ) whether close price or high/low should break the Trigger-line
When alerts are enabled ("Any alert() function call"), you'll get the following message:
• ' signal up ' when bullish position
• ' signal down' when bearish position
After that, the TS-line will be adjusted when:
• a blue bullishBear bar appears when in bullish position -> lowest of {low , previous blue bar's high or orange bar's low}
• an orange bearishBull bar appears when in bearish position -> highest of {high, previous blue bar's high or orange bar's low}
When alerts are enabled ("Any alert() function call"), and the TS-line is broken, you'll get the following message:
• ' TS-line broken down ' when out bullish position
• ' TS-line broken up ' when out bearish position
🔹 Reference Point
Default the direction of price will be evaluated by comparing closing price with opening price.
When open and close are the same, you'll get "neutral volume".
You can use "previous close" instead (as in built-in volume indicator) to include gaps.
If close equals open , but close is lower than previous close , it will be regarded as " down volume ",
similar, when close is higher than previous close , it will be regarded as " up volume "
Note, the setting applies for the current timeframe AND Lower timeframe:
Based on: " open " (close - open)
Based on: " previous close " (close - previous close)
🔹 Adjustment
When the TS-line changes, this can be adjusted with a percentage of price , or a multiple of " True Range "
Default (Δ line -> Adjustment - 0)
Δ line -> Adjustment 0.03% (of price)
Δ line -> Mult of TR (10)
🔶 SETTINGS
🔹 LTF: choose your Lower TimeFrame: 1S (seconds), 5S, 10S, 15S, 30S, 1 minute)
🔹 Trigger: Choose the trigger for breaking the Trigger-line ; close or H/L (high when bullish position, low when bearish position)
🔹 Δ line ( Trailing Stop-line ): add/subtract an adjustment when the TS-line changes ( default: Adjustment ):
• Adjustment ( default: 0 ): add/subtract an extra % of price
• Mult of TR : add/subtract a multiple of True Range
🔹 Based on: compare closing price against:
• open
• previous close
🔹 "Neutral-Volume" is considered "Up-Volume" : this setting will dictate whether nV is considered as green 'buy' volume or not.
🔶 CONSIDERATIONS
🔹 The lowest LTF (1S) will give you more detail and will get data close to tick data.
However, a maximum of 100,000 intrabars can be used in calculations .
This means on the daily chart you won't see anything since 1 day ~ 86400 seconds. (just over 1 bar)
-> choose a lower chart timeframe, or choose a higher LTF (5S, 10S, ... 1 minute)
🔹 Always choose a LTF lower than the current chart timeframe.
🔹 Pine Script™ code using this request.security_lower_tf() may calculate differently on historical and real-time bars, leading to repainting .

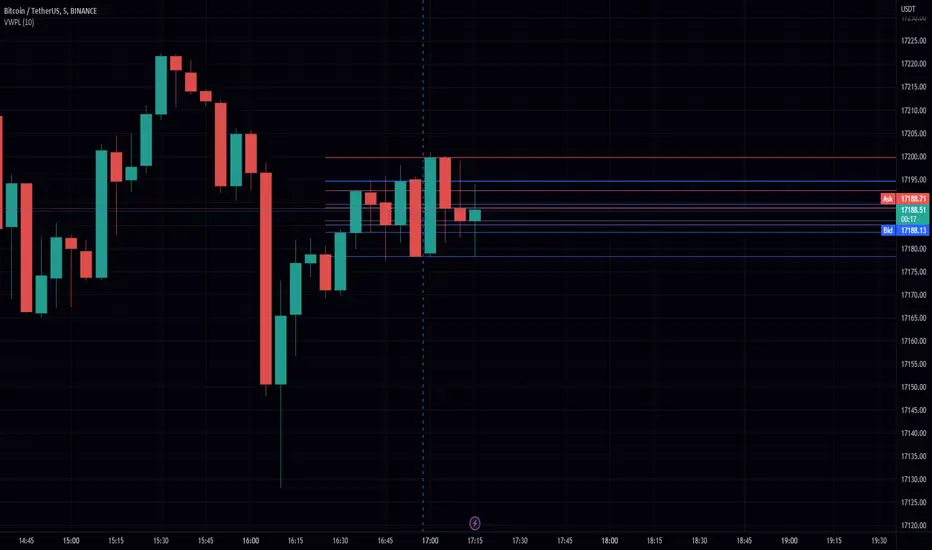
Volume-Weighted Price Levels (VWPL)Introduction:
In this script, we will be creating an indicator that plots horizontal lines on the chart for each unique price in a given range, and colors them based on the volume of that price.
Explanation:
First, we define the input "Length" as an integer. This will determine the number of bars back from the current bar to include in the range.
We then create two arrays: "price" and "vol." The "price" array will store all the unique prices in the given range, and the "vol" array will store the corresponding volumes for those prices.
Using a for loop, we iterate through the range of bars and check if the current close price is already included in the "price" array. If it is not, we add it to the array and also add the corresponding volume to the "vol" array. If it is already included, we find the index of that price in the "price" array and add the current volume to the volume stored at that index in the "vol" array.
After the for loop, we find the maximum volume in the "vol" array and use that to find the corresponding price in the "price" array. This will be the price at which we draw the horizontal line.
We then create an array of lines called "lines" and, using another for loop, we iterate through the "price" array and add a line to the "lines" array for each price. The color of each line is determined by the volume of that price, using a color gradient from blue (lowest volume) to red (highest volume).
Finally, we use an if statement to check if the current bar is the last bar in the chart, and if it is, we use another for loop to iterate through the "lines" array and delete all the lines. This is to prevent the lines from being carried over to the next bar and potentially being plotted multiple times.
Conclusion:
This script can be useful for visualizing the price levels with the highest volume in a given range, as well as seeing how volume is distributed among different price levels. It can be helpful for identifying areas of significant buying or selling pressure.
Volume Profile Volume Delta OI Delta [Kioseff Trading]Hello!
This script serves to distinguish volume delta for any asset and open interest delta for Binance perpetual futures.
The image above provides further explanation of functionality and color correspondence.
The image above shows the indicator calculating volume at each tick level and displaying the metric.
The label color outline (neon effect) is configurable; the image above is absent the feature.
The image above shows Open Interest (OI) Delta calculated - similar to how the script calculates volume delta - for a Binance Perpetual Future pair.
This feature only works for Binance Futures pairs; the script will not load when trying to calculate OI Delta on other assets.
Additionally, a heatmap is displayable should you configure the indicator to calculate it.
The image above shows a heatmap using volume delta calculations.
The image above shows a heatmap using OI delta calculations.
Of course, these calculations - when absent requisite data - require some assumptions to better replicate calculations with access to requisite data.
The indicator assumes a 60/40 split when a tick level is traded at and only one metric - "buy volume" or "sell volume" is recorded. This means there shouldn't be any levels recorded where "buy volume" is greater than 0 and "sell volume" equals 0 and vice versa. While this assumption was performed arbitrarily, it may help better replicate volume delta and OI delta calculations seen on other charting platforms.
This option is configurable; you can select to have the script not assume a 60/40 split and instead record volume "as is" at the corresponding tick level.
The script also divides volume and open interest if a one-minute bar violates multiple tick levels. The volume or open interest generated on the one-minute bar will be divided by the number of tick levels it exceeds. The results are, subsequently, appended to the violated tick levels.
Further, the script can be set to recalculate after a user-defined time threshold is exceeded. You can also define the percentage or tick distance between levels.
Also, it'd be great if this indicator can nicely replicate volume delta indicators on other charting platforms. If you've any ideas on how price action can be used to better assume volume at the corresponding price area please let me know!
Thank you (:

Volume Surge indicatorThis indicator highlight candles when Volume surge "X" times in compare of last "n" candle.
It helps you to find moments of market which Volatility and Position volumes raise significantly.
In other words, It shows footstep of "Big Banks" or "Whales" or other Giants ;)
- default value highlight candles when Volume is 2 time more than average of last 30 candle. But you can modify both values in your favor.
* You can set Alarm for notifying in advance when Volume surge happened on any chart.
I hope you guys find it helpful and handy

Volume Heatmap v7FTJR20This indicator is a heatmap of the financial volume used in the asset, I use three different means to define the heatmap separating it into 3 phases
Phase A: Low volume
Phase B: Medium volume
Phase C: High volume
don't worry about these data, the indicator is configured to auto-interpret the information.
The heatmap uses the following colors and specifications
Red = Ultra High Volume
Orange = High Volume
Yellow = Average Volume (balance)
Blue = Low volume
White = Volume below average
The heatmap compares the phases to identify if it finds a standard deviation over time, that is, you can see a smaller volume with the same red bar as a previous larger red bar, this is because the attacks are updated in real time.
Tutorial:
1 - In point 1 we have an aggression with yellow and orange bars, that is, a balance with aggressions. As we are coming from an uptrend, the probability is a reversal and the answer came in sequence with a red drop bar with ultra volume, so we have a seller in control.
2- after point 1, we see that we only have several blue and white bars, that is, possibly the red bar absorbed the seller and the seller flow was decreasing, notice that the prices held for 3x so the buyer attacks the seller with an orange bar.
3- at point 3, we have two yellow bars, a balance, notice that it is an aggression, any yellow, orange or red bar is an aggression, that is, there was a passive seller selling at higher values, taking advantage of the stops in a region where there was buying demand (people buying wrong!)
4- Before reaching point 4, notice that in general the price is moving practically sideways and the volume is decreasing (white and blue bars), exhaustion of the buyer volume (no demand) and the answer in point 4 came in aggression with yellow bars and oranges.
* the seller lets the market go up to make sure he is in control and when he tests the pivot zone he attacks with a red bar (notice that this red bar is smaller than the previous ones, this is the magic of the indicator divided into 3 phases).
5- After the market goes through the natural distribution phases, we see a red bar with a high spread, whenever you see a red bar with a 2 to 3x spreed, it is a region with potential for reversal.
6- Note that after the characteristics of point 5 the asset works in zig zag, volume decreasing and the reversal comes with little volume, it is natural to engulf without volume this is the reversal signal, notice that it touches the bottom several times and not loses the region after a red bar with very high spread.
*notice that the buyer let it form a giant (shoulder head shoulder) to make a trap and the price always respected the volume of the first red bar at point 1.
7- see that the asset entered an uptrend and the phase is repeating itself, asset rising in a wave A, made a corrective B wave in smaller ABC and is making a C wave, at this moment it is a probability to enter a red bar after test the resistance and have a significant increase in volume.
- I like your feedback and leave your settings and experiences in the comments.

Volume on bar VSA - signal V2Google translate.
This indicator marks bars on the chart with high and medium volumes. The direction of the effort depends on whether the tail is on the bar, bullish or bearish.
In the settings you can set (sensitivity) for tinting volumes of high and medium
This indicator highlights volumes just like here
Этот индикатор помечает бары на графике с повышенными и средними объемами. Направление усилия зависимости от того какой хвост на баре, бычий или медвежий.
В настройках можно задать (чувствительность) для подкрашивания объемов повышенных и средних.
Этот индикатор выделяет объемы точно также как

Volume peak visualizerVery simple indicator to show how relatively large a volume is, in comparison to previous volumes. IMHO it's clearer than the default version.
Volume Delta DivergenceThis script will show the bid and ask volume of each candle. TVC:USOIL
The green bar is Ask Volume and Red Bar is Bid Volume.

Volume SpikeThis script identifies volume spikes as a percentage change of the current bar's volume compared to the previous 3 bars' average volume.

Volume Profile DeltaThis indicator calculates the Volume Profile Delta (VPD). It constructs a high-resolution volume profile for each bar using intra-bar data, offering a detailed understanding of buying and selling pressure at discrete price levels.
Key Features:
Statistical Volume Profile Engine: For each bar, the indicator builds a high-resolution volume profile on a lower 'Intra-Bar Timeframe'. Instead of simple tick counting, it uses statistical models ('PDF' allocation) to distribute volume across price levels and advanced classifiers ('Dynamic' split) to determine the buy/sell pressure within that profile, providing a more nuanced delta calculation.
"Delta Candle" Visualization: The per-bar VPD is displayed as a candle, where:
Open: Always anchored at the zero line.
High/Low: Represent the peak buying (CVD High) and selling (CVD Low) pressure accumulated within that bar's profile.
Close: The final net delta value (CVD) for the bar.
Customizable Moving Average: An optional moving average of the net delta (Close) can be added. The MA type, length, and an optional Volume weighted setting are customizable.
Intra-Bar Peak Pivot Detection: Automatically identifies and plots significant turning points (pivots) in the peak buying (High) and selling (Low) pressure.
Note on Confirmation (Lag): Pivot signals are confirmed using a lookback method. A pivot is only plotted after the Pivot Right Bars input has passed, which introduces an inherent lag.
Multi-Timeframe (MTF) Capability:
MTF Output: The entire analysis (Delta Candles, MA, Pivots) can be calculated on a higher timeframe (using the Timeframe input), with standard options to handle gaps (Fill Gaps) and prevent repainting (Wait for...).
Limitation: The Pivot detection (Calculate Pivots) is disabled if a Higher Timeframe (HTF) is selected.
Integrated Alerts: Includes 8 alerts for:
The net delta crossing its moving average.
The detection of new peak buying or selling pivots.
Conditions of agreement or disagreement between the net delta and the main bar's direction.
Caution: Real-Time Data Behavior (Intra-Bar Repainting) This indicator uses high-resolution intra-bar data. As a result, the values on the current, unclosed bar (the real-time bar) will update dynamically as new intra-bar data arrives. This behavior is normal and necessary for this type of analysis. Signals should only be considered final after the main chart bar has closed.
DISCLAIMER
For Informational/Educational Use Only: This indicator is provided for informational and educational purposes only. It does not constitute financial, investment, or trading advice, nor is it a recommendation to buy or sell any asset.
Use at Your Own Risk: All trading decisions you make based on the information or signals generated by this indicator are made solely at your own risk.
No Guarantee of Performance: Past performance is not an indicator of future results. The author makes no guarantee regarding the accuracy of the signals or future profitability.
No Liability: The author shall not be held liable for any financial losses or damages incurred directly or indirectly from the use of this indicator.
Signals Are Not Recommendations: The alerts and visual signals (e.g., crossovers) generated by this tool are not direct recommendations to buy or sell. They are technical observations for your own analysis and consideration.

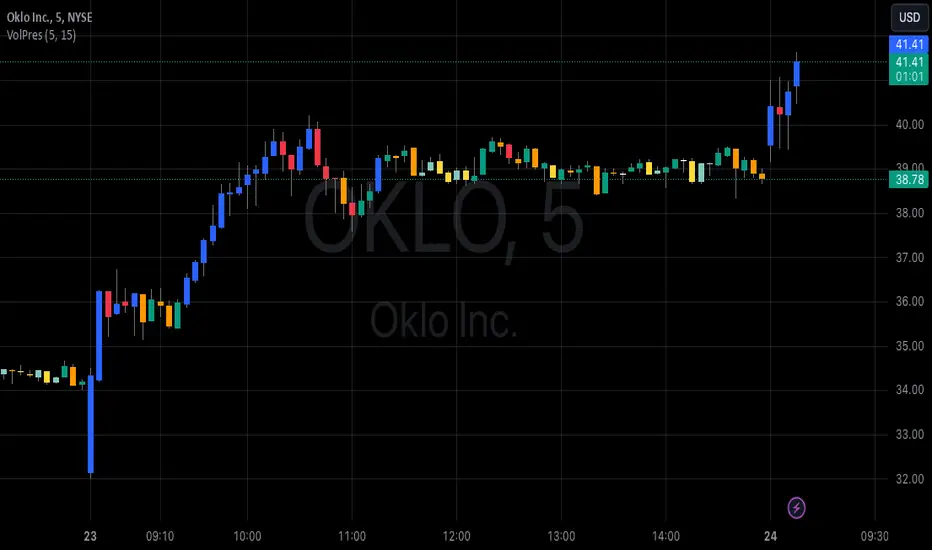
Volume PressureDraws the candle chart with colors to represent low, medium and high volumes. You get 3 colors for downward and 3 colors for upward movement. This will aid with immediately seeing the relative volume pushing the stock candle in the direction of movement.
You can control the percentage threshold for low and high volume. You also can change the colors to represent each volume level for upward and downward movement.
Volume Equilibrium Overlay(2 of 2)This is an overlay for a prior script I've created: Volume Equilibrium.
To sum it up in a brief manner, this script plots when there is "volume-equilibrium" aka prices that the market may see as "fair-value" relative to the specified timeframe. This script provides what my last code lacked and that is a visual representation of critical prices.
The arrows beside the indications indicate the direction that the buying/selling volume was heading towards.
UP ARROW - indicates that equilibrium was had via increasing buy volume
DOWN ARROW - indicates that equilibrium was had via decreasing buy volume
Remember, this doesn't inherently mean that a stock is supposed to go up or down. Its just a representation of 'fair-value' points using volume. Also remember... both indicators provide what the other lacks. It isn't necessary to use both but for a broad overview of volume it definitely helps to at least be aware of how this information can be represented. Perhaps... consider switching between the two to see what you may be missing.
I believe finding 'fair-value' points via volume and price action provides a more objective way to measure what prices one should look at rather then arbitrary lines plotted on a chart. For more information feel welcome to look at the script that this code is based off of.

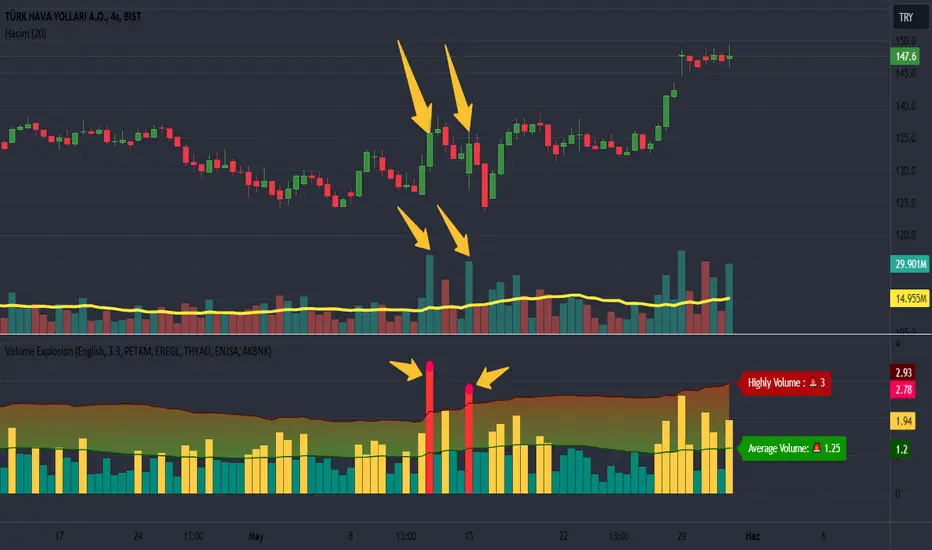
Volume Explosion [ProjeAdam]OVERVIEW
The purpose of the indicator is to detect significant changes in trading volume in financial markets.
USER GUIDE:
The user can change the sensitivity of the indicator by adjusting the multiplier value. The higher the multiplier, the harder it is to detect high volume bars.
The multiplier set by the user determines how much a move above the volume values is considered an "explosion". A higher multiplier results in fewer volume bursts being detected.
ALGORITHM
LANGUAGE
We have two different language options in our indicator. Users can use it in Turkish or English.
If we change the language option on our indicator, the language on our indicator that shows the upper and average level of our Band changes.
CALCULATING EXPLOSIONS
The indicator calculates the simple moving average of volume over a certain period of time. This average is used to identify abnormal movements by comparing it with the current volume.
If the current volume is higher than a certain multiple of the moving average, this is considered a volume burst. This indicates significant activity in the market.
ALARMS
We can change the parity for which we want to receive an alarm from the settings panel and ensure that we receive an alarm at the parity we want.
VİSUALİZATİON
When an alarm occurs in our parities, a separate indicator appears at the bottom right of the chart showing which parities the alarm is triggered in.
If there is no signal in the next bar, this table is automatically deleted.
Example
We understand that we have excessive volume in the two bars in our example and that interest in this financial product has increased in this region.
Benefits
This indicator is especially useful for traders who care about volume changes.
This indicator can be used as a helpful tool in trading decisions, as sudden increases in volume can be the beginning of a significant move in the market.
If you have any ideas what to add to my work to add more sources or make calculations cooler, suggest in DM .
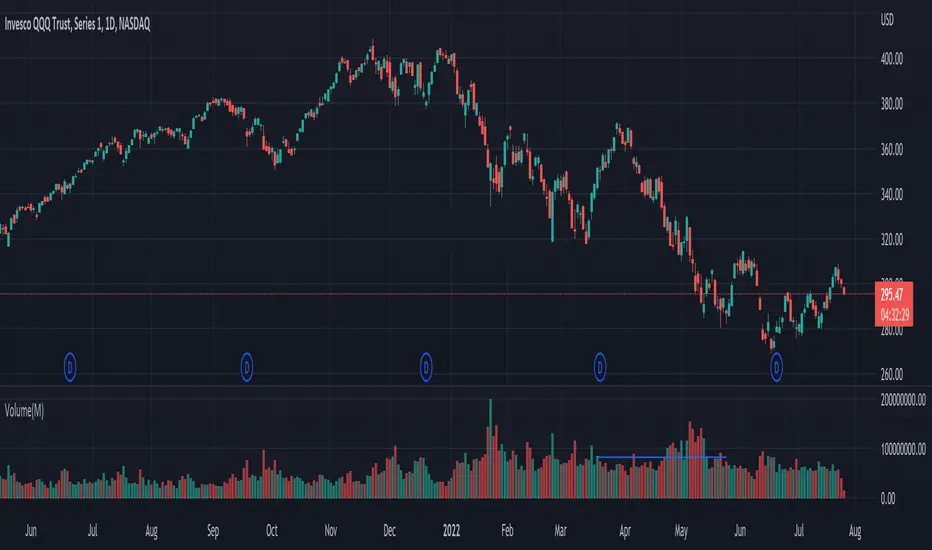
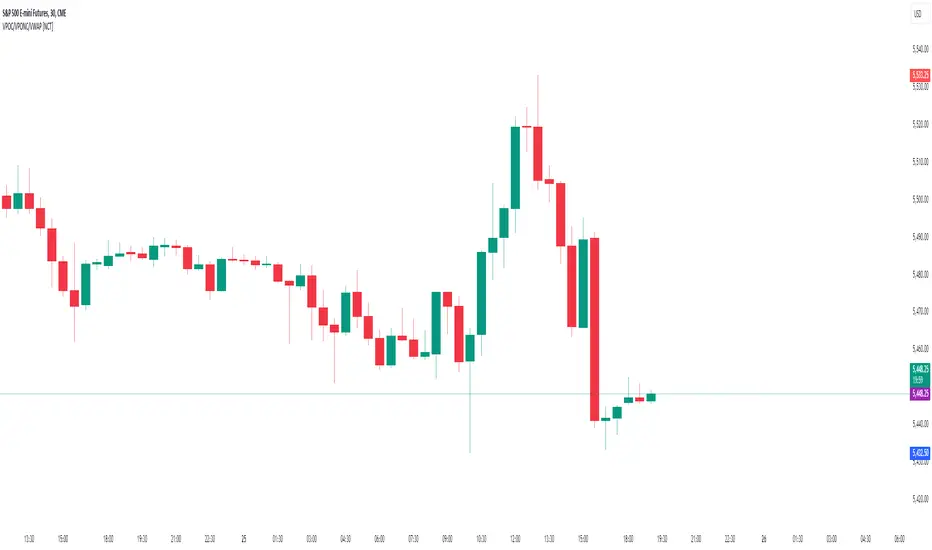
Volume Points of Control and No Control [NariCapitalTrading]Overview:
The "Volume Points of Control and No Control" (VPOC/VPONC) is a trading indicator/concept I designed to identify key price levels based on volume activity. It shows (on the price label on the y-axis) where there was the most (red) and the least (blue) volume over a specified lookback period. Read below for interpretation.
Key Features:
Identifies key price levels based on volume
Customizable lookback period and trade timeframe
Plots Volume Point of Control (VPOC) and Volume Point of No Control (VPONC)
Inputs and Calculations:
Custom Trade Timeframe: Allows users to set the desired timeframe for analysis (e.g., Daily, Weekly).
Lookback Period: Users can specify the period over which to analyze volume data.
VPOC Calculation: Determines the price level with the highest volume within the lookback period.
VPONC Calculation: Finds the price level with the lowest volume within the lookback period.
Indicator Usage:
The VPOC is considered a significant level where traders have shown the most interest, often acting as a strong support or resistance level. The VPONC, conversely, is a concept I made up. It represents a price level where 1) in an trending market, this price was accepted quickly, thus suggesting continuation of an trend. 2) price retracements will typically revisit thinly-traded price areas, the VPONC can sometimes signal an area of support in a downtrend.
Chart Representation:
VPOC Label: Plotted on the y-axis in red, indicating the price level with the highest volume.
VPONC Label: Displayed on the y-axis in blue, showing the price level with the least volume.
These labels are dynamically updated based on the user-specified lookback period and trade timeframe.
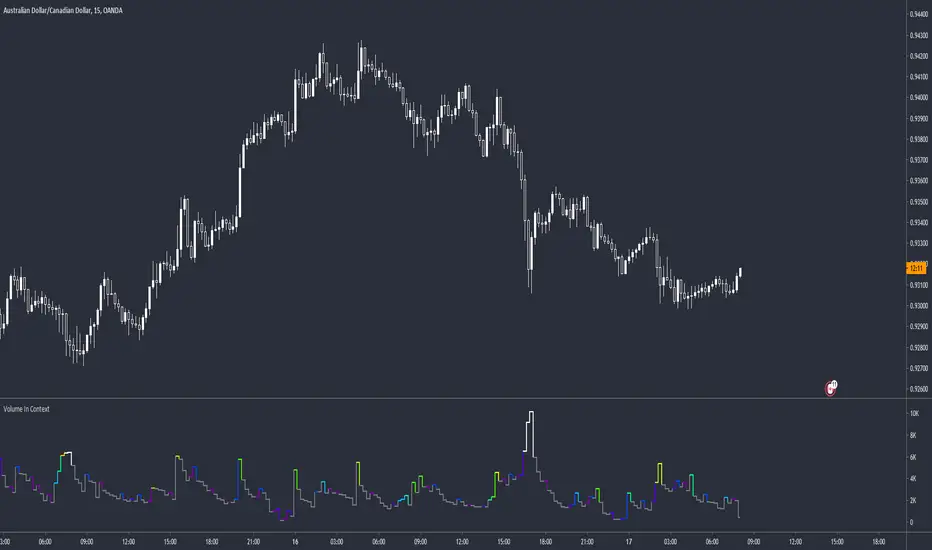
Volume Directional OscillatorVolume Directional Oscillator is an indicator that combines several types of metrics for a convenient understanding of price movements.
The indicator displays a histogram of red, dark red, green, dark green and yellow columns, as well as a red-green line.
Red columns indicate an increase in selling volumes as the price moves.
Dark red indicates a decline compared to the previous candle.
Green indicates an increase in buy volumes.
Dark green indicates a decline from the previous candle.
Yellow columns appear when the market moves without volume, in other words, by inertia.
The red-green line passing through the tops of the columns indicates that buyers or sellers currently prevail. Green are buyers and red are sellers.
It is also possible to display overbought and oversold levels. By default, they correspond to the values 50 and -50. When the indicator goes beyond one of the levels, the background turns orange. Line and background colors can be changed in the settings.
Also, the indicator can be used to determine divergences and convergences and use them in a trading strategy.
-------------------------------------------
Volume Directional Oscillator - индикатор осциляторного типа, который объединяет в себе несколько видов показателей для удобного понимания движения цен.
Индикатор отображает гистограмму из красных, темно-красных, зеленых, темно-зеленых и желтых полос, а также красно-зеленую линию.
Красные полосы обозначают увеличение объемов на продажу по мере движения цены.
Темно-красные обозначают снижение, по сравнению с предыдущей свечой.
Зеленые обозначают увеличение объемов на покупку.
Темно-зеленые обозначают снижение, по сравнению с предыдущей свечой.
Желтые полосы появляются, когда движение рынка происходит без объёма, другими словами — по инерции.
Красно-зеленая линия проходящая через вершины полос указывает на то, покупатели или продавцы в данный момент преобладают. Зеленая — покупатели, а красная — продавцы.
Еще есть возможность отобразить уровни перекупленности и перепроданности. По умолчанию, они соответствуют значениям 50 и -50. Вы выходе индикатора за один из уровней, фон окрашивается в оранжевый. Цвета линий и фона можно изменить в настройках.
Также, по индикатору можно определять дивергенции и конвергенции и использовать их в торговой стратегии.

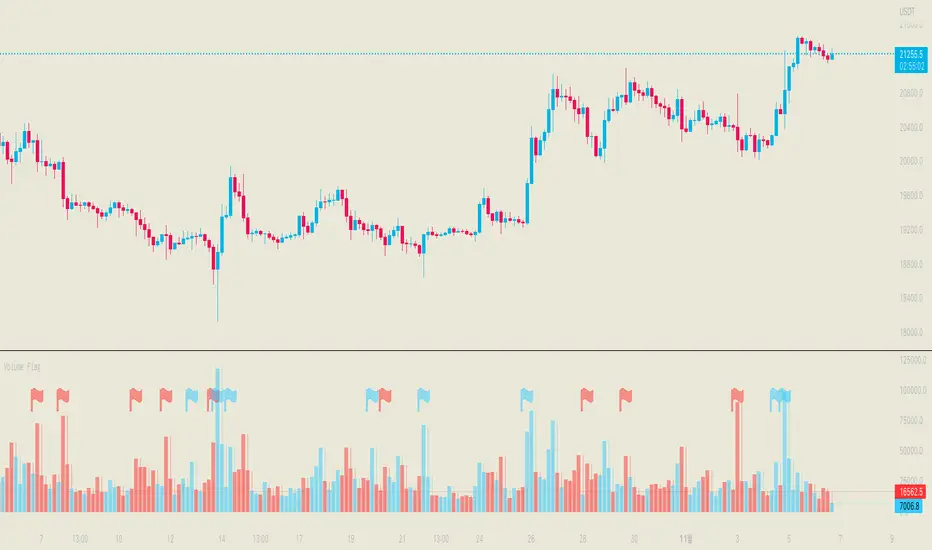
Volume FlagThis indicator shows the increased volume compared to the previous volume.
A flag is displayed when the trading volume increased by *n of the previous candle.
Receive a signal as an alert.
Thank you.
(Please comment and click on the rocket.)
-------------------
이 지표는 이전 캔들의 거래량 대비 증가된 거래량을 확인할 수 있습니다.
깃발을 사용하여 증가 감소를 확인할 수 있으며 n배 만큼의 증가 되었을때 표시됩니다.
그리고 깃발이 표시될 경우 알람을 받으실 수 있습니다.
감사합니다.
댓글과 로케트 클릭 부탁드립니다.
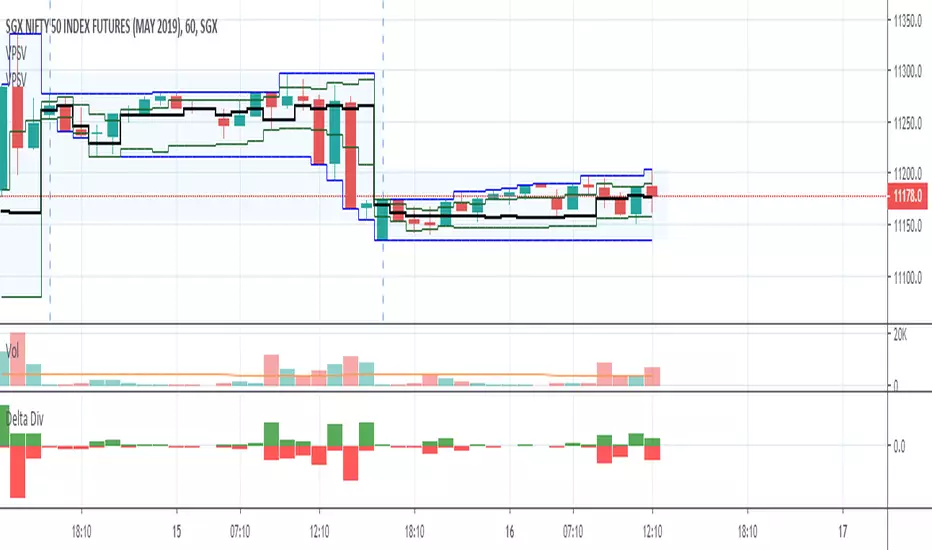
Volume Profile, Pivot Anchored by DGTVolume Profile (also known as Price by Volume ) is an charting study that displays trading activity over a specified time period at specific price levels. It is plotted as a horizontal histogram on the finacial isntrumnet's chart that highlights the trader's interest at specific price levels. Specified time period with Pivots Anchored Volume Profile is determined by the Pivot Levels, where the Pivot Points High Low indicator is used and presented with this Custom indicator
Finally, Volume Weighted Colored Bars indicator is presneted with the study
Different perspective of Volume Profile applications;
Anchored to Session, Week, Month etc : Anchored-Volume-Profile
Custom Range, Interactive : Volume-Profile-Custom-Range
Fixed Range with Volume Indicator : Volume-Profile-Fixed-Range
Combined with Support and Resistance Indicator : Price-Action-Support-Resistance and Volume-Profile
Combined with Supply and Demand Zones, Interactive : Supply-Demand-and-Equilibrium-Zones
Disclaimer : Trading success is all about following your trading strategy and the indicators should fit within your trading strategy, and not to be traded upon solely
The script is for informational and educational purposes only. Use of the script does not constitutes professional and/or financial advice. You alone the sole responsibility of evaluating the script output and risks associated with the use of the script. In exchange for using the script, you agree not to hold dgtrd TradingView user liable for any possible claim for damages arising from any decision you make based on use of the script

Volume SpikesOVERVIEW
Easily identify volume spikes. This indicator identifies volume spike bars and highlights them to facilitate studying volume spikes alongside price action.
CONCEPTS
Bars with abnormally high volume indicate market interest and are worth a closer look. They could indicate market exhaustion or act as future areas of S/R (as shown by the horizontal rays above).
The question is the level of volume that should prompt our interest.
Here, we use the Upper Band of a long-term Bollinger Bands applied on volume to identify bars with outlier volumes. (The lower panel of the chart shown serves to illustrate this concept, and is not included in this indicator.)
HOW TO USE
Volume spike bars will be highlighted in green by default. You may study how the market price action reacts to these volume spikes without the distraction of a separate plot.
Parameters
Period - Lookback period for the Bollinger Bands applied on volume.
Multiple - Multiple for the same Bollinger Bands.
Feel free to experiment with the parameters, but the default parameters work well for me on daily charts. However, for intraday timeframes, due to the typical skewing of volume to the beginning and end of a session, they do not work as well.
