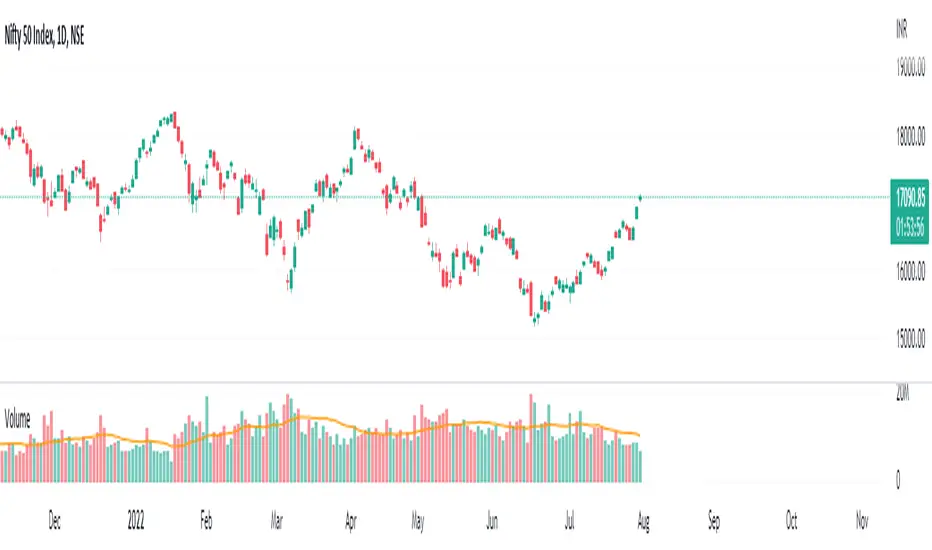
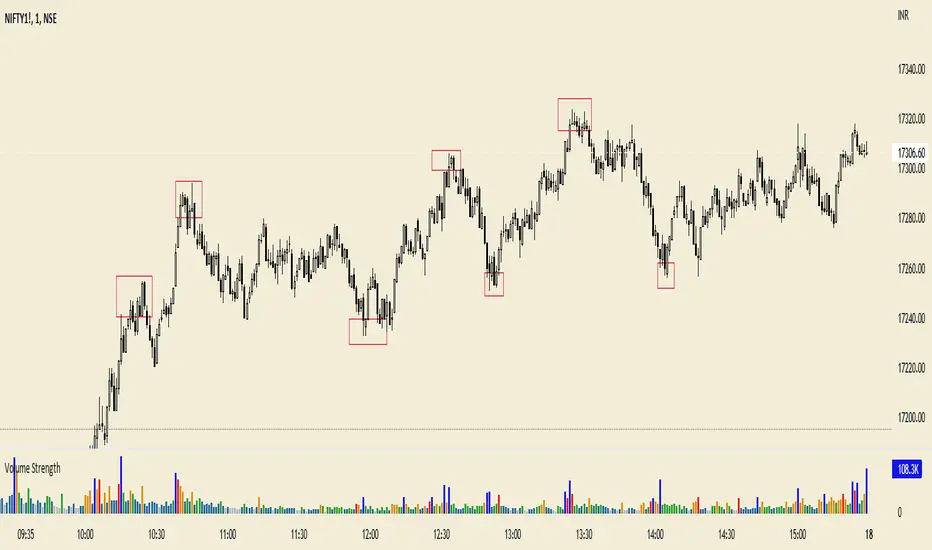
VolumeThis helps to view volume data for Nifty and BankNifty indices based on the futures volume. Other scrips' volume will be same as the available data.
#rvtradesetups #basils
Cerca negli script per "volume"
Volume DeltaVolume Delta is the difference between buying and selling power. Volume Delta is calculated by taking the difference of the volume that traded at the offer price and the volume that traded at the bid price. If delta is greater than 0 you have more buying than selling pressure. If delta is less than 0, you have more selling than buying pressure. This indicator also has a pivots and alarms. Before i create this indicator i'd try all off them on market but all off them seems doing wrong calculation. Price - Some people say "Price Action is King but actually DELTA is King!
By default, this indicator displays “Delta Volume and can be set to:
Plot Levels
Volume
Default TF:
1M
Strategy:
If you get 3 gren delta in a row its buying signal and visa versa for short. You can also use more confirmation with overbought\oversold level.

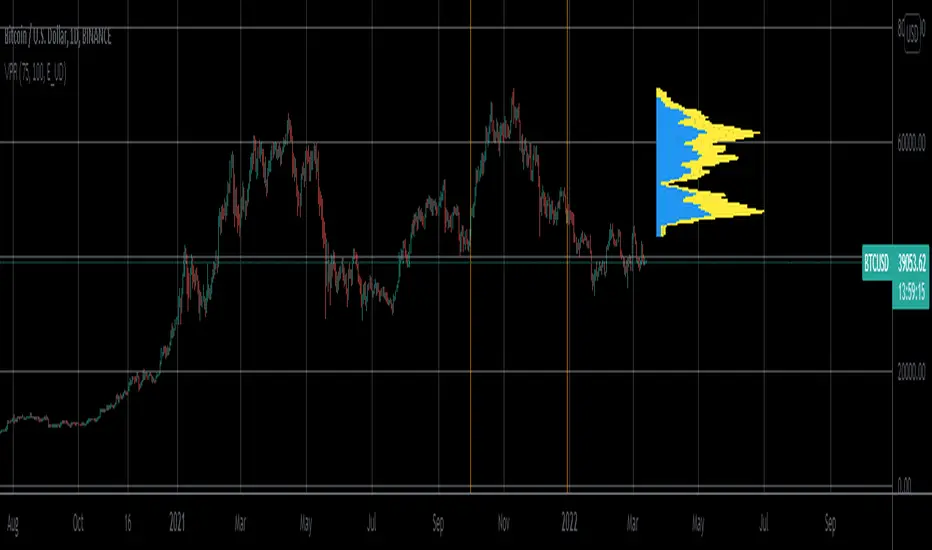
Volume Profile Range For All AccountsVolume Profile Range For All Accounts is displaying volume from price perspective. It’s done by summing volume by the “estimated” transaction price. This version is estimating it based on public volume data so it can be used with any account.
Volume Profile is a powerful tool commonly used by PRO users, to disseminate its use also by users who operate on basic volume data, we have prepared a set of scripts:
Volume Profile For All Accounts – Analyze last 50-20000 bars.
Volume Profile From Date For All Accounts – Analyze all bars since start date.
Volume Profile Range For All Accounts – Analyze bars in a range between start and end date.
Traiding View is supporting paid users with Volume Profile on extended volume dataset. We recommend to use it, because of access to more precise data.
Script Initialization:
After adding this script to the chart, a blue dialog with ‘Set the “start date” time for “VPR”’ label will be shown. You should pick ‘start date’ on the chart by pressing point on the chart. A line will appear in that place, that can be moved later by move over and catching a rectangle dot over the line.
After ‘start date’ selection, a blue dialog with ‘Set the “end date” time for “VPR”’. You should pick the ‘end date’ on the chart by pressing point on the chart. A line will appear in that place, that can be moved later by move over and catching a rectangle dot over the line.
If picked range is too small, a red label “Range should be bigger than 50 bars” will be shown. In that case just catch the rectangle dot over the line and move it to increase the range.
Settings:
SCANNER VISUALIZATION
Start date – Start date from which bars should be taken into account during calculations. For the narrow range, the estimation may differ significantly from the Volume Profile available for Paid Traiding View users.
End date – End date to which bars should be taken into account during calculations. For the narrow range, the estimation may differ significantly from the Volume Profile available for Paid Traiding View users.
Rows – Number of rows
Width – Width of the visualization.
Position – Position of the visualization:
S_DU – At START of the area, DOWN first
S_UD – At START of the area, UP first
BE_DU – At BEFORE END of the area, DOWN first
BE_UD – At BEFORE END of the area, UP first
E_DU – At END of the area, DOWN first
E_UD – At END of the area, UP first
Color Up – Color of volume classified as move Up, or Both if separation is off.
Color Down - Color of volume classified as move Down
Color Border – Border color.
Up/Down separate – Draw separate volume classified as Up and Down
Show values – Showing volume values of the bars.
Troubleshooting:
In case of any problems, send error details to the author of the script.
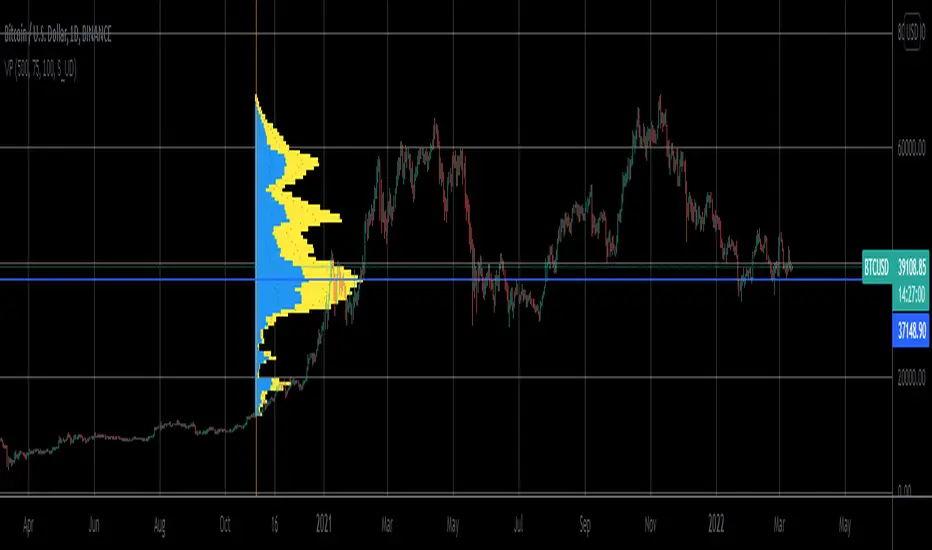
Volume Profile From Date For All AccountsVolume Profile From Date For All Accounts is displaying volume from price perspective. It’s done by summing volume by the “estimated” transaction price. This version is estimating it based on public volume data so it can be used with any account.
Volume Profile is a powerful tool commonly used by PRO users, to disseminate its use also by users who operate on basic volume data, we have prepared a set of scripts:
Volume Profile For All Accounts – Analyze last 50-20000 bars.
Volume Profile From Date For All Accounts – Analyze all bars since start date.
Volume Profile Range For All Accounts – Analyze bars in a range between start and end date.
Traiding View is supporting paid users with Volume Profile on extended volume dataset. We recommend to use it, because of access to more precise data.
Settings:
SCANNER VISUALIZATION
Start date – Start date from which bars should be taken into account during calculations. For the near past/small scope, the estimation may differ significantly from the Volume Profile available for Paid Traiding View users.
Rows – Number of rows
Width – Width of the visualization.
Position – Position of the visualization:
S_DU – At START of the area, DOWN first
S_UD – At START of the area, UP first
BE_DU – At BEFORE END of the area, DOWN first
BE_UD – At BEFORE END of the area, UP first
E_DU – At END of the area, DOWN first
E_UD – At END of the area, UP first
Color Up – Color of volume classified as move Up, or Both if separation is off.
Color Down - Color of volume classified as move Down
Color Border – Border color.
Up/Down separate – Draw separate volume classified as Up and Down
Show values – Showing volume values of the bars.
Troubleshooting:
In case of any problems, send error details to the author of the script.

Volume Profile For All AccountsVolume Profile For All Accounts is displaying volume from price perspective. It’s done by summing volume by the “estimated” transaction price. This version is estimating it based on public volume data so it can be used with any account.
Volume Profile is a powerful tool commonly used by PRO users, to disseminate its use also by users who operate on basic volume data, we have prepared a set of scripts:
Volume Profile For All Accounts – Analyze last 50-20000 bars.
Volume Profile From Date For All Accounts – Analyze all bars since start date.
Volume Profile Range For All Accounts – Analyze bars in a range between start and end date.
Traiding View is supporting paid users with Volume Profile on extended volume dataset. We recommend to use it, because of access to more precise data.
Settings:
SCANNER VISUALIZATION
Limit – How many last bars should be taken into account during calculations. For small values, the estimation may differ significantly from the Volume Profile available for Paid Traiding View users.
Rows – Number of rows
Width – Width of the visualization.
Position – Position of the visualization:
S_DU – At START of the area, DOWN first
S_UD – At START of the area, UP first
BE_DU – At BEFORE END of the area, DOWN first
BE_UD – At BEFORE END of the area, UP first
E_DU – At END of the area, DOWN first
E_UD – At END of the area, UP first
Color Up – Color of volume classified as move Up, or Both if separation is off.
Color Down - Color of volume classified as move Down
Color Border – Border color.
Up/Down separate – Draw separate volume classified as Up and Down
Show values – Showing volume values of the bars.
Troubleshooting:
In case of any problems, send error details to the author of the script.
VolumeThree lines are sigma 3x, 2x, and 1x volume (the multiple of upper BBand applied to volume).
Marks a diamond if 3x, a cross if 2x. it marks an x for statistically unusually quiet volume.
Bar is red when close*volume is under VWAP*volume, and green when the opposite is true.
You can also apply a summing function so that each bar is the sum of 'n' volume bars before it.

Volume SThis indicator based on volume. with special treatment I converted it to an indicator that can be use against any other well known indicator
have fun

Volume Wave V.1.0Volume wave Indicator is an important tool in the Wyckoffian Analysis of the stocks. It helps to understand the changing / continuation of bullish and bearish sentiment or the Buying and selling pressure. It also helps to understanding the waxing and waning buying and selling pressure and forewarns the changing sentiment. Along with the Price wave it helps to understand the effort and result ratios and the consequent effect on the stocks.


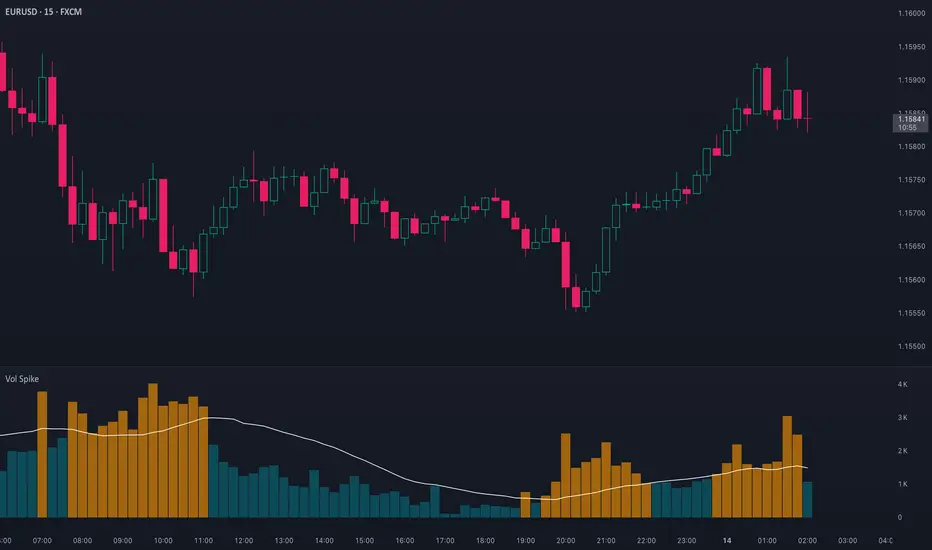
Volume Spike (Multi-Timeframe)Volume Spike (Multi-Timeframe)
Overview
Volume Spike (Multi-Timeframe) evaluates traded volume against its moving average on a selected timeframe so traders can identify when activity departs from recent norms.
What it does
Calculates volume on the chart timeframe or any alternate timeframe you select in the inputs.
Builds a configurable simple moving average to establish a rolling volume benchmark.
Applies distinct colors to spike and baseline volume columns to highlight deviations.
Plots the related moving-average line for reference.
Registers an alert condition when volume closes above its moving-average baseline.
How to use it
Choose the desired Volume Timeframe (leave blank to inherit the chart’s period).
Tune the Volume MA Length to balance responsiveness and noise.
Adjust the spike, base, and MA colors to align with existing chart styling.
Enable the alert condition when automated notification of spikes is needed.
Implementation notes
Timeframe selection is applied consistently to both the raw volume series and its moving average.
Color inputs allow visual adjustments without modifying code.
Alert messaging specifies that the event is a volume spike relative to the selected timeframe baseline.
Disclaimer
This indicator is designed as a technical analysis tool and should be used in conjunction with other forms of analysis and proper risk management.
Past performance does not guarantee future results, and traders should thoroughly test any strategy before implementing it with real capital.
Volume Orderflow Delta @MaxMaseratiVolume Orderflow Delta @MaxMaserati
🎯 INSTITUTIONAL ORDERFLOW ANALYSIS TOOL
This advanced indicator reveals where BIG MONEY (institutions, hedge funds, smart money) is actively trading by analyzing sophisticated volume patterns and order flow dynamics. It goes far beyond basic volume analysis to detect specific institutional behaviors and trading patterns.
📊 CORE FUNCTIONALITY
Four Analysis Columns:
- VPD (Volume Per Delta): Net institutional pressure and absorption patterns
- VPS (Volume Per Seller): Institutional selling pressure zones
- VPB (Volume Per Buyer): Institutional buying pressure zones
- SVP (Session Volume Profile): Total institutional activity zones
Enhanced Delta Calculation:
- Uses real bid/ask data (95% accuracy on 1-tick timeframe)
- Advanced price action analysis (85% accuracy on other timeframes)
- Significantly more precise than standard volume delta methods
🎨 SMART INSTITUTIONAL PATTERN DETECTION
Advanced Pattern Recognition:
- 🧊 Iceberg Orders: Hidden institutional size appearing repeatedly
- ⚡ Failed Auctions: Identifies truly trapped institutional traders
- 💜 Volume Exhaustion: Detects ending institutional momentum
- 🟨🟧 Absorption Patterns: Shows institutional level defense
- 🔥 Liquidity Sweeps: Identifies institutional stop-hunting
Professional Color System:
- Electric Blue/Bright Magenta: Large passive institutional orders
- Neon Green/Bright Red: Aggressive institutional entries
- Gold/Brown: Trapped institutional traders (underwater positions)
- Cyan: Hidden institutional iceberg orders
- Deep Pink: Institutional liquidity sweeps
⚠️ IMPORTANT DISCLAIMERS & REQUIREMENTS
📚 EDUCATION REQUIREMENT
YOU MUST LEARN VOLUME/DELTA ANALYSIS BEFORE USING THIS TOOL
This is an advanced institutional analysis tool requiring solid understanding of:
- Volume profile concepts and interpretation
- Order flow analysis and market microstructure
- Delta analysis and its implications
- Institutional trading behaviors and patterns
Recommended Learning Path:
1. Study volume profile analysis fundamentals
2. Learn order flow and market microstructure basics
3. Understand delta analysis interpretation
4. Practice on paper trading or small positions
5. Gradually increase position sizing as competency develops
🧪 MANDATORY TESTING REQUIREMENT
EXTENSIVE TESTING IS REQUIRED BEFORE LIVE TRADING
- Test the indicator across different market conditions
- Backtest patterns on historical data
- Paper trade signals for minimum 30 days
- Understand how patterns behave in your specific markets/timeframes
- Verify pattern accuracy in your trading environment
📋 USER RESPONSIBILITY DISCLAIMER
ALL TRADING DECISIONS AND OUTCOMES ARE YOUR SOLE RESPONSIBILITY
- This indicator provides analysis tools, NOT trading advice
- No guarantee of profitability or accuracy
- Past performance does not indicate future results
- You are responsible for risk management and position sizing
- Seek professional financial advice if needed
- Use only risk capital you can afford to lose
🎛️ CUSTOMIZATION OPTIONS
Layout Styles:
- Back-to-Back: Traditional volume profile layout
- Face-to-Face: Orderbook simulation style
- Adjustable spacing and positioning
Color Systems:
- Smart Institutional Coloring: Advanced pattern recognition
- Classic Red/Green: Traditional volume profile colors
Detection Sensitivity:
- Adjustable thresholds for all pattern types
- Customizable institutional size detection
- Configurable absorption and spike parameters
💡 PROFESSIONAL USAGE TIPS
1. Start Conservative: Begin with higher detection thresholds
2. Multiple Timeframes: Analyze across different timeframe contexts
3. Confluence: Combine with other technical analysis methods
4. Market Context: Consider overall market environment and news
5. Risk Management: Always use proper position sizing and stop losses
🚨 FINAL WARNING
This is a professional-grade analysis tool designed for experienced traders who understand volume analysis and institutional behavior. Improper use or lack of understanding can result in significant losses. Education, testing, and personal responsibility are mandatory prerequisites for successful utilization.
Trade at your own risk. This indicator does not guarantee profits.

Volume VisualizerVolume by Hannsome
The Volume Visualizer is a simple yet effective tool designed to display trading volume in a dedicated panel below the main price chart. Its primary goal is to help you easily identify when trading activity is significantly higher than usual.
The indicator plots two key elements:
Volume Bars: These are standard volume bars showing the amount of trading activity for each period. To draw your attention to important moments, bars with unusually high volume are highlighted in a distinct color (yellow by default).
Average Volume Line: A moving average line (orange by default) is plotted over the volume bars. This line represents the recent average trading volume, giving you a clear baseline to compare the current volume against.
A "significant" volume spike is defined as any period where the volume exceeds the moving average by a certain multiplier. You can adjust both the moving average length and this multiplier in the indicator's settings to fine-tune its sensitivity to what you consider a significant spike in activity.

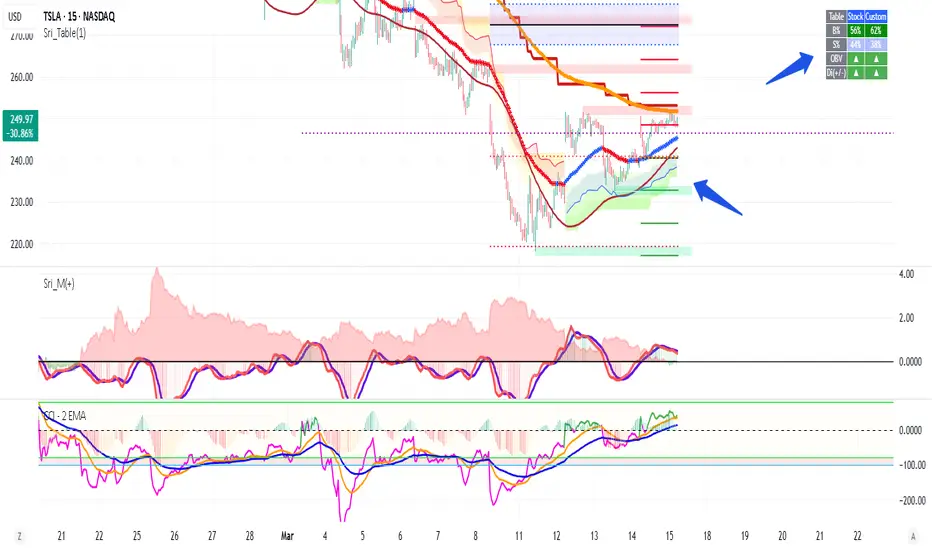
Volume +OBV + ADXVolume + OBV + ADX Table
Optimized Buyer & Seller Volume with Trend Indications
Overview:
This indicator provides a comprehensive view of market participation and trend strength by integrating Volume, On Balance Volume (OBV) trends, and ADX (Average Directional Index) signals into a visually structured table. Designed for quick decision-making, it highlights buyer and seller dominance while comparing the selected stock with another custom symbol.
Features:
✅ Buyer & Seller Volume Analysis:
Computes buyer and seller volume percentages based on market movements.
Displays daily cumulative volume statistics to assess ongoing market participation.
✅ On Balance Volume (OBV) Trends:
Identifies positive, negative, or neutral OBV trends using an advanced smoothing mechanism.
Highlights accumulation or distribution phases with colored visual cues.
✅ ADX-Based Trend Confirmation:
Evaluates Directional Indicators (DI+ and DI-) to determine the trend direction.
Uses customizable ADX settings to filter out weak trends.
Provides uptrend, downtrend, or neutral signals based on strength conditions.
✅ Custom Symbol Comparison:
Allows users to compare two different assets (e.g., a stock vs. an index or ETF).
Displays a side-by-side comparison of volume dynamics and trend strength.
✅ User-Friendly Table Display:
Presents real-time calculations in a compact and structured table format.
Uses color-coded trend signals for easier interpretation.
Recommended Usage for Best Results:
📌 Pairing this indicator with Sri_Momentum and Sri(+) Pivot will enhance accuracy and provide better trade confirmations.
📌 Adding other major indicators like RSI, CCI, etc., will further increase the probability of winning trades.
How to Use:
Select a custom symbol for comparison.
Adjust ADX settings based on market conditions.
Analyze the table to identify buyer/seller dominance, OBV trends, and ADX trend strength.
Use the combined signals to confirm trade decisions and market direction.
Best Use Cases:
🔹 Trend Confirmation – Validate breakout or reversal signals.
🔹 Volume Strength Analysis – Assess buyer/seller participation before entering trades.
🔹 Multi-Asset Comparison – Compare the behavior of two related instruments.
This indicator is ideal for traders looking to combine volume dynamics with trend-following strategies. 🚀📈
Volume Rate of Change (VROC)Volume Rate of Change (VROC) is an indicator that calculates the percentage change in trading volume over a specific period, helping analyze market momentum and activity. It is calculated as:
VROC = ((Current Volume - Past Volume) ÷ Past Volume) × 100
This indicator shows changes in market interest. Positive values indicate increasing volume, while negative values signal a decrease. High VROC values often suggest potential trend reversals or breakouts.
Applications:
Breakout Validation: VROC > 200% confirms strong breakouts; below this may signal false moves.
Market Stagnation: VROC < 0% suggests shrinking volume and range-bound markets.
Trend End Alert: A drop below 0% during trends may indicate weakening momentum.
Adjusting for Timeframes: Tailor VROC to timeframes.
Examples:
Daily: VROC(5) compares with last week's same day; VROC(20) with 1 month ago.
Monthly: VROC(12) compares with the same month last year; VROC(1) with last month.
Intraday: VROC(24) (hourly) and VROC(288) (5 minutes) for the same time yesterday.

Volume HIGH/CLIMAX
Volume is the number of shares of a security traded during a given period of time.
Generally securities with more daily volume are more liquid than those without, since they are more "active".
Volume is an important indicator in technical analysis because it is used to measure the relative significance of a market move.
The higher the volume during a price move, the more significant the move and the lower the volume during a price move, the less significant the move.
A climax occurs at the end of a bull or bear market cycle and is characterized by escalated trading volume and sharp price movements.
Climaxes are usually preceded by extreme sentiment readings, either excessive euphoria at market peaks, or excessive pessimism at market bottoms.
Essentially, climaxes are a result of a resolution in supply and demand factors.
Buying Climaxes
One of the clearest signals of the end of a bull market is a buying climax, during which volume escalates to extreme levels and bullish euphoria permeates media coverage of stocks, market indices, or commodities . The key trait of a buying climax is the exhaustion of demand as the last buyers enter the market. The final surge of buying typically leads to price spikes, which may last for days, weeks, or months. As demand wanes, buyers become less willing to pay higher prices. There may be a brief period of stagnation in prices before a combination of profit-taking and new sellers set in motion the start of a sharp reversal.
Selling Climaxes
The beginning of a selling climax is often signaled by steadily increasing volume on the sell side of the market as growing pessimism accelerates the downtrend. As the selling climax approaches, the last buyers finally capitulate, driving shares sharply lower. Once the supply side of the market abates, demand at support levels can cause the price to level off before a combination of profit-taking and new buyers set in motion the start of a sharp reversal.
Volume Forecast === Volume Forecast ===
The idea of "Vwap BLVD"(Closing vwap value of most recent highest volume Day of which todays price is coming in contact with above or below) is to show when you are running into "overhead supply", and or "Demand zones" on the daily chart , or intraday. You can use the Volume Forecast to check throughout the day to see if we are on pace on the current day to "beat" the Blvd's launch dates recorded volume . You can go long on positive volume forecasts toward blvd, or on the break and hold over, or you can go short against Blvd on a negative/lower forecast at the rejection of Vwap Blvd or key technical highs
You can use this label tool after the open, checking periodically to see what VF% on the day were at thus far, and does today's Forecast have a positive expectancy in relation to previous high volume days in question? Or does it have a negative expectancy based on a lower forecast number than the highest volume day and possibly slow % gains over the first hour, (checking every 15min and notating increase or decrease) thus possibly failing to over come previous over head volume resistance from the highest volume day.
Scenarios would be-
Long- We have a previous highest volume day metric of 10Mil on the daily chart. Today we have a Small gap, high PM Volume, and First 30min Were already at 50% of a 100Mil forecast. In this scenario, i would have more confidence getting long once we have reached key support areas or broken and held prior highs or vwap of the highest volume day knowing that we are forecasting MUCH higher on the day then highest volume day previously.
Short- Would be just the opposite. We have a Gapper in the morning of which has a previous high volume day of 100mil, and were interacting with that days range. low volume premarket, and out of the bell we spike but fail, and VF% is very slow to rise, and our total forecast on the day is only showing 5mil on the day total after the first 30min. I would feel confident going short against Vwap BLVD or a prior HOD from the highest volume days price range, knowing we wont have enough volume to clear the overhead volume supply.
Ive also included a small table that covers AVG vol on the time frame of your current chart. RVOL and ATR as well to help ID outlier type moves.
ALL METRICS INCLUDING VOLUME FORECAST CALCULATE FOR THE TIME FRAME YOUR CHART IS CURRENTLY ON.
Best results and most accurate readings for Forecast have been on the 1min and daily chart. Using both time frames for cross comparison intraday to gauge the volume flow after open every 15 min for the first hour or so of market. Volume forecast DOES NOT work outside of normal market hours on trading view. It will reflect negative numbers in off hours depending on the volume done on the day in that stock and in some replay modes.
This is a SIMPLE study, I wanted to KEEP it that way. So it was EASY to read, and less to be confused about.
ARE WE DEALING WITH A EARLY BIG, HIGH % IN FIRST HOUR FORECAST FOR TODAY VS PRIOR HIGH VOL DAYS???
Or
ARE WE DEALING WITH A LOW, SLOW BUILDING FORECAST IN THE FIRST HOUR FOR TODAY VS PRIOR HIGH VOL DAYS KEY LEVELS?
The easier and simple it is to read this, the faster and cleaner you can execute.
Hope you enjoy.
JMF
SPECIAL THANKS TO ©Rumpypumpydumpy AN AMAZING CODER IVE BEEN WORKING WITH FOR HELP WITH THE FINAL LOGIC AND CLEANING THE CODE AND VISUAL ASPECTS UP.
Make sure to stop by his page here on trading view and check out some of his amazing studies.
If you have any questions feel free to Dm here.

Volume Average % Cross - Default Volume Average Percentage Cross Indicator - Default
This version is specialized for notifications on your volume bars. If you wish to see notifications on your chart please choose "Volume Average Percentage Cross Indicator - Chart".
What is the Volume Average % Cross - Chart Indicator you might ask yourself - what is it for?
I will tell you!
Use Case:
In my Indicator you have an Input to set the period for the volume average period.
Once the volume average period is calculated it is now necessary to choose the percentage value.
What is the percentage value?
The percentage value multiplies the past volume bar with a positive percentage value and a negative percentage value. I give this calculation the name "VolPercentage".
If the volume average is below the negative VolPercentage Value it means that the last volume bar is stronger than the volume average period by the percentage you set the percentage value input at.
If the volume average is above the positive VolPercentage Value it means that the last volume bar is weaker than the volume average period by the percentage you set the percentage value input at.
That means that if for example the percentage value would be 20 it would require the volume average to be 20% above the past volume bar.
That means that if for example the percentage value would be 20 it would require the volume average to be 20% lower than the past volume bar.
Once I uploaded my 100 Indicators I will accurately describe each indicator with videos, this will be huge!
Interpretation:
Volume is the amount of market participants who bought in a candlestick bar a set amount of shares at varying prices from within the bar itself.
If volume decreases it means that there has been fewer market participants and if it increases it means that there is an increase of market participants.
If this is used with candlestick patterns it helps tremendously to identify strong or weak doji candlesticks .

Volume Average Cross - VAC ChartVolume Average Cross Chart Indicator
This indicator plots signals from two different volume averages when they cross on the chart.
It does not show the default volume bars, to see them please go to my VAC Default Indicator.
This is VAC Chart. If you want to see the crosses on your volume bars and not on the chart please go to my VAC Default Indicator.
Rules:
Fast Volume Period always has to be lower than the Slow Volume Period to trigger correct signals.
Inputs:
-> Fast Volume Average Period
-> Slow Volume Average Period
-> Option to enable/disable the cross-signals

Volume Average Cross - VAC DefaultVolume Average Cross Default Indicator
This indicator plots signals from two different visual volume averages when they cross.
In does in addition to that show the default volume bars.
This is VAC Default. If you need to see the crosses on your chart and not on the volume bars please go to my VAC Chart Indicator.
Rules:
Fast Volume Period always has to be lower than the Slow Volume Period to trigger correct signals.
Inputs:
-> Fast Volume Average Period
-> Slow Volume Average Period
-> Option to enable/disable the cross-signals and to show/hide both volume averages.

Volume Treshold [UTS]Volume Treshold
If volume of a candle is more than x percent of the average volume of the last n candles, it changes colour.
Can be shown on the candles themselves and could be set to independent figures vs the volume bars
Both elements of this, the volume bars and candles could be edited independently with the following values;
- Lookback period how many bars should be taken into consideration
- % that causes it to be triggered settable in decimals up to 3.5 where 1.0 equals to 100%
- Colour to change the volume bar to can be set via menu
- Colour to change the candle to can be set via menu
- Ability to show the treshold as visualized drawing over the histogram
- Ability to choose smoothing method SMA | EMA
- Optional: to add a moving average to the volume bars
Note: only works on charts with volume information
Volume with SD+2Volume with SD+2
Volume with SMA20 and Standard Deviation +2
If Volume < SMA20 , mean Volume Low and less momentum.
If Volume > SMA20 and < SD2 , mean Volume Increase and more momentum.
If Volume > SD2 , mean Volume Climax , show strong trend but show reversal point in someitmes.
Volume Ticks - Increasing Volume Bar Count [LucF]Volume Ticks is a zero-lag market sentiment indicator. It works by providing a cumulative count of increasing volume columns.
A one count is added for each increasing volume column where close>open, and one is subtracted on an increasing volume column if close
Volume Flow IndicatorVolume flow analysis
This indicator measures volume-weighted money flow by comparing price changes against a volatility-based threshold, then smoothing the result - when VFI is above zero (green cloud) it suggests accumulation/buying pressure, while below zero (red cloud) indicates distribution/selling pressure.
